4 sometimes-conflicting ways I’m thinking about the economy 😬😞😎🙃
Plus a charted review of the macro crosscurrents 🔀
📈The stock market rallied to all-time highs, with the S&P 500 setting an intraday high of 6,532.65 on Friday and a closing high of 6,502.08 on Thursday. The index is now up 10.2% year-to-date. For more on the market, read: 15 charts to consider with the stock market at record highs 📊📈
-
Last year, I wrote about how there are four different ways your view of the economy can be informed: hard economic data, soft economic data, the stock market, and your personal biases.
The point is that it’s possible to have what appear to be conflicting views of the economy, even though you’re not disagreeing on the facts.
Let me demonstrate by offering my views on the current state of the economy while wearing each of these four different hats.
Hard-data hat: The economy is barely growing, and recession risk is up 😬
Hard data is anything that reflects quantifiable and observable behavior — stuff that is actually happening. These include metrics such as employment and personal spending, which help us determine whether the economy is in expansion or recession.
From the perspective of hard data, I don’t feel as great about the economy as I used to.
The hard data have cooled so much that we are arguably at an economic tipping point. Job creation has fallen to near zero, personal consumption has plateaued, industrial production is going sideways, and capex order activity is off its high.
Notably, the ratio of job openings per unemployed persons fell below 1:1 in July for the first time in over four years.

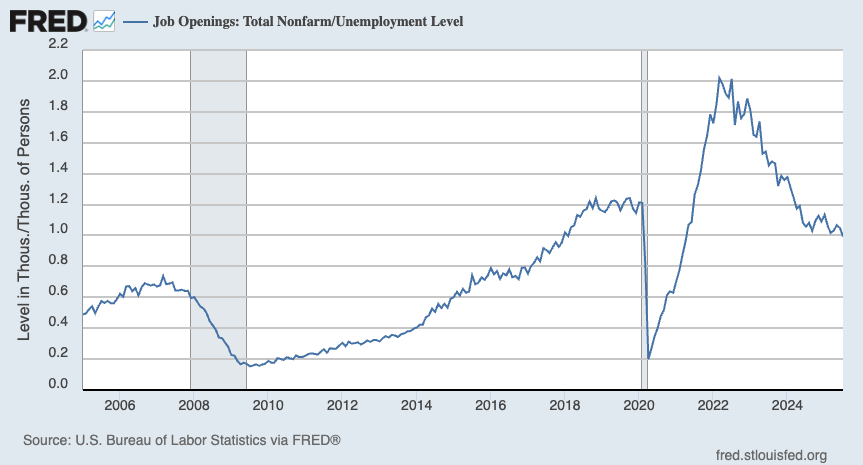
While this ratio continues to suggest there are many jobs for the taking, the situation is nowhere near as robust as it was during the early stages of the current economic expansion.
Economists often discuss the relationship between job openings and unemployment with the Beveridge curve, which shows that declining job openings are correlated with rising unemployment.
“We’re operating along a segment of the Beveridge Curve where declines in excess labor demand, as proxied by falling job openings, will result in larger increases in the unemployment rate,” Renaissance Macro’s Neil Dutta wrote on Wednesday. “Not good.”
I’m not convinced that we are doomed to fall into recession. However, I think it is increasingly hard to argue that growth is destiny.
For more, read: We're at an economic tipping point ⚖️
Soft-data hat: Businesses are nervous, and people are increasingly depressed about their prospects 😞
Soft data is generated through surveys of consumers and business operators expressing their opinions, feelings, and expectations about things like job security, financial health, inflation, future business activity, and labor quality. Popular reports capturing soft data include S&P Global’s Purchasing Managers Index, the NFIB’s Small Business Optimism Index, and the University of Michigan’s Surveys of Consumers.
According to the ISM, purchasing managers have said manufacturing activity has been contracting for six straight months.
Even though the unemployment rate remains very low at 4.3%, people don’t feel great about the economy. Political polarization, social media, low-quality news organizations, and the proliferation of misinformation have all contributed to this disconnect between hard and soft data in recent years.
The Wall Street Journal recently published the results of a survey, and it was bleak. From the article:
A new Wall Street Journal-NORC poll finds that the share of people who say they have a good chance of improving their standard of living fell to 25%, a record low in surveys dating to 1987. More than three-quarters said they lack confidence that life for the next generation will be better than their own, the poll found.
Nearly 70% of people said they believe the American dream—that if you work hard, you will get ahead—no longer holds true or never did, the highest level in nearly 15 years of surveys.
The fact that the hard data has been deteriorating in recent months hasn’t helped any of this.
If there’s reason for optimism, it’s the fact that the economy has continued to grow despite all this pessimism. Imagine how much the economy might boom if sentiment made a big move upward?
Stock-market hat: Winning in this lackluster economy 😎
In the short run, the hard and soft economic data can spark volatility in the stock market. Technical factors in the markets will also move prices in the near term. Pretty much anything you imagine can affect trader decisions and investor sentiment, which in turn affects the markets over short periods of time.
But in the long run, the most important driver of stock prices is earnings.
And the outlook for earnings continues to be up.
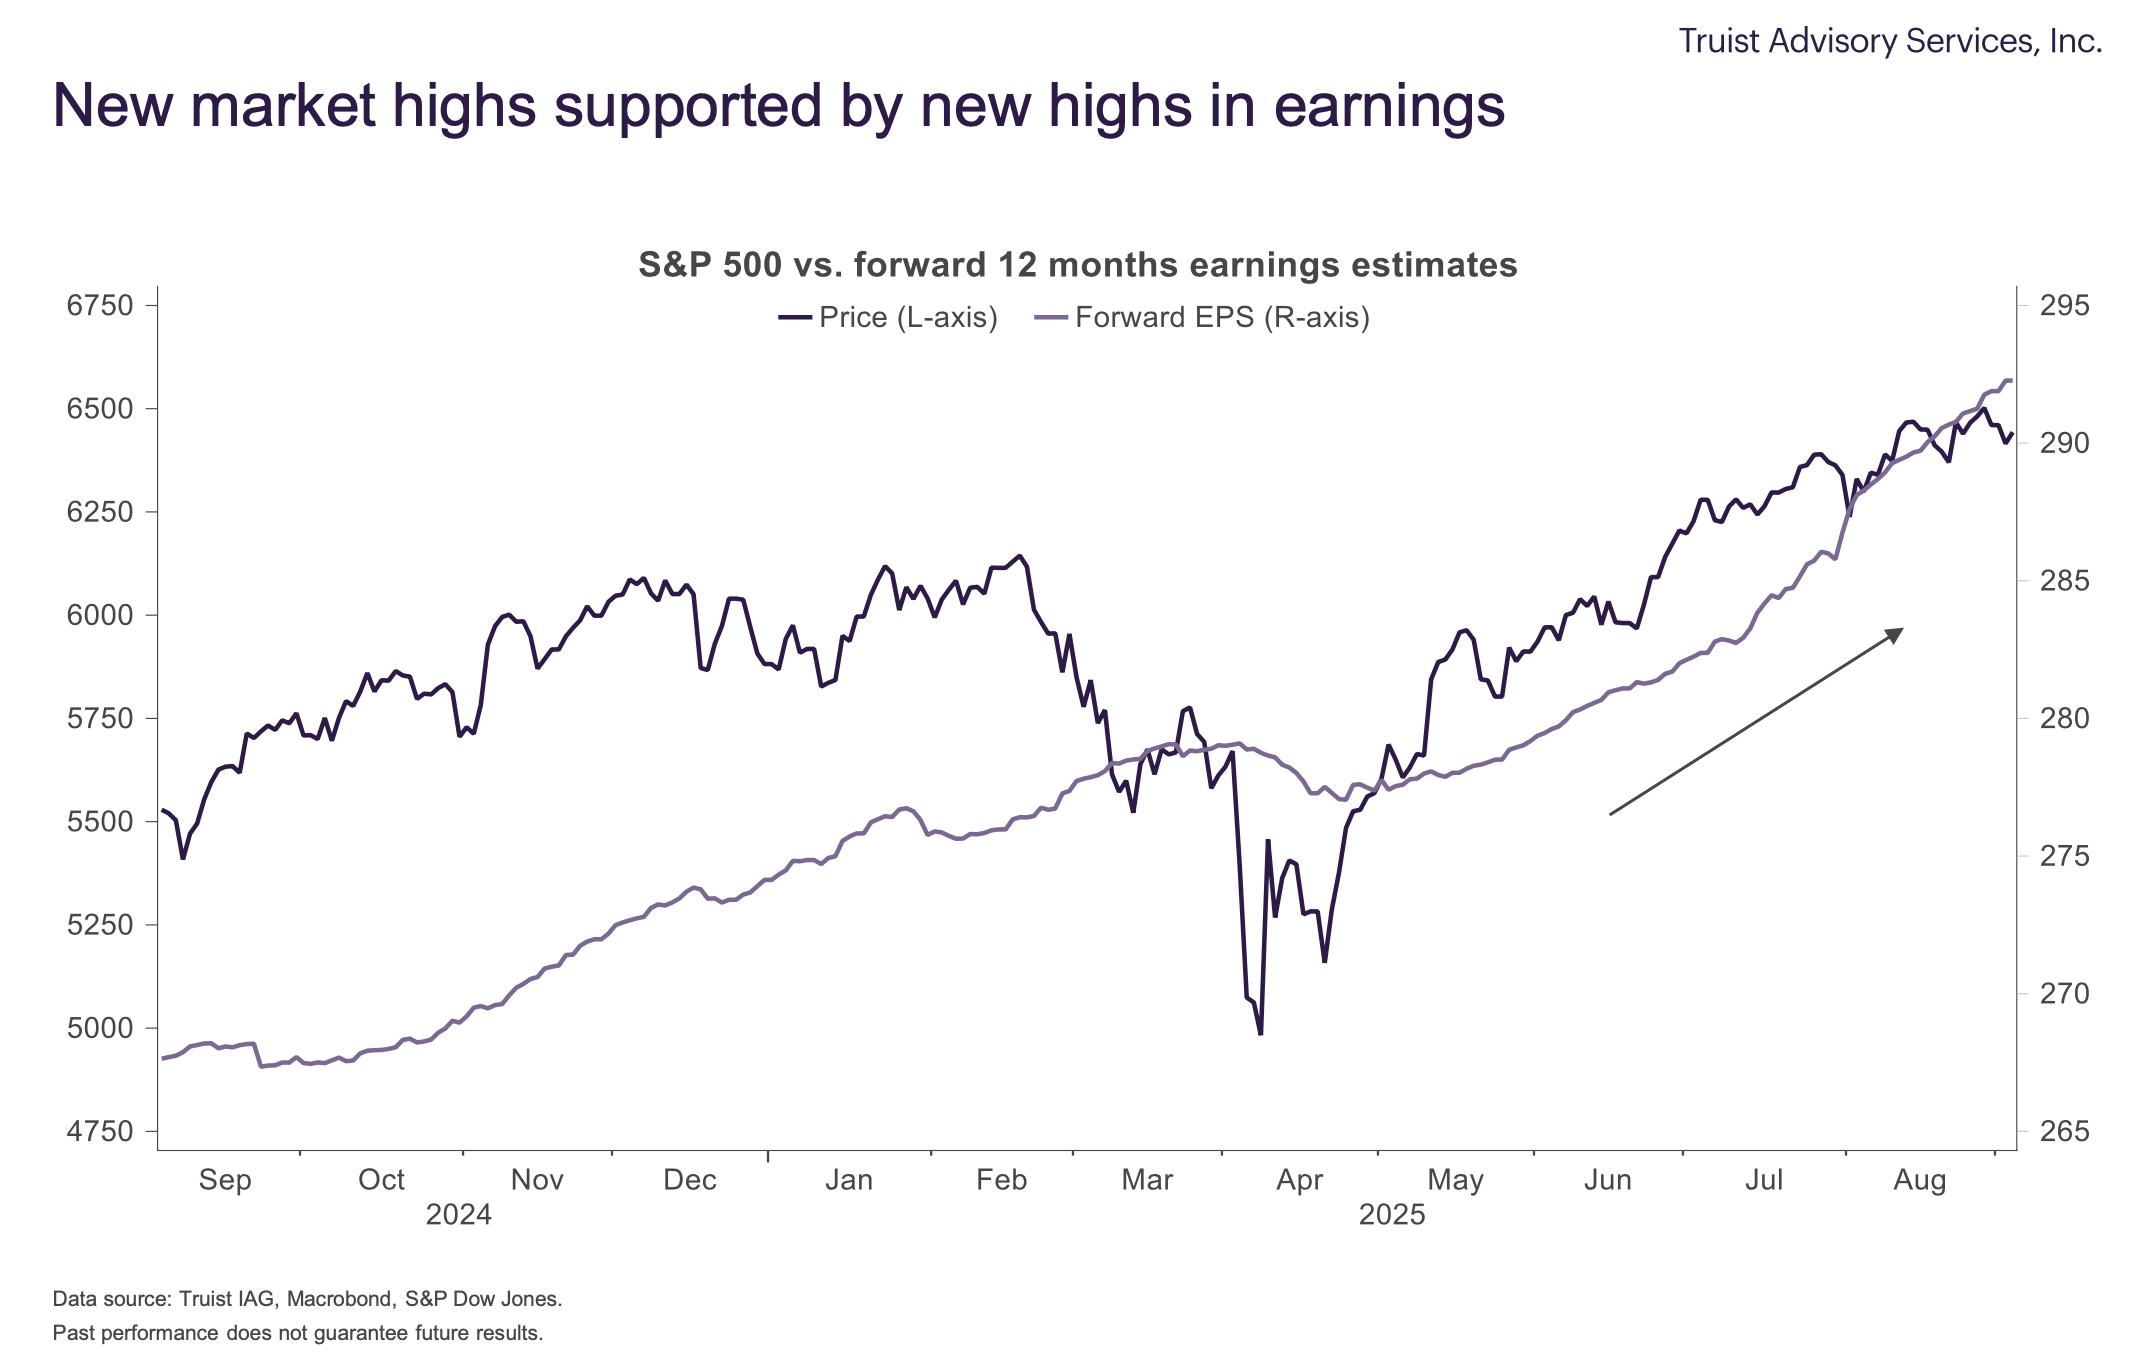
The bullish corporate earnings story is in stark contrast to the lackluster economic growth story.
As Goldman Sachs analysts argued recently, the companies in the stock market benefit from greater international exposure, dollar depreciation, and a tilt toward large tech companies.
So while economic conditions may not be favorable for everyone, they’ve at least been favorable for the large companies that make up the stock market.
People can say whatever they want about how much stock prices have rallied in recent years, and how we may or may not be “due” for a major downturn. But I’d argue these calls lack merit if they don’t address the fact that earnings have been going up and are expected to continue going up.
For more on this, read: The stock market and the economy are diverging 📊 and What's the bottom line? 📝
My biased hat: My portfolio is hotter than my business 🙃
Some people will do poorly in a strong economy. Some will thrive in a struggling economy.
Your view on the economy will be affected by your personal circumstances.
That said, I personally have mixed emotions.
As the owner of TKer, I couldn’t be more thrilled that the stock market has been rallying to new all-time highs. After all, TKer tells the story about how the stock market usually goes up.
But the rally has ironically been a bit bittersweet. Engagement on TKer has cooled, and the pace of subscriber growth has recently leveled off. This is not surprising. In my 19 years in financial publishing, one thing I’ve learned is that reader interest is highest during market downturns and volatile periods. Meanwhile, when stock prices are trending higher — like they have been for most of the summer — fewer people are interested in better understanding what drives the market.
In other words, what’s good for your portfolio in the near-term is less than great for the financial information business. And vice versa.
So yeah, it bums me out to see that fewer people are subscribing and fewer subscribers are opening emails as the stock market sets new all-time highs.
Of course, I would never wish there to be more market volatility.
Fortunately, as a long-term investor in the stock market, I’m naturally hedged!
Zooming out 🔭
Like I said, TKer tells the story of how the stock market usually goes up. It’s a stock market newsletter.
And while I’ll continue to write about hard and soft economic data, and everything in between, it’ll always be written from the perspective of investors in the stock market.
-
More from TKer:
Review of the macro crosscurrents 🔀
There were several notable data points and macroeconomic developments since our last review:
📉 Job creation is stalling. According to the BLS’s Employment Situation report released Friday, U.S. employers added just 22,000 jobs in August. Notably, the June tally was revised down to a loss of 13,000 jobs. It’s a reminder that we’re at an economic tipping point.

Total payroll employment is at a record 159.5 million jobs, up 7.2 million from the prepandemic high.

The unemployment rate — that is, the number of workers who identify as unemployed as a percentage of the civilian labor force — rose to 4.3% during the month. While the metric continues to hover near 50-year lows, it is now also at its highest level since October 2021.

While the major metrics continue to reflect modest job growth and low unemployment, the labor market isn’t as hot as it used to be.
For more on the labor market, read: We're at an economic tipping point ⚖️ and 9 once-hot economic charts that cooled 📉
💸 Wage growth could be lower. Average hourly earnings rose by 0.27% month-over-month in August, down from the 0.33% pace in July. On a year-over-year basis, August’s wages were up 3.7%.

For more on why policymakers are watching wage growth, read: Revisiting the key chart to watch amid the Fed's war on inflation 📈
💼 Job openings tick lower. According to the BLS’s Job Openings and Labor Turnover Survey, employers had 7.18 million job openings in July, down from 7.36 million in June.

During the month, there were 7.24 million unemployed people — meaning there were 0.99 job openings per unemployed person. This continues to be one of the more obvious signs of excess demand for labor. However, this metric has returned to prepandemic levels.

For more on job openings, read: Were there really twice as many job openings as unemployed people? 🤨 and Revisiting the key chart to watch amid the Fed's war on inflation 📈
👍 Layoffs remain depressed, hiring remains firm. Employers laid off 1.81 million people in July. While challenging for the people affected, this figure represents just 1.1% of total employment. This metric remains below prepandemic levels.

For more on layoffs, read: Every macro layoffs discussion should start with this key metric 📊
Hiring activity continues to be much higher than layoff activity. During the month, employers hired 5.31 million people.

That said, the hiring rate — the number of hires as a percentage of the employed workforce — has been trending lower, which could be a sign of trouble to come in the labor market.

For more on why this metric matters, read: The hiring situation 🧩
🤔 People are quitting less. In July, 3.21 million workers quit their jobs. This represents 2.0% of the workforce. While the rate is above recent lows, it continues to trend below prepandemic levels.

A low quits rate could mean a number of things: more people are satisfied with their job, workers have fewer outside job opportunities, wage growth is cooling, or productivity will improve as fewer people are entering new, unfamiliar roles.
For more, read: Promising signs for productivity ⚙️
💪 Labor productivity increases. From the BLS: “Nonfarm business sector labor productivity increased 3.3% in the second quarter of 2025 … as output increased 4.4% and hours worked increased 1.1%. (All quarterly percent changes in this release are seasonally adjusted annualized rates.) From the same quarter a year ago, nonfarm business sector labor productivity increased 1.5% in the second quarter of 2025.”

💰 Job switchers still get better pay. According to ADP, which tracks private payrolls and employs a different methodology than the BLS, annual pay in August for people who changed jobs was up 7.1% from a year ago. For those who stayed at their job, pay was up 4.4%.

For more on why policymakers are watching wage growth, read: Revisiting the key chart to watch amid the Fed's war on inflation 📈
💼 New unemployment claims tick higher, total ongoing claims remain elevated. Initial claims for unemployment benefits rose to 237,000 during the week ending Aug. 30, up from 229,000 the week prior. This metric remains at levels historically associated with economic growth.

Insured unemployment, which captures those who continue to claim unemployment benefits, declined to 1.94 million during the week ending Aug. 23. This metric is near its highest level since November 2021.

Low initial claims confirm that layoff activity remains low. Elevated continued claims confirm hiring activity is weakening. This dynamic warrants close attention, as it reflects a deteriorating labor market.
For more context, read: The hiring situation 🧩 and The labor market is cooling 💼
💳 Card spending data is holding up. From JPMorgan: “As of 29 Aug 2025, our Chase Consumer Card spending data (unadjusted) was 4.8% above the same day last year. Based on the Chase Consumer Card data through 29 Aug 2025, our estimate of the US Census August control measure of retail sales m/m is 0.36%.”
From BofA: “Total card spending per HH was up 2.8% y/y in the week ending Aug 30, according to BAC aggregated credit & debit card data. Some of the jump in total spending growth might be due to the timing of Labor Day relative to last year (9/1/25 vs 9/2/24). But y/y spending growth for week ending in Sat pre-Labor Day was a solid 1.9% (ex of timing change), supporting a 3Q rebound.”
For discussion on how sales may be inflated due to tariffs, read: A BIG economic question right now 🤔
🏠 Mortgage rates tick lower. According to Freddie Mac, the average 30-year fixed-rate mortgage stood at 6.5%, down from 6.56% last week: “Mortgage rates continue to trend down, increasing optimism for new buyers and current owners alike. As rates continue to drop, the number of homeowners who have the opportunity to refinance is expanding. In fact, the share of market mortgage applications that were for a refinance reached nearly 47%, the highest since October.”

There are 147.9 million housing units in the U.S., of which 86.1 million are owner-occupied and about 39% are mortgage-free. Of those carrying mortgage debt, almost all have fixed-rate mortgages, and most of those mortgages have rates that were locked in before rates surged from 2021 lows. All of this is to say: Most homeowners are not particularly sensitive to the small weekly movements in home prices or mortgage rates.
For more on mortgages and home prices, read: Why home prices and rents are creating all sorts of confusion about inflation 😖
👍 Manufacturing activity surveys improve. From S&P Global’s August U.S. Manufacturing PMI: “The past three months have seen the strongest expansion of production since the first half of 2022, with the upturn gathering pace in August amid rising sales. Hiring also picked up again in August as factories took on more staff to meet an influx of new orders and an accumulation of uncompleted work for waiting customers.”

The ISM’s August Manufacturing PMI suggests the sector is in contraction. But the pace of contraction has improved from the prior month.

👍 Services activity surveys remain positive. From S&P Global’s August U.S. Services PMI: “Together with a robust manufacturing PMI reading, the surveys are consistent with the US economy growing at a solid 2.4% annualized rate in the third quarter. Fuller order books, reflecting a summer upturn in customer demand, has meanwhile encouraged service providers to take on additional staff in increasing numbers, accompanied by a return to hiring in the manufacturing sector. While low household confidence is reportedly keeping spending on consumer services relatively subdued, demand for financial services is showing especially strong growth amid improving financial market conditions.”

The ISM’s August Services PMI also signaled expansion in the sector.

Keep in mind that during times of perceived stress, soft survey data tends to be more exaggerated than actual hard data.
For more on this, read: What businesses do > what businesses say 🙊
🔨 Construction spending ticks lower. Construction spending decreased 0.1% to an annual rate of $2.139 trillion in July.

🏢 Offices remain relatively empty. From Kastle Systems: “Peak day office occupancy was 61.2% on Tuesday last week, down nine tenths of a point from the previous week. Most cities experienced decreased occupancy throughout the week, as summer winds down. In New York, for example, peak day occupancy fell 2.8 points on Tuesday to 54.3%, more than 16 points lower than the post-pandemic record high set in July. Austin, however, peaked on Wednesday at 81.7%, the highest single-day office occupancy in any tracked city since the pandemic. The average low was 34.3% on Friday.”

For more on office occupancy, read: This stat about offices reminds us things are far from normal 🏢
📈 Near-term GDP growth estimates are tracking positively. The Atlanta Fed’s GDPNow model sees real GDP growth rising at a 3.0% rate in Q3.

For more on GDP and the economy, read: 9 once-hot economic charts that cooled 📉 and We're at an economic tipping point ⚖️
Putting it all together 📋
🚨 The Trump administration’s pursuit of tariffs is disrupting global trade, with significant implications for the U.S. economy, corporate earnings, and the stock market. Until we get more clarity, here’s where things stand:
Earnings look bullish: The long-term outlook for the stock market remains favorable, bolstered by expectations for years of earnings growth. And earnings are the most important driver of stock prices.
Demand is positive: Demand for goods and services remains positive, supported by healthy consumer and business balance sheets. Job creation, although cooling, also remains positive, and the Federal Reserve — having resolved the inflation crisis — shifted its focus toward supporting the labor market.
But growth is cooling: While the economy remains healthy, growth has normalized from much hotter levels earlier in the cycle. The economy is less “coiled” these days as major tailwinds like excess job openings and core capex orders have faded. It has become harder to argue that growth is destiny.
Actions speak louder than words: We are in an odd period, given that the hard economic data decoupled from the soft sentiment-oriented data. Consumer and business sentiment has been relatively poor, even as tangible consumer and business activity continues to grow and trend at record levels. From an investor’s perspective, what matters is that the hard economic data continues to hold up.
Stocks are not the economy: There’s a case to be made that the U.S. stock market could outperform the U.S. economy in the near term, thanks largely to positive operating leverage. Since the pandemic, companies have aggressively adjusted their cost structures. This came with strategic layoffs and investment in new equipment, including hardware powered by AI. These moves are resulting in positive operating leverage, which means a modest amount of sales growth — in the cooling economy — is translating to robust earnings growth.
Mind the ever-present risks: Of course, we should not get complacent. There will always be risks to worry about, such as U.S. political uncertainty, geopolitical turmoil, energy price volatility, and cyber attacks. There are also the dreaded unknowns. Any of these risks can flare up and spark short-term volatility in the markets.
Investing is never a smooth ride: There’s also the harsh reality that economic recessions and bear markets are developments that all long-term investors should expect as they build wealth in the markets. Always keep your stock market seat belts fastened.
Think long-term: For now, there’s no reason to believe there’ll be a challenge that the economy and the markets won’t be able to overcome over time. The long game remains undefeated, and it’s a streak that long-term investors can expect to continue.
For more on how the macro story is evolving, check out the previous review of the macro crosscurrents. »
Key insights about the stock market 📈
Here’s a roundup of some of TKer’s most talked-about paid and free newsletters about the stock market. All of the headlines are hyperlinked to the archived pieces.
10 truths about the stock market 📈
The stock market can be an intimidating place: It’s real money on the line, there’s an overwhelming amount of information, and people have lost fortunes in it very quickly. But it’s also a place where thoughtful investors have long accumulated a lot of wealth. The primary difference between those two outlooks is related to misconceptions about the stock market that can lead people to make poor investment decisions.
The makeup of the S&P 500 is constantly changing 🔀
Passive investing is a concept usually associated with buying and holding a fund that tracks an index. And no passive investment strategy has attracted as much attention as buying an S&P 500 index fund. However, the S&P 500 — an index of 500 of the largest U.S. companies — is anything but a static set of 500 stocks.

The key driver of stock prices: Earnings💰
For investors, anything you can ever learn about a company matters only if it also tells you something about earnings. That’s because long-term moves in a stock can ultimately be explained by the underlying company’s earnings, expectations for earnings, and uncertainty about those expectations for earnings. Over time, the relationship between stock prices and earnings has a very tight statistical relationship.

Stomach-churning stock market sell-offs are normal🎢
Investors should always be mentally prepared for some big sell-offs in the stock market. It’s part of the deal when you invest in an asset class that is sensitive to the constant flow of good and bad news. Since 1950, the S&P 500 has seen an average annual max drawdown (i.e., the biggest intra-year sell-off) of 14%.
How the stock market performed around recessions 📉📈
Every recession in history was different. And the range of stock performance around them varied greatly. There are two things worth noting. First, recessions have always been accompanied by a significant drawdown in stock prices. Second, the stock market bottomed and inflected upward long before recessions ended.

In the stock market, time pays ⏳
Since 1928, the S&P 500 generated a positive total return more than 89% of the time over all five-year periods. Those are pretty good odds. When you extend the timeframe to 20 years, you’ll see that there’s never been a period where the S&P 500 didn’t generate a positive return.

What a strong dollar means for stocks 👑
While a strong dollar may be great news for Americans vacationing abroad and U.S. businesses importing goods from overseas, it’s a headwind for multinational U.S.-based corporations doing business in non-U.S. markets.

Economy ≠ Stock Market 🤷♂️
The stock market sorta reflects the economy. But also, not really. The S&P 500 is more about the manufacture and sale of goods. U.S. GDP is more about providing services.

Stanley Druckenmiller's No. 1 piece of advice for novice investors 🧐
…you don't want to buy them when earnings are great, because what are they doing when their earnings are great? They go out and expand capacity. Three or four years later, there's overcapacity and they're losing money. What about when they're losing money? Well, then they’ve stopped building capacity. So three or four years later, capacity will have shrunk and their profit margins will be way up. So, you always have to sort of imagine the world the way it's going to be in 18 to 24 months as opposed to now. If you buy it now, you're buying into every single fad every single moment. Whereas if you envision the future, you're trying to imagine how that might be reflected differently in security prices.
Peter Lynch made a remarkably prescient market observation in 1994 🎯
Some event will come out of left field, and the market will go down, or the market will go up. Volatility will occur. Markets will continue to have these ups and downs. … Basic corporate profits have grown about 8% a year historically. So, corporate profits double about every nine years. The stock market ought to double about every nine years… The next 500 points, the next 600 points — I don’t know which way they’ll go… They’ll double again in eight or nine years after that. Because profits go up 8% a year, and stocks will follow. That's all there is to it.
Warren Buffett's 'fourth law of motion' 📉
Long ago, Sir Isaac Newton gave us three laws of motion, which were the work of genius. But Sir Isaac’s talents didn’t extend to investing: He lost a bundle in the South Sea Bubble, explaining later, “I can calculate the movement of the stars, but not the madness of men.” If he had not been traumatized by this loss, Sir Isaac might well have gone on to discover the Fourth Law of Motion: For investors as a whole, returns decrease as motion increases.
Most pros can’t beat the market 🥊
According to S&P Dow Jones Indices (SPDJI), 65% of U.S. large-cap equity fund managers underperformed the S&P 500 in 2024. As you stretch the time horizon, the numbers get even more dismal. Over a three-year period, 85% underperformed. Over a 10-year period, 90% underperformed. And over a 20-year period, 92% underperformed. This 2023 performance follows 14 consecutive years in which the majority of fund managers in this category have lagged the index.

Proof that 'past performance is no guarantee of future results' 📊
Even if you are a fund manager who generated industry-leading returns in one year, history says it’s an almost insurmountable task to stay on top consistently in subsequent years. According to S&P Dow Jones Indices, just 4.21% of all U.S. equity funds in the top half of performance during the first year were able to remain in the top during the four subsequent years. Only 2.42% of U.S. large-cap funds remained in the top half
SPDJI’s report also considered fund performance relative to their benchmarks over the past three years. Of 738 U.S. large-cap equity funds tracked by SPDJI, 50.68% beat the S&P 500 in 2022. Just 5.08% beat the S&P in the two years ending 2023. And only 2.14% beat the index in the three years ending in 2024.

The odds are stacked against stock pickers 🎲
Picking stocks in an attempt to beat market averages is an incredibly challenging and sometimes money-losing effort. Most professional stock pickers aren’t able to do this consistently. One of the reasons for this is that most stocks don’t deliver above-average returns. According to S&P Dow Jones Indices, only 24% of the stocks in the S&P 500 outperformed the average stock’s return from 2000 to 2022. Over this period, the average return on an S&P 500 stock was 390%, while the median stock rose by just 93%.
