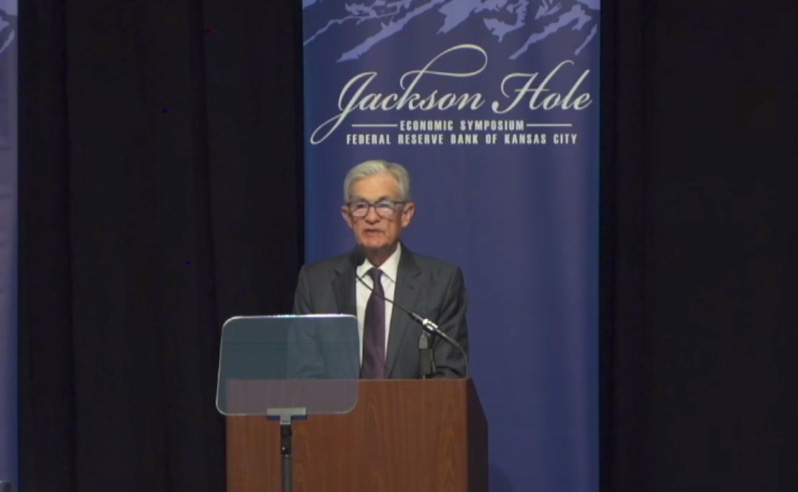
Fed Chair Powell: It's a 'challenging situation' ⚖️
Plus a charted review of the macro crosscurrents 🔀

📈The stock market rose, with the S&P 500 climbing 0.3% to end the week at 6,466.91. The index is now up 10% year-to-date. For more on the market, read: 15 charts to consider with the stock market at record highs 📊📈
-
Federal Reserve Chair Jerome Powell acknowledged that deteriorating labor market dynamics are increasingly worrisome.
“Overall, while the labor market appears to be in balance, it is a curious kind of balance that results from a marked slowing in both the supply of and demand for workers,” Powell said at the Kansas City Fed’s Jackson Hole Economic Policy Symposium on Friday. “This unusual situation suggests that downside risks to employment are rising. And if those risks materialize, they can do so quickly in the form of sharply higher layoffs and rising unemployment.”
Indeed, while job creation has flatlined, the unemployment rate hasn’t really budged. This can be explained by the fact that, among other things, “Tighter immigration policy has led to an abrupt slowdown in labor force growth.“ The result is that both the demand for (numerator) and the supply of (denominator) labor have cooled, causing the unemployment rate to be stable. Unfortunately, this dynamic also points to a slowing economy.
As Powell spoke, traders ramped up their bets that the Fed would loosen monetary policy by cutting interest rates at its September meeting. According to the CME’s FedWatch tool, the market is placing a 75% probability that the Fed will lower its benchmark rate target range to 4%-4.25%, down from its current target range of 4.25%-4.5%.

This comes amid building inflation pressures, which have been the main reason policy hawks have argued that the Fed should not cut rates.
Powell spoke to this concern.
“Higher tariffs have begun to push up prices in some categories of goods,” he said. “The effects of tariffs on consumer prices are now clearly visible. We expect those effects to accumulate over coming months, with high uncertainty about timing and amounts.“
The Fed Chair mentioned “tariffs” six times in his speech.

On balance, it appears concerns about the labor market now outweigh concerns about inflation. From Powell’s speech (emphasis added):
Putting the pieces together, what are the implications for monetary policy? In the near term, risks to inflation are tilted to the upside, and risks to employment to the downside — a challenging situation. When our goals are in tension like this, our framework calls for us to balance both sides of our dual mandate. Our policy rate is now 100 basis points closer to neutral than it was a year ago, and the stability of the unemployment rate and other labor market measures allows us to proceed carefully as we consider changes to our policy stance. Nonetheless, with policy in restrictive territory, the baseline outlook and the shifting balance of risks may warrant adjusting our policy stance.
Many Fed watchers interpreted that last line as a green light for a rate cut in September.
You can read Powell’s full speech here.
Fed policy matters more during periods of economic stress ⚖️
I’ve held the view that whether or not the Fed cuts rates is not the right question.
That’s because rate cuts and rate hikes — in and of themselves — aren’t the real issue. Rather, they represent reactions to real issues.
As I explained back in January 2024, the right question is, ”What are the economic developments causing the Fed to adjust monetary policy?”
Much of the past two years has been characterized by an economy growing at a healthy clip as price inflation cooled. Under these favorable dynamics, my view has been that the Fed’s policy moves take a backseat to the fundamental forces driving the markets and the economy.
This isn’t to say the Fed doesn’t matter. It’s just that their decisions matter more during times of economic stress. For example, I don’t think anyone would disagree that Fed policy decisions were critically important during the global financial crisis, the COVID-19 pandemic, and the recent inflation crisis.
That brings us to today.
The economy appears to be at a tipping point, with many major economic metrics either slowing or stalling.
The weaker the economy gets, the more the Fed matters.
The conundrum 🔀
Many Fed watchers have been arguing for months that the slowing economic growth metrics justify interest rate cuts.
But as Powell communicated at Jackson Hole, it’s not that simple.
Inflation metrics have turned upward in recent months as the effects of higher tariffs have begun to work through supply chains. In theory, looser monetary policy can exacerbate inflation. For this reason, inflation hawks argue against rate cuts.
For what it’s worth, a 25-basis-point rate cut doesn’t make monetary policy “loose.” It makes it “less tight.” After all, monetary policy is not a switch — it’s a dial.
From a markets perspective, it’s not so much about whether or not the Fed cuts rates. What matters is where the economy heads as the Fed directs monetary policy. Because hotter inflation from looser monetary policy could prove just as unwelcome as deteriorating labor market conditions from tighter monetary policy.
The Fed’s next monetary policy announcement is scheduled for 2 pm ET on September 17. That means there’s a full month’s worth of economic data to be released before the Fed finalizes its decision on interest rates.
All eyes are on the data as any one report threatens to shift the balance on whether or not the Fed should cut rates.
As Powell said, it’s “a challenging situation.”
-
Related from TKer:
'How many times will the Fed cut rates?' is not the right question for stock market investors 🔪
A blunt message for those asking what Fed rate cuts mean for stocks ✂️
There's a more important force than the Fed driving the stock market 💪
Review of the macro crosscurrents 🔀
There were several notable data points and macroeconomic developments since our last review:
💼 New unemployment claims and total ongoing claims rise. Initial claims for unemployment benefits rose to 235,000 during the week ending Aug. 16, up from 224,000 the week prior. This metric remains at levels historically associated with economic growth.

Insured unemployment, which captures those who continue to claim unemployment benefits, rose to 1.972 million during the week ending Aug. 9. This metric is at its highest level since November 2021.

Steady initial claims confirm that layoff activity remains low. Rising continued claims confirm hiring activity is weakening. This dynamic warrants close attention, as it reflects a deteriorating labor market.
For more context, read: The hiring situation 🧩 and The labor market is cooling 💼
💳 Card spending data is holding up. From JPM: “As of 15 Aug 2025, our Chase Consumer Card spending data (unadjusted) was 4.1% above the same day last year. Based on the Chase Consumer Card data through 15 Aug 2025, our estimate of the US Census August control measure of retail sales m/m is 0.41%.”
For discussion on how sales may be inflated due to tariffs, read: A BIG economic question right now 🤔
⛽️ Gas prices tick lower. From AAA: “This past week, the national average for a gallon of regular fell three cents to $3.13. You’d have to go back to 2020 for a lower national average on August 21 – that day the price was $2.18. With gas prices for this day the lowest they’ve been in 5 years, some are wondering if the national average will go below $3 a gallon in the coming weeks. There are too many variables to make a prediction; the oil market is too volatile. But if crude oil prices remain low and barring any major geopolitical events or tropical storms hitting the Gulf Coast, it’s safe to say drivers could continue to see cheaper prices at the pump as summer winds down.”

For more on energy prices, read: Higher oil prices meant something different in the past 🛢️
🏘️ Home sales tick higher. Sales of previously owned homes increased by 2.0% in July to an annualized rate of 4.01 million units. From NAR chief economist Lawrence Yun: “The ever-so-slight improvement in housing affordability is inching up home sales. Wage growth is now comfortably outpacing home price growth, and buyers have more choices. Condominium sales increased in the South region, where prices had been falling for the past year.”

July’s prices for previously owned homes declined month over month, but rose year over year. From the NAR: “The median existing-home sales price for all housing types in July was $422,400, up 0.2% from one year ago ($421,400) – the 25th consecutive month of year-over-year price increases.”

From Yun: “Near-zero growth in home prices suggests that roughly half the country is experiencing price reductions. Overall, homeowners are doing well financially. Only 2% of sales were foreclosures or short sales – essentially a historic low. The market's health is supported by a cumulative 49% home price appreciation for a typical American homeowner from pre-COVID July 2019 to July this year.“
For more on housing, read: The U.S. housing market has gone cold 🥶
🏠 Homebuilder sentiment remains in the dumps. From the NAHB: “Affordability continues to be the top challenge for the housing market and buyers are waiting for mortgage rates to drop to move forward. Builders are also grappling with supply-side headwinds, including ongoing frustrations with regulatory policies connected to developing land and building homes.”

🔨 New home construction starts rise. Housing starts increased 5.2% in July to an annualized rate of 1.43 million units, according to the Census Bureau. Building permits ticked down 2.8% to an annualized rate of 1.35 million units.

🏠 Mortgage rates hold steady. According to Freddie Mac, the average 30-year fixed-rate mortgage stood at 6.58%, unchanged from last week. From Freddie Mac: “The 30-year fixed-rate mortgage remained flat this week. Over the summer, rates have come down and purchase applications are outpacing 2024, though a number of homebuyers continue waiting on the sideline for rates to further decrease.”

There are 147.9 million housing units in the U.S., of which 86.1 million are owner-occupied and about 39% are mortgage-free. Of those carrying mortgage debt, almost all have fixed-rate mortgages, and most of those mortgages have rates that were locked in before rates surged from 2021 lows. All of this is to say: Most homeowners are not particularly sensitive to the small weekly movements in home prices or mortgage rates.
For more on mortgages and home prices, read: Why home prices and rents are creating all sorts of confusion about inflation 😖
🏢 Offices remain relatively empty. From Kastle Systems: “Peak day office occupancy was 61.7% on Tuesday last week, down 1.4 points from the previous week, as workers took time away from the office toward the end of the summer vacation season. The average low was 33.7% on Friday, down three tenths of a point from the previous week.”

For more on office occupancy, read: This stat about offices reminds us things are far from normal 🏢
🤷 Activity survey signals economic growth, but also inflation. From S&P Global’s August U.S. PMI: “Companies across both manufacturing and services are reporting stronger demand conditions, but are struggling to meet sales growth, causing backlogs of work to rise at a pace not seen since the pandemic-related capacity constraints recorded in early 2022. Stock building of finished goods has also risen at a survey record pace, linked in part to worries over future supply conditions. While this upturn in demand has fueled a surge in hiring, it has also bolstered firms’ pricing power. Companies have consequently passed tariff-related cost increases through to customers in increasing numbers, indicating that inflation pressures are now at their highest for three years.”

Keep in mind that during times of perceived stress, soft survey data tends to be more exaggerated than actual hard data.
For more on this, read: What businesses do > what businesses say 🙊
🇺🇸 Most U.S. states are still growing. From the Philly Fed’s July State Coincident Indexes report: “Over the past three months, the indexes increased in 41 states, decreased in eight states, and remained stable in one, for a three-month diffusion index of 66. Additionally, in the past month, the indexes increased in 38 states, decreased in five states, and remained stable in seven, for a one-month diffusion index of 66.”

📈 Near-term GDP growth estimates are tracking positively. The Atlanta Fed’s GDPNow model sees real GDP growth rising at a 2.3% rate in Q3.

For more on GDP and the economy, read: 9 once-hot economic charts that cooled 📉 and We're at an economic tipping point ⚖️
Putting it all together 📋
🚨 The Trump administration’s pursuit of tariffs threatens to disrupt global trade, with significant implications for the U.S. economy, corporate earnings, and the stock market. Until we get more clarity, here’s where things stand:
Earnings look bullish: The long-term outlook for the stock market remains favorable, bolstered by expectations for years of earnings growth. And earnings are the most important driver of stock prices.
Demand is positive: Demand for goods and services remains positive, supported by healthy consumer and business balance sheets. Job creation, although cooling, also remains positive, and the Federal Reserve — having resolved the inflation crisis — shifted its focus toward supporting the labor market.
But growth is cooling: While the economy remains healthy, growth has normalized from much hotter levels earlier in the cycle. The economy is less “coiled” these days as major tailwinds like excess job openings and core capex orders have faded. It has become harder to argue that growth is destiny.
Actions speak louder than words: We are in an odd period, given that the hard economic data decoupled from the soft sentiment-oriented data. Consumer and business sentiment has been relatively poor, even as tangible consumer and business activity continues to grow and trend at record levels. From an investor’s perspective, what matters is that the hard economic data continues to hold up.
Stocks are not the economy: There’s a case to be made that the U.S. stock market could outperform the U.S. economy in the near term, thanks largely to positive operating leverage. Since the pandemic, companies have aggressively adjusted their cost structures. This came with strategic layoffs and investment in new equipment, including hardware powered by AI. These moves are resulting in positive operating leverage, which means a modest amount of sales growth — in the cooling economy — is translating to robust earnings growth.
Mind the ever-present risks: Of course, we should not get complacent. There will always be risks to worry about, such as U.S. political uncertainty, geopolitical turmoil, energy price volatility, and cyber attacks. There are also the dreaded unknowns. Any of these risks can flare up and spark short-term volatility in the markets.
Investing is never a smooth ride: There’s also the harsh reality that economic recessions and bear markets are developments that all long-term investors should expect as they build wealth in the markets. Always keep your stock market seat belts fastened.
Think long-term: For now, there’s no reason to believe there’ll be a challenge that the economy and the markets won’t be able to overcome over time. The long game remains undefeated, and it’s a streak that long-term investors can expect to continue.
For more on how the macro story is evolving, check out the previous review of the macro crosscurrents. »
Key insights about the stock market 📈
Here’s a roundup of some of TKer’s most talked-about paid and free newsletters about the stock market. All of the headlines are hyperlinked to the archived pieces.
10 truths about the stock market 📈
The stock market can be an intimidating place: It’s real money on the line, there’s an overwhelming amount of information, and people have lost fortunes in it very quickly. But it’s also a place where thoughtful investors have long accumulated a lot of wealth. The primary difference between those two outlooks is related to misconceptions about the stock market that can lead people to make poor investment decisions.
The makeup of the S&P 500 is constantly changing 🔀
Passive investing is a concept usually associated with buying and holding a fund that tracks an index. And no passive investment strategy has attracted as much attention as buying an S&P 500 index fund. However, the S&P 500 — an index of 500 of the largest U.S. companies — is anything but a static set of 500 stocks.

The key driver of stock prices: Earnings💰
For investors, anything you can ever learn about a company matters only if it also tells you something about earnings. That’s because long-term moves in a stock can ultimately be explained by the underlying company’s earnings, expectations for earnings, and uncertainty about those expectations for earnings. Over time, the relationship between stock prices and earnings has a very tight statistical relationship.

Stomach-churning stock market sell-offs are normal🎢
Investors should always be mentally prepared for some big sell-offs in the stock market. It’s part of the deal when you invest in an asset class that is sensitive to the constant flow of good and bad news. Since 1950, the S&P 500 has seen an average annual max drawdown (i.e., the biggest intra-year sell-off) of 14%.
How the stock market performed around recessions 📉📈
Every recession in history was different. And the range of stock performance around them varied greatly. There are two things worth noting. First, recessions have always been accompanied by a significant drawdown in stock prices. Second, the stock market bottomed and inflected upward long before recessions ended.

In the stock market, time pays ⏳
Since 1928, the S&P 500 generated a positive total return more than 89% of the time over all five-year periods. Those are pretty good odds. When you extend the timeframe to 20 years, you’ll see that there’s never been a period where the S&P 500 didn’t generate a positive return.

What a strong dollar means for stocks 👑
While a strong dollar may be great news for Americans vacationing abroad and U.S. businesses importing goods from overseas, it’s a headwind for multinational U.S.-based corporations doing business in non-U.S. markets.

Economy ≠ Stock Market 🤷♂️
The stock market sorta reflects the economy. But also, not really. The S&P 500 is more about the manufacture and sale of goods. U.S. GDP is more about providing services.

Stanley Druckenmiller's No. 1 piece of advice for novice investors 🧐
…you don't want to buy them when earnings are great, because what are they doing when their earnings are great? They go out and expand capacity. Three or four years later, there's overcapacity and they're losing money. What about when they're losing money? Well, then they’ve stopped building capacity. So three or four years later, capacity will have shrunk and their profit margins will be way up. So, you always have to sort of imagine the world the way it's going to be in 18 to 24 months as opposed to now. If you buy it now, you're buying into every single fad every single moment. Whereas if you envision the future, you're trying to imagine how that might be reflected differently in security prices.
Peter Lynch made a remarkably prescient market observation in 1994 🎯
Some event will come out of left field, and the market will go down, or the market will go up. Volatility will occur. Markets will continue to have these ups and downs. … Basic corporate profits have grown about 8% a year historically. So, corporate profits double about every nine years. The stock market ought to double about every nine years… The next 500 points, the next 600 points — I don’t know which way they’ll go… They’ll double again in eight or nine years after that. Because profits go up 8% a year, and stocks will follow. That's all there is to it.
Warren Buffett's 'fourth law of motion' 📉
Long ago, Sir Isaac Newton gave us three laws of motion, which were the work of genius. But Sir Isaac’s talents didn’t extend to investing: He lost a bundle in the South Sea Bubble, explaining later, “I can calculate the movement of the stars, but not the madness of men.” If he had not been traumatized by this loss, Sir Isaac might well have gone on to discover the Fourth Law of Motion: For investors as a whole, returns decrease as motion increases.
Most pros can’t beat the market 🥊
According to S&P Dow Jones Indices (SPDJI), 65% of U.S. large-cap equity fund managers underperformed the S&P 500 in 2024. As you stretch the time horizon, the numbers get even more dismal. Over a three-year period, 85% underperformed. Over a 10-year period, 90% underperformed. And over a 20-year period, 92% underperformed. This 2023 performance follows 14 consecutive years in which the majority of fund managers in this category have lagged the index.

Proof that 'past performance is no guarantee of future results' 📊
Even if you are a fund manager who generated industry-leading returns in one year, history says it’s an almost insurmountable task to stay on top consistently in subsequent years. According to S&P Dow Jones Indices, just 4.21% of all U.S. equity funds in the top half of performance during the first year were able to remain in the top during the four subsequent years. Only 2.42% of U.S. large-cap funds remained in the top half
SPDJI’s report also considered fund performance relative to their benchmarks over the past three years. Of 738 U.S. large-cap equity funds tracked by SPDJI, 50.68% beat the S&P 500 in 2022. Just 5.08% beat the S&P in the two years ending 2023. And only 2.14% beat the index in the three years ending in 2024.

The odds are stacked against stock pickers 🎲
Picking stocks in an attempt to beat market averages is an incredibly challenging and sometimes money-losing effort. Most professional stock pickers aren’t able to do this consistently. One of the reasons for this is that most stocks don’t deliver above-average returns. According to S&P Dow Jones Indices, only 24% of the stocks in the S&P 500 outperformed the average stock’s return from 2000 to 2022. Over this period, the average return on an S&P 500 stock was 390%, while the median stock rose by just 93%.
