TKer by Sam Ro

Share this post
This chart of gasoline prices is really something ⛽️
www.tker.co

This chart of gasoline prices is really something ⛽️

Inflation measures are improving, but is it too early to declare victory? ⚠️

Sam Ro, CFA
Aug 12, 2022
13
1
Share this post
This chart of gasoline prices is really something ⛽️
www.tker.co
(Source: GasBuddy)

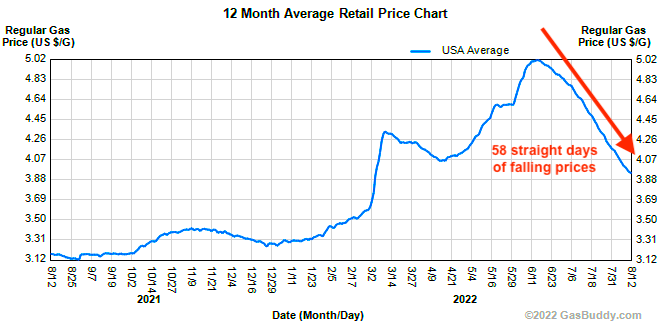
The national average price of gasoline has declined for 58 consecutive days, GasBuddy’s Patrick De Haan reports. It’s gone from a high of $5.02 on June 14 to $3.95 as of Friday.

This of course is welcome news to drivers, who seem to be acknowledging in various sentiment surveys a change in their expectations for inflation over the coming months and years.

Keep reading with a 7-day free trial

Subscribe to TKer by Sam Ro to keep reading this post and get 7 days of free access to the full post archives.

Already a paid subscriber? Sign in
Previous
Next
© 2023 Samuel Ro
Privacy ∙ Terms ∙ Collection notice
Start WritingGet the app
Substack is the home for great writing