📈 TKer by Sam Ro

📈 TKer by Sam Ro

Share this post

📈 TKer by Sam Ro
📈 TKer by Sam Ro
A bunch of charts showing how supply chains have improved⛓
Copy link
Facebook
Email
Notes
More

A bunch of charts showing how supply chains have improved⛓

But is supply improving or demand deteriorating? ⚖️

Sam Ro, CFA's avatar
Sam Ro, CFA
Aug 04, 2022
∙ Paid
13

Share this post

📈 TKer by Sam Ro
📈 TKer by Sam Ro
A bunch of charts showing how supply chains have improved⛓
Copy link
Facebook
Email
Notes
More
Share
(Source: Getty)

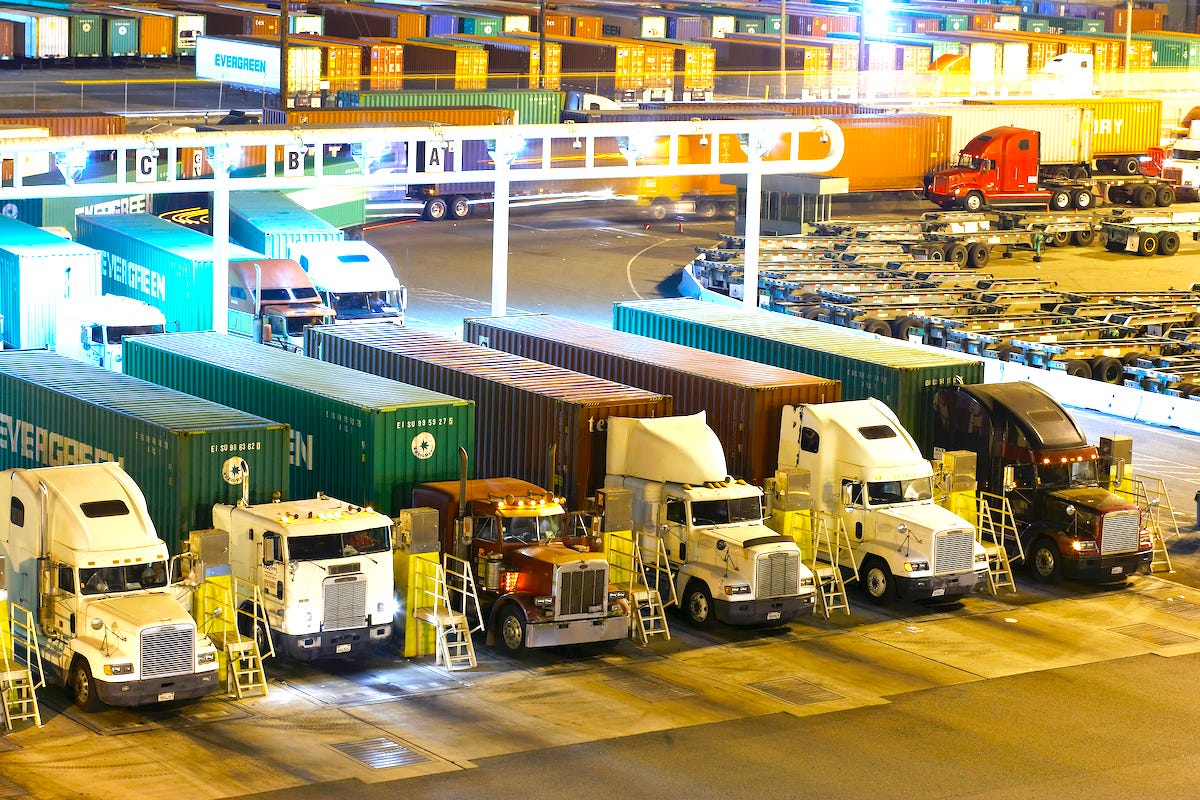
Supply chains have improved considerably in recent months.

The New York Fed’s Global Supply Chain Pressure Index1 — a composite of various supply chain indicators — fell in July to its lowest level since February 2021, meaning supply chains are easing.

The Global Supply Chain Pressure Index. (Source: NY Fed)

One of the most intuitive measures of supply chain health is supplier delivery times, which hit their longest points on record last fall.

Keep reading with a 7-day free trial

Subscribe to 📈 TKer by Sam Ro to keep reading this post and get 7 days of free access to the full post archives.

Already a paid subscriber? Sign in
© 2025 Samuel Ro
Privacy ∙ Terms ∙ Collection notice
Start writingGet the app
Substack is the home for great culture

Share

Copy link
Facebook
Email
Notes
More