TKer by Sam Ro

Share this post
Charts to watch in 2022 📈
www.tker.co

Charts to watch in 2022 📈

Also, here comes the Santa Claus rally 🎅🏻

Sam Ro, CFA
Dec 26, 2021
Comment
Share
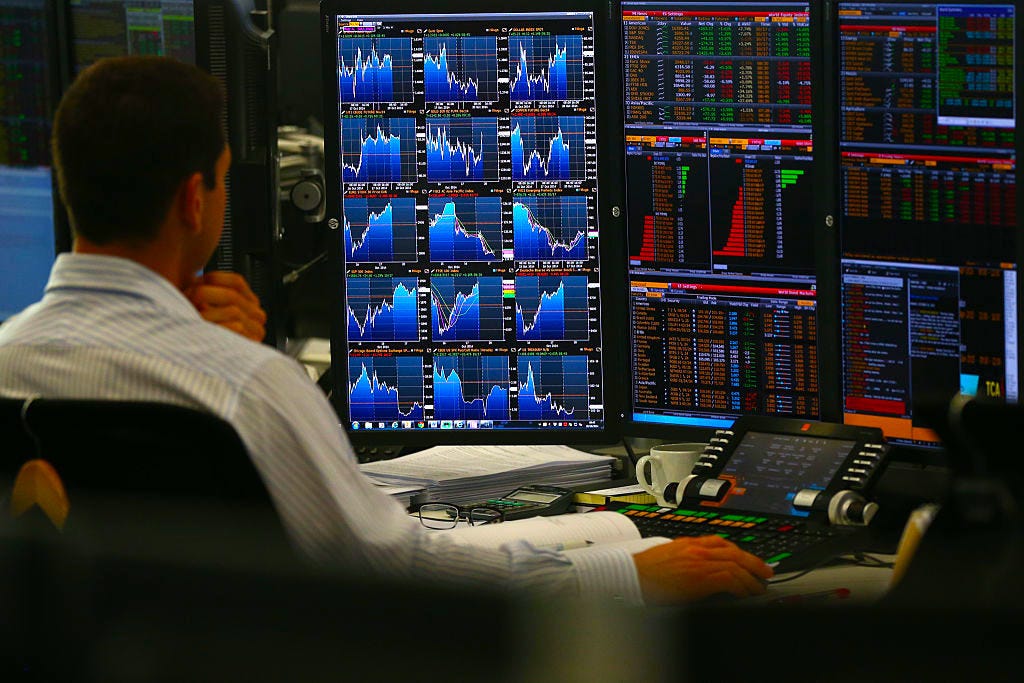
Keep an eye on the charts. (Source: Getty images)

I compiled a list of 12 charts to watch in 2022 for my friends over at Yahoo Finance. You can thumb through them here. They include economic indicators and market metrics we’ve been discussing here at TKer over the last two months.

Here are two notable ones from the piece:

2: Job openings: According to the BLS’s Job Openings and Labor Turnover Survey, there were a whopping 11.03 million job openings in the U.S. as of October. This means employers have the capacity to send employment in the U.S. well above record levels. Importantly, this is an encouraging sign for future growth as 1) employers wouldn’t list a job if they didn’t have the need, and 2) the aggregate capacity to spend will go up as people fill these jobs, which means increased levels of economic activity.

Will job openings get filled? (Source: FRED)

…

7: Inventories: Inventory levels spiked briefly during the onset of the pandemic when spending collapsed. Since then, the recovery in demand collided with gummed up supply chains, leaving business inventory levels depressed. This has hindered sales and contributed to price inflation. Businesses everywhere have explicitly laid out plans to replenish their stockrooms, a move that has at least one economist calling it “the greatest story of the 2022 outlook yet untold.” 

What will inventory restocking mean for growth and prices. (Source: FRED)

I like both of these metrics because they suggest there’s a lot of demand yet to be recognized in the economy.

Head to Yahoo Finance for the full feature, which includes my conversation with anchors Julie Hyman and Brian Sozzi.

(Source: YouTube / Yahoo Finance)

-

From TKer over the past week:

  • Stock buybacks are at record highs. At least that’s what all the news outlets are telling you. But a closer look at the number reveals that buyback levels are actually relatively low. (Link)

  • Most stocks in the S&P 500 underperform the index. It’s not easy finding market-beating stocks. (Link)

Share


Rearview 🪞

📈 Stock market record: The S&P 500 climbed 2.3% over the holiday-shortened week, closing at a record-high 4,725.79. It’s now up 25.8% since the beginning of the year.

John Stoltzfus, chief investment strategist at Oppenheimer Asset Management, characterized the last month’s worth of volatility pretty well in a note to clients on Monday:

We suggest that investors not let near-term uncertainty obfuscate progress being made as the central bank adjusts monetary policy to meet higher than expected inflation and as the US and global economy navigate current challenges to re-openings posed by COVID-19 variants and supply chain disruptions.

In our view, the noise stemming from negative projections coming from some traders, skeptics, bears and fear-mongers of late should not obscure the signals of progress that have been made societally and economically since the pandemic struck globally in March 2020 through to the current day.

Central banks, businesses, labor, consumers, and even politicians (gasp) have shown up and met the challenges in their path thus far with science, technology, monetary policy, fiscal policy, and a strong desire to get to—if not to the ‘new normal’ we had come to know after the Great Financial Crisis—what we’ll call ‘the next new normal’ likely to follow the pandemic of COVID-19 and its assortment of nasty variants.

Beautiful stuff. For more on the recent bout of market volatility, read this, this, and this.

The S&P 500 is up. (Source: Yahoo Finance)

🎈 Inflation is high, as expected: The Federal Reserve’s preferred inflation metric — the core PCE price index — was up 4.7% year-over-year in November, which is well above the central bank’s long term average target of 2%. But as I noted last week, the Fed has already acknowledged this elevated level of inflation and is acting accordingly.

Inflation is up. (Source: FRED, BEA)

🎉 Sentiment improves as inflation worries begin fade: The Conference Board’s Consumer Confidence Index climbed to 115.8 in December from 111.9 in November. “The proportion of consumers planning to purchase homes, automobiles, major appliances, and vacations over the next six months all increased,“ The Conference Board’s Lynn Franco said. “Meanwhile, concerns about inflation declined after hitting a 13-year high last month as did concerns about COVID-19, despite reports of continued price increases and the emergence of the Omicron variant.”

Consumer confidence is up. (Source: The Conference Board)

🏘 Homes are selling: Sales for previously-owned homes climbed 1.9% month-over-month in November to an annual rate of 6.46 million units, according to the National Association of Realtors. The median sales price for one of these homes was was $353,900, up 13.9% from November 2020.

Home prices are up. (Source: NAR)

👟 Nike’s supply chain improves: Nike reported 1% growth in quarterly sales as strength in North America offset weakness overseas. According to CNBC, “Chief Financial Officer Matt Friend told analysts that all factories in Vietnam are up and running, and production is back to about 80% of pre-closure levels. Nike is increasingly confident that supply levels globally will normalize heading into fiscal 2023, said Friend.“

Up the road 🎅🏻

It’s not great to overthink what may or may not happen in the stock market over very short periods of time. That said, if you follow the stock market, then you’ve probably heard about the Santa Claus Rally.

Coined in 1972 by Yale Hirsch, founder of the Stock Trader’s Almanac, the Santa Claus Rally describes what happens over the last five trading days of the year and the first two of the next.

The historical record is impressive.

“Well, there isn’t a single seven-day combo out of the full year that is more likely to be higher than the 78.9% of the time higher we’ve seen previously during the Santa Claus Rally,” LPL Financial analysts observed in a blogpost on Wednesday. “Additionally, these seven days are up an average of 1.33%, which is the third-best seven-day combo of the year.”

(Source: LPL Financial)

Historically, Santa Claus Rallies have been followed by positive Januarys. And when Santa didn’t show up, well…

“Going back to the mid-1990s, there have been only six times Santa failed to show in December,” LPL analysts wrote. “January was lower five of those six times, and the full year had a solid gain only once (in 2016, but a mini-bear market early in the year).”

That said, history is no guarantee of the future.

The Santa Claus Rally period begins on Monday.

(Source: Getty Images)
CommentComment
ShareShare

Create your profile

0 subscriptions will be displayed on your profile (edit)

Skip for now

Only paid subscribers can comment on this post

Already a paid subscriber? Sign in

Check your email

For your security, we need to re-authenticate you.

Click the link we sent to , or click here to sign in.

TopNewCommunity

No posts

Ready for more?

© 2022 Samuel Ro
Privacy ∙ Terms ∙ Collection notice
Publish on Substack Get the app
Substack is the home for great writing