There's more upside than downside for long-term investors 📈
Plus a review of the macro crosscurrents 🔀
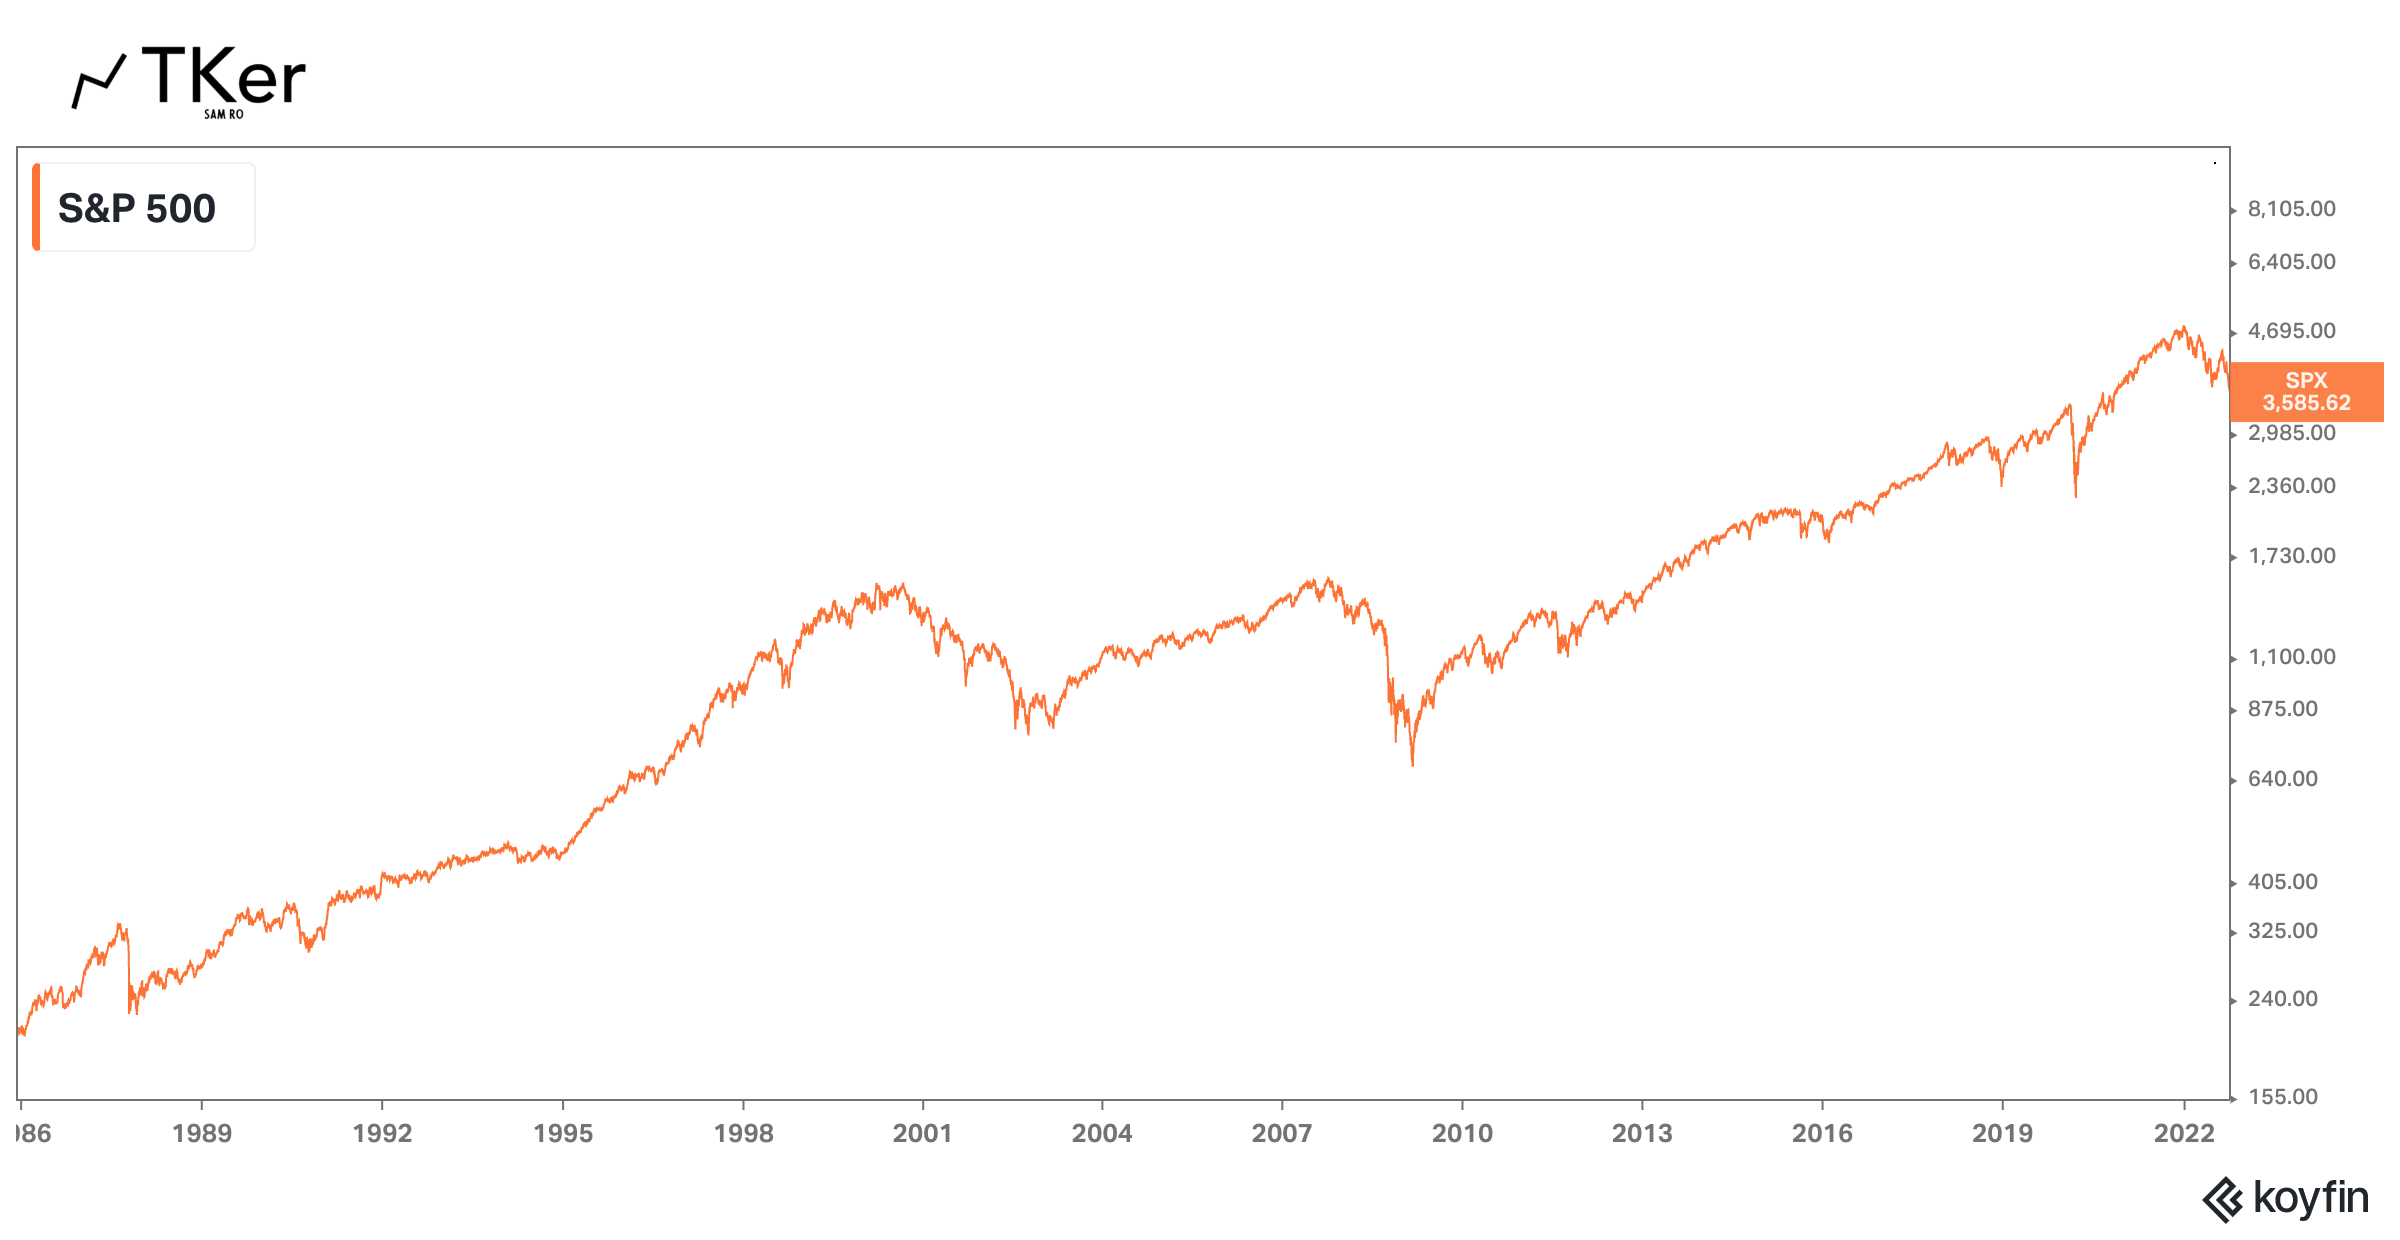
Last week, stocks tumbled to their lowest level since November 2020. The S&P 500 fell 2.9% to close the week at 3,585.62. The index is now down 25.2% from its January 3 closing high of 4,796.56.
There were some unnerving developments in the world in recent days.
The U.K. government unexpectedly announced tax cuts that sent the British pound tumbling and drew criticism from the IMF.
The Nord Stream gas pipeline was damaged, putting Europe’s energy security at greater risk.
Russia announced the illegal annexation of regions in Ukraine.
Corporate America — according to Apple, Nike, Micron, and CarMax — is not selling as much stuff as planned.
Federal Reserve officials, meanwhile, continue to reiterate the central bank’s hawkish stance despite falling stock prices and the rising risk of a recession.
It’s unclear how all of these events will unfold. And there’s no telling what other news may emerge that could destabilize world financial markets.
We do, however, know there’s a long history of events that rocked the markets and shocked the economy. And we also know that the markets and the economy eventually emerged stronger. Read more here, here, and here.
There’s lots to learn from stock market history. One thing is for sure: If you can commit the time, you don’t want to miss the rally.
The market always comes back stronger: The chart below comes from eToro’s Callie Cox. It shows the percentage losses in the S&P 500 during bear markets since 1956, and the percentage gains in the bull markets that followed.

It’s a reminder of TKer Stock Market Truth No. 4: Stocks offer asymmetric upside. In other words, while you can only lose as much as you put in, you can earn multiples of what you put in on the upside.
The first two years of recoveries are huge: This table comes from Carson Group’s Ryan Detrick. In year one of a market recovery, the S&P 500 has returned a whopping 30% on average. In year two, the S&P 500 adds another 37% on average.

The good days happen near bad days: From Vanguard’s Greg Davis: “Successfully timing the stock market is near impossible, partly because the best trading days tend to cluster around the worst ones. And missing just a few of those rally days has a surprisingly outsized impact. Looking at market data going back much further, to 1928, being out of the stock market for just the best 30 trading days would have resulted in half the return over that period.“

For more on how the best days often follow the worst days, read this.
Stocks can rally as unemployment climbs: The chart below comes from JPMorgan Asset Management’s Q4 Guide to the Markets. It shows how the S&P 500 (green line) and the unemployment rate (purple line) moved around the last nine recessions (shaded area).

As you can see, there are many instance where stocks will rally as the unemployment rate climbs for months. This is notable and timely as we prepare for the U.S. labor market to cool. It’s also a reminder that stocks are a discounting mechanism, pricing in what’s expected to happen and not what’s currently happening.
None of the above stats will tell you much about where the market will be in the next few days, weeks, or months. We could be at the bottom. Or we could go much lower.
But for long-term investors, time in the market matters more than timing the market.
“It pays to remain invested and balanced precisely when it is most difficult to do so,” Davis noted.
-
More from TKer:
This big selloff is what stock market investing is all about 📉🤮
Are 'gravity-defying' profit margins finally coming to an end? 💸
Reviewing the macro crosscurrents 🔀
There were a few notable data points from last week to consider:
🎈 Inflation is still high. The core PCE price index — the Federal Reserve’s preferred measure of inflation — was up 4.9% in August from a year ago. This is down from the 4.8% rate in June and the 5.4% peak rate in February, but it’s well above the Fed’s 2% target rate.

💪 Businesses invest in themselves. Orders for nondefense capital goods excluding aircraft — a.k.a. core capex or business investment — climbed 1.3% to a record $75.6 billion in August. While these nominal figures are not adjusted for inflation, they nevertheless reflect resilience among U.S. businesses. It’s why any recession we may face is likely to be a mild one.
From Oxford Economics’ Oren Klatchkin: “Right now manufacturing carries enough momentum to withstand stress from downward pressures, but the confluence of highly elevated inflation, higher interest rates, weakening demand and downbeat sentiment will cause durable goods activity to struggle next year. On an encouraging note, softening activity will lead to a better balance between supply and demand and reduce stress in supply chains.“

🛍 Consumers are still spending. Personal consumption expenditures rose 0.4% in August to an annualized rate of $17.47 trillion. Adjusted for inflation, real spending was up 0.1%.

💵 Consumers tap into excess savings, which are still high. Excess savings — the extra cash consumers have piled up since February 2020, thanks to a combination of government financial support and limited spending options during the pandemic — have come down from their highs as consumer continue to spend amid high inflation. That said, consumers still have an extra $1.3 trillion in spending power they didn’t have before the pandemic. Though, this cash is also keeping inflationary demand high.
🛍 Sentiment improves. From The Conference Board’s Lynn Franco: “Consumer confidence increased in August after falling for three straight months. The Present Situation Index recorded a gain for the first time since March. The Expectations Index likewise improved from July’s 9-year low, but remains below a reading of 80, suggesting recession risks continue. Concerns about inflation continued their retreat but remained elevated. Meanwhile, purchasing intentions increased after a July pullback, and vacation intentions reached an 8-month high. Looking ahead, August’s improvement in confidence may help support spending, but inflation and additional rate hikes still pose risks to economic growth in the short term.“
💼 The labor market is holding up. Even as the economy cools and hiring slows, employers seem to be holding on tight to their employees. Initial claims for unemployment insurance fell to 193,000 for the week ending September 24, down from 209,000 the week prior. While the number is up from its six-decade low of 166,000 in March, it remains near levels seen during periods of economic expansion.

👍 Unemployment falls in most metros. From the BLS: “Unemployment rates were lower in August than a year earlier in 384 of the 389 metropolitan areas and higher in 5 areas… A total of 209 areas had August jobless rates below the U.S. rate of 3.8%, 161 areas had rates above it, and 19 areas had rates equal to that of the nation.”

🏘 Home prices decline. According to the S&P CoreLogic Case-Shiller index, home prices fell 0.2% month-over-month in July, the first decline since February 2012. From S&P DJI’s Craig Lazzara: “Although U.S. housing prices remain substantially above their year-ago levels, July’s report reflects a forceful deceleration… As the Federal Reserve continues to move interest rates upward, mortgage financing has become more expensive, a process that continues to this day. Given the prospects for a more challenging macroeconomic environment, home prices may well continue to decelerate.“
📈 Mortgage rates jump. According to Freddie Mac, the average 30-year fixed-rate mortgage rose to 6.7%, the highest level since July 2007.

📉 Mortgage applications fall. From MBA’s Joel Kan: “Applications for both purchase and refinances declined last week as mortgage rates continued to increase to multi-year highs following more aggressive policy measures from the Federal Reserve to bring down inflation. Additionally, ongoing uncertainty about the impact of the Fed’s reduction of its MBS and Treasury holdings is adding to the volatility in mortgage rates.”

🏰 Homes are bigger and fewer are living in them. From the NYTimes: “Nationwide, the small detached house has all but vanished from new construction. Only about 8% of new single-family homes today are 1,400 square feet or less. In the 1940s, according to CoreLogic, nearly 70 percent of new houses were that small.“

📉 Rents are down. From Chris Salviati of Apartment List: “Our national index *fell* by 0.2% MoM in September, the first monthly decline since last December.“

🔨 Building material supply chains have improved. From John Burns of John Burns Real Estate Consulting: “Some good news. Not one building material dealer told us that the supply chain got worse in August.“

Putting it all together 🤔
Despite the Fed’s aggressive efforts to cool inflation by slowing the economy, demand is not falling off a cliff.
The labor market remains very strong, with layoff activity near record lows. And so consumer spending remains resilient, bolstered by a mountain of excess savings. Meanwhile, business spending is strong. These trends are preventing any downturn from becoming an economic calamity.
At the same time, while shelter prices are showing signs of cooling, aggregate measures of inflation remain very high.
So prepare for things to cool further given that the Fed is clearly resolute in its fight to get inflation under control. Recession risks will continue to intensify and analysts will continue trimming their forecasts for earnings. For now, all of this makes for a conundrum for the stock market and the economy until we get “compelling evidence” that inflation is indeed under control.
For more, check out last week’s TKer macro crosscurrents »
Best of TKer 📈
Here’s a roundup of some of TKer’s most talked-about paid and free newsletters. All of the headlines are hyperlinked to the archived pieces.
Why the recession we may or may not be heading for won't be that bad 💪
While the economy may not be in a recession now, it’s certainly slowing and is at risk of going into a recession. However, not every recession has to be an outright economic debacle like the global financial crisis or the Great Depression. Yes, unemployment would likely rise during the next recession, which would be unquestionably painful for those affected. But the losses could be limited and the duration of the economic contraction could be relatively short.
You can make any piece of data look bad if you try 🔄
There’s more than one way to frame a piece of economic or financial market data. It might be better than expected relative to economists’ expectations, but it could also be worse than expected relative to traders’ expectations. That same stat could be down on a month over month basis and also up on a year over year basis. It may be high relative to the 10-year average but low relative to the 5-year average. It may look bad on an absolute basis but it may look good relative to what may be the normal course of business. With that in mind, below are nine unsettling — albeit accurate — market observations that miss the point when you take a look at the big picture.
Consumers have an extra $2.5 trillion. But in some ways, it's an economic curse.💰
Let’s talk about excess savings, the roughly $2.5 trillion financial war chest that represents a massive tailwind for the economy. This has generally been good news, especially for investors in companies that have successfully passed higher costs onto customers in the form of higher prices. However, these savings are also exacerbating two of the biggest challenges in the economy.
The market beatings will continue until inflation improves 🥊
While the stock market is likely to generate healthy returns in the long run, there’s good reason for investors to manage expectations in the short run as the Federal Reserve gets increasingly aggressive with monetary policy.
Your guide to 'good news is bad news' and 'bad news is good news' 🙃
The Fed is actively trying to slow the economy — even if it means “some pain” for businesses and consumers — because it believes that is the prescription for getting inflation under control. In this world, good news about the economy is potentially bad news if it’s exacerbating the dislocation between supply and demand. Let’s review a few hypothetical headlines and examine why good news might be bad news — and vice versa.
The complicated mess of the markets and economy, explained 🧩
Economic growth has since been awesome, powered by tons of job growth. GDP, personal consumption, and home prices roared to record levels as the unemployment rate tumbled. One problem: Inflation. Why? Supply hasn’t been able to keep up with booming demand, a dynamic that’s been fanning the flames of inflation.
700+ reasons why S&P 500 index investing isn't very 'passive'💡
Passive investing is a concept usually associated with buying and holding a fund that tracks an index. And no passive investment strategy has attracted as much attention as buying an S&P 500 index fund. However, the S&P 500 — an index of 500 of the largest U.S. companies — is anything but a static set of 500 stocks. From January 1995 through April 2022, 728 tickers have been added to the S&P 500, while 724 have been removed.