Some stock market charts to consider as we look forward πππ
Plus a charted review of the macro crosscurrents π
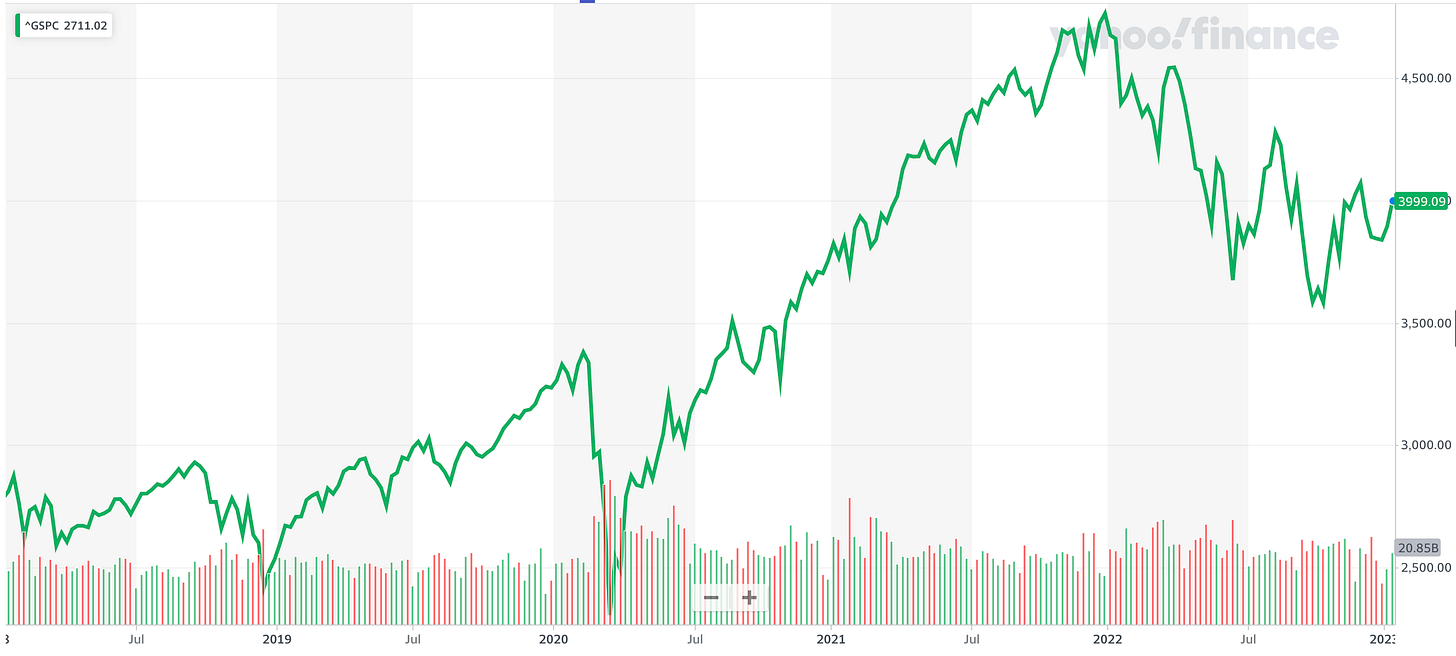
Stocks rallied again, with the S&P 500 climbing 2.7% last week. The index is now up 11.8% from its October 12 closing low of 3,577.03 and down 16.6% from its January 3, 2022 closing high of 4,796.56.
The past two weeks have come with loads of new data, and a lot of analysts returning from break published tons of fresh research.
Here are a few charts about the market that stood out:
Financial obligations have been manageable
βTo date, higher interest rates have not negatively impacted margins,β Jonathan Golub, chief U.S. equity strategist at Credit Suisse, wrote in a January 4 note to clients.
To illustrate this, Golub share this chart of S&P 500 interest expenses as percentage of revenue.
For more on the implications of higher interest rates, read βThere's more to the story than 'high interest rates are bad for stocks' π€¨,β βBusiness finances look great π°,β and βWhy repaying $500 can be harder than repaying $1,000 π€β
Companies are investing in their business
βDespite macro uncertainty, capex spending has remained strong, accelerating to +24% YoY in 3Q, driven by Energy and Communication Services,β Savita Subramanian, head of U.S. equity strategy at BofA, observed on Friday.
BofA expects the U.S. economy to go into recession this year.
βAlthough capex is typically pro-cyclical, we see several reasons that capex will be more resilient during this recession than in the past, including persistent supply challenges, the need to spend on automation amid wage inflation/tight labor market, reshoring, underinvestment by corporates for decades, and the energy transition.β
For more on capex spending, read β9 reasons to be optimistic about the economy and markets πͺβ and βThree massive economic tailwinds I can't stop thinking about πππ.β
Watch for stocks to decouple during earnings season
βWe look for price dispersion to rise over the next ~6 weeks as it has done throughout prior earnings seasons,β Mike Wilson, chief U.S. equity strategist at Morgan Stanley, wrote on Monday.
Dispersion reflects the degree to which individual stocks move together.
While Subramanian believes capex spending will hold up, Wilson argues that companies cutting back will be see their stock prices outperform.
βIn our view, a key driver of this pick up in dispersion will be the widening relative performance gap between those companies that are operationally efficient in this challenging macro environment and those that are not,β he said. βIn this sense, we think companies that minimize capex, inventory and labor investment and maximize cash flow will be rewarded on a relative basis.β
Analysts expect earnings growth in 2023 and 2024
According to FactSet, analysts are expecting S&P 500 earnings per share (EPS) to rise to $229.53 in 2023 and $252.74 in 2024.

For more bullish metrics, read β9 reasons to be optimistic about the economy and markets πͺ.β
However, those expectations have been coming down
From FactSet:

Thereβs no shortage of strategists expecting these numbers to be revised lower. For more, read βOne of the most frequently cited risks to stocks in 2023 is 'overstated' π.β
Earnings growth usually beats estimates
From FactSet: "...the actual earnings growth rate has exceeded the estimated earnings growth rate at the end of the quarter in 38 of the past 40 quarters for the S&P 500. The only exceptions were Q1 2020 and last quarter (Q3 2022)."

For more on this, read β'Better-than-expected' has lost its meaning π€·π»ββοΈβ and βThe truth about analysts' deteriorating expectations π.β
Valuations bottom before expected earnings
βIn prior bear markets, equities have troughed ~1m before the ISM bottoms, but 1-2 months after financial conditions peak,β Keith Parker, head of U.S. equity strategy at UBS, wrote in a January 4 note. βThe market bottom coincides with the P/E bottom in almost all instances, with a rise in the P/E typically following a fall in corporate bond yields.β
The chart below shows the P/E bottom also precedes the bottom in forward earnings estimates.
For more on P/E ratios, read βUse valuation metrics like the P/E ratio with caution β οΈ.β For more on stocks bottoming, read βStocks usually bottom before everything else.β
In the long run, earnings go up
Deutsche Bankβs Binky Chadha expects Q4 earnings of $53.80 per share for the S&P 500. This would bring EPS closer to its long-run trend, which is up and to the right.
For more on long-term earnings, read βExpectations for S&P 500 earnings are slipping πβ and βLegendary stock picker Peter Lynch made a remarkably prescient market observation in 1994 π―.β
Great years follow horrible years
βIn the past 90 years, the S&P 500 has only posted a more severe loss than its 19.4% annual decline in 2022 on four occasions - 1937, 1974, 2002, and 2008,β Brian Belski, chief investment strategist at BMO Capital Markets, observed on Thursday. βIn the subsequent calendar years, the index logged >20% gains each time with an average price return of 26.5% as highlighted in Exhibit 8.β
For more on short-term patterns in the stock market, read β2022 was an unusual year for the stock market πβ and βDon't expect average returns in the stock market this year πβ
Not many ETFs beat the S&P 500
From S&P Dow Jones Indices: βOn Jan. 29, 2023, the worldβs longest-surviving exchange-traded fund β initially known as the Standard & Poorβs Depository Receipt or by the acronym SPDR (the βSpiderβ) β will celebrate 30 years since it began tradingβ¦ Investing in an index tracker was seen (by some) as an admission of defeat back in early 1993. At best, an index fund was βsettling for average.β But, as it turns out, a portfolio approximately replicating the S&P 500βs return would have been emphatically above average since then."

For more on this, read βMost pros can't beat the market π₯β
Most consumers expect stocks to fall
From the NY Fedβs Survey of Consumer Expectations: βThe mean perceived probability that U.S. stock prices will be higher 12 months from now decreased by 0.8 percentage point to 34.9%.β

For more on this, read βMost of us are terrible stock market forecasters π€¦ββοΈ.β
BONUS: Execs are talking sh*t on earnings calls
From the FTβs Robin Wigglesworth: βUsing AlphaSense/Sentieoβs transcription search function, we can see that the βpolycrisisβ of runaway inflation, pandemics, interest rate increases, supply chain snafus and wars helped lift swearing on earnings calls and investor days to a new record high in 2022. Sadly, when we first looked into this last year it turned out that most of the redacted swear words were pretty plain vanilla, like βshitβ and βbullshit.ββ

Itβs a lot to process. Indeed, investing in the stock market can be complicated.
Overall, there seem to be a lot of reasons to be optimistic. And the reasons to be pessimistic arenβt particularly out of the ordinary.
For many more charts on the stock market, read β2022 was an unusual year for the stock market π.β
-
Related from TKer:
Everyoneβs talking about a near-term sell-off. A contrarian signal? π€
One of the most frequently cited risks to stocks in 2023 is 'overstated' π
Don't expect average returns in the stock market this year π
9 reasons to be optimistic about the economy and markets πͺ
Reviewing the macro crosscurrents π
There were a few notable data points from last week to consider:
π Inflation continues to cool. The consumer price index (CPI) in December was up 6.5% from a year ago, down from 7.1% in November. Adjusted for food and energy prices, core CPI was up 5.7%, down from 6.0%.

On a month-over-month basis, CPI was down 0.1% and core CPI was up 0.3%.
If you annualized the three-month trend in the monthly figures, CPI is rising at a cool 1.8% rate and core CPI is climbing at a just-above-target 3.1% rate.

For more on the implications of cooling inflation, read βThe bullish 'goldilocks' soft landing scenario that everyone wants π.β
π Consumer sentiment improves. From the University of Michiganβs December Survey of Consumers: βConsumer sentiment remained low from a historical perspective but continued lifting for the second consecutive month, rising 8% above December and reaching about 4% below a year ago. Current assessments of personal finances surged 16% to its highest reading in eight months on the basis of higher incomes and easing inflationβ¦ Year-ahead inflation expectations receded for the fourth straight month, falling to 4.0% in January from 4.4% in December. The current reading is the lowest since April 2021 but remains well above the 2.3-3.0% range seen in the two years prior to the pandemic.β

π Expectations for inflation improve. From the NY Fedβs December Survey of Consumer Expectations: βMedian one-year-ahead inflation expectations declined to 5.0%, its lowest reading since July 2021, according to the December Survey of Consumer Expectations. Medium-term expectations remained at 3.0%, while the five-year-ahead measure increased to 2.4%.β

π³ Consumers are taking on more debt. According to Federal Reserve data released Monday, total revolving consumer credit outstanding increased to $1.19 trillion in November. Revolving credit consists mostly of credit card loans.

π³ Credit card interest rates are up. From Axios: βThe Federal Reserve's most recent report on costs of consumer credit showed average interest rates on bank-issued credit cards touching 19.1% in the fourth quarter. That beats the previous record high β 18.9% β set in the first quarter of 1985.β

π³ Credit card delinquencies are low, but normalizing. From JPMorgan Chaseβs Q4 earnings announcement: βWe expect continued normalization in credit in 2023.β The bankβs outlook assumes a βmild recession in the central case.β For more on this, read βConsumer finances are in remarkably good shape π°β

π° Overall consumer finances are stable. From Apollo Global Managementβs Torsten Slok: ββ¦households across the income distribution continue to have a higher level of cash available than before the pandemic, and the speed with which households are running down their cash balances in recent quarters has been very slow. Combined with continued solid job growth and robust wage inflation, the bottom line is that there remains a powerful tailwind in place for US consumer spending.β
βThe U.S. economy currently remains strong with consumers still spending excess cash and businesses healthy,β Jamie Dimon, CEO of JPMorgan Chase, said on Friday. For more on this, read βConsumer finances are in remarkably good shape π°β
ποΈ Consumer spending is stable. From BofA: βAlthough upper-income (<125k) spending modestly outperformed lower-income (<50k) spending during the holidays, we see no clear signs of cracks in the latter. Lower-income HHs are still allocating a larger share of total card spending to discretionary categories than they were before the pandemic (Exhibit 7). This suggests they are not yet moving to a more precautionary stance. Lower-income HHs also do not yet appear to be facing liquidity issues, since they are allocating a smaller share of total card spending to credit cards than they did in 2019 (Exhibit 8).β For more economic indicators that are holding up, read β9 reasons to be optimistic about the economy and markets πͺ.β
πΌ Unemployment claims remain low. Initial claims for unemployment benefits fell to 205,000 during the week ending Jan. 7, down from 206,000 the week prior. While the number is up from its six-decade low of 166,000 in March, it remains near levels seen during periods of economic expansion.

π€ Many are out sick. From KPMGβs Diane Swonk: βNearly 70% more workers out sick each month than pre-pandemic average. The scars of the pandemic are adding to staffing shortages. The number of those out sick and unable to work hit 1.6 million in November; that left nearly 700,000 more people on the sidelines than in any month of the 2010s. Fatalities to date are higher than other developed economies. Many older workers had COVID and are unable to work due to long COVID. Younger retirees are now needed to care for grandchildren and elderly parents, due to acute shortage of child and long-term care workers. Those out from work due to childcare problems reached an all-time high in October as more children were sick with RSV, Flu, and COVID-19.β

πΌ Job openings are ticking lower. From labor market data firm LinkUp: ββ¦labor demand continued to decline through the end of 2022 as total active job listings dropped 4.5% in the U.S. from November to December, compared to the 6.9% decrease in listing volume from October to November, and declined across nearly all states and industries as well. Employers also created fewer listings in December, as the count of new job listings dropped 3.2% month-over-month. However, while we observed declines in both new and total listings, removed listings grew by 3.5% from November to December.β For more on this, read βHow job openings explain everything right now πβ

π Inventory levels are up. According to Census Bureau data released Tuesday, wholesale inventories climbed 1.0% to $933.1 billion in November, bringing the inventories/sales ratio to 1.35. For more, read βWe can stop calling it a supply chain crisis β.β

Putting it all together π€
Weβre getting a lot of evidence that we may get the bullish βGoldilocksβ soft landing scenario where inflation cools to manageable levels without the economy having to sink into recession.
But for now, inflation still has to come down more before the Federal Reserve is comfortable with price levels. So we should expect the central bank to continue to tighten monetary policy, which means tighter financial conditions (e.g. higher interest rates, tighter lending standards, and lower stock valuations). All of this means the market beatings are likely to continue and the risk the economy sinks into a recession will intensify.
However, we may soon hear the Fed change its tone in a more dovish way if we continue to get evidence that inflation is easing.
Itβs important to remember that while recession risks are elevated, consumers are coming from a very strong financial position. Unemployed people are getting jobs. Those with jobs are getting raises. And many still have excess savings to tap into. Indeed, strong spending data confirms this financial resilience. So itβs too early to sound the alarm from a consumption perspective.
At this point, any downturn is unlikely to turn into economic calamity given that the financial health of consumers and businesses remains very strong.
As always, long-term investors should remember that recessions and bear markets are just part of the deal when you enter the stock market with the aim of generating long-term returns. While markets have had a terrible year, the long-run outlook for stocks remains positive.
For more on how the macro story is evolving, check out the previous TKer macro crosscurrents Β»
For more on why this is an unusually unfavorable environment for the stock market, read βThe market beatings will continue until inflation improves π₯β Β»
For a closer look at where we are and how we got here, read βThe complicated mess of the markets and economy, explained π§©β Β»
TKerβs best insights about the stock market π
Hereβs a roundup of some of TKerβs most talked-about paid and free newsletters about the stock market. All of the headlines are hyperlinked to the archived pieces.
10 truths about the stock market π
The stock market can be an intimidating place: Itβs real money on the line, thereβs an overwhelming amount of information, and people have lost fortunes in it very quickly. But itβs also a place where thoughtful investors have long accumulated a lot of wealth. The primary difference between those two outlooks is related to misconceptions about the stock market that can lead people to make poor investment decisions.
Stomach-churning stock market sell-offs are normalπ’
Investors should always be mentally prepared for some big sell-offs in the stock market. Itβs part of the deal when you invest in an asset class that is sensitive to the constant flow of good and bad news. Since 1950, the S&P 500 has seen an average annual max drawdown (i.e., the biggest intra-year sell-off) of 14%.
How stocks performed when the yield curve inverted β οΈ
Thereβve been lots of talk about the βyield curve inversion,β with media outlets playing up that this bond market phenomenon may be signaling a recession. Admittedly, yield curve inversions have a pretty good track record of being followed by recessions, and recessions usually come with significant market sell-offs. But experts also caution against concluding that inverted yield curves are bulletproof leading indicators.
How the stock market performed around recessions ππ
Every recession in history was different. And the range of stock performance around them varied greatly. There are two things worth noting. First, recessions have always been accompanied by a significant drawdown in stock prices. Second, the stock market bottomed and inflected upward long before recessions ended.
In the stock market, time pays β³
Since 1928, the S&P 500 generated a positive total return more than 89% of the time over all five-year periods. Those are pretty good odds. When you extend the timeframe to 20 years, youβll see that thereβs never been a period where the S&P 500 didnβt generate a positive return.
700+ reasons why S&P 500 index investing isn't very 'passive'π‘
Passive investing is a concept usually associated with buying and holding a fund that tracks an index. And no passive investment strategy has attracted as much attention as buying an S&P 500 index fund. However, the S&P 500 β an index of 500 of the largest U.S. companies β is anything but a static set of 500 stocks. From January 1995 through April 2022, 728 tickers have been added to the S&P 500, while 724 have been removed.
The key driver of stock prices: Earningsπ°
For investors, anything you can ever learn about a company matters only if it also tells you something about earnings. Thatβs because long-term moves in a stock can ultimately be explained by the underlying companyβs earnings, expectations for earnings, and uncertainty about those expectations for earnings. Over time, the relationship between stock prices and earnings have a very tight statistical relationship.
When the Fed-sponsored market beatings could end π
At some point in the future, weβll learn a new bull market in stocks has begun. Before we can get there, the Federal Reserve will likely have to take its foot off the neck of financial markets. If history is a guide, then the market should bottom weeks or months before we get that signal from the Fed.
What a strong dollar means for stocks π
While a strong dollar may be great news for Americans vacationing abroad and U.S. businesses importing goods from overseas, itβs a headwind for multinational U.S.-based corporations doing business in non-U.S. markets.
Economy β Stock Market π€·ββοΈ
The stock market sorta reflects the economy. But also, not really. The S&P 500 is more about the manufacture and sale of goods. U.S. GDP is more about providing services.
Stanley Druckenmiller's No. 1 piece of advice for novice investors π§
β¦you don't want to buy them when earnings are great, because what are they doing when their earnings are great? They go out and expand capacity. Three or four years later, there's overcapacity and they're losing money. What about when they're losing money? Well, then theyβve stopped building capacity. So three or four years later, capacity will have shrunk and their profit margins will be way up. So, you always have to sort of imagine the world the way it's going to be in 18 to 24 months as opposed to now. If you buy it now, you're buying into every single fad every single moment. Whereas if you envision the future, you're trying to imagine how that might be reflected differently in security prices.
Peter Lynch made a remarkably prescient market observation in 1994 π―
Some event will come out of left field, and the market will go down, or the market will go up. Volatility will occur. Markets will continue to have these ups and downs. β¦ Basic corporate profits have grown about 8% a year historically. So, corporate profits double about every nine years. The stock market ought to double about every nine yearsβ¦ The next 500 points, the next 600 points β I donβt know which way theyβll goβ¦ Theyβll double again in eight or nine years after that. Because profits go up 8% a year, and stocks will follow. That's all there is to it.
Warren Buffett's 'fourth law of motion' π
Long ago, Sir Isaac Newton gave us three laws of motion, which were the work of genius. But Sir Isaacβs talents didnβt extend to investing: He lost a bundle in the South Sea Bubble, explaining later, βI can calculate the movement of the stars, but not the madness of men.β If he had not been traumatized by this loss, Sir Isaac might well have gone on to discover the Fourth Law of Motion: For investors as a whole, returns decrease as motion increases.
'Past performance is no guarantee of future results,' charted π
S&P Dow Jones Indices found that funds beat their benchmark in a given year are rarely able to continue outperforming in subsequent years. According to their research, 29% of 791 large-cap equity funds that beat the S&P 500 in 2019. Of those funds, 75% beat the benchmark again in 2020. But only 9.1%, or 21 funds, were able to extend that outperformance streak into 2021.
One stat shows how hard it is to pick market-beating stocks π²
Picking stocks in an attempt to beat market averages is an incredibly challenging and sometimes money-losing effort. In fact, most professional stock pickers arenβt able to do this on a consistent basis. One of the reasons for this is that most stocks donβt deliver above-average returns. According to S&P Dow Jones Indices, only 22% of the stocks in the S&P 500 outperformed the index itself from 2000 to 2020. Over that period, the S&P 500 gained 322%, while the median stock rose by just 63%.