TKer by Sam Ro

Share this post

The market beatings continue amid an 'unusually murky' outlook 🥊

www.tker.co

The market beatings continue amid an 'unusually murky' outlook 🥊

Plus a review of the macro crosscurrents 🔀

Sam Ro, CFA
Sep 25, 2022
14
1
Share this post

The market beatings continue amid an 'unusually murky' outlook 🥊

www.tker.co

It was a rough week in the stock market as the Federal Reserve renewed its commitment to do whatever it takes to bring down inflation, even if it means pain in the economy.

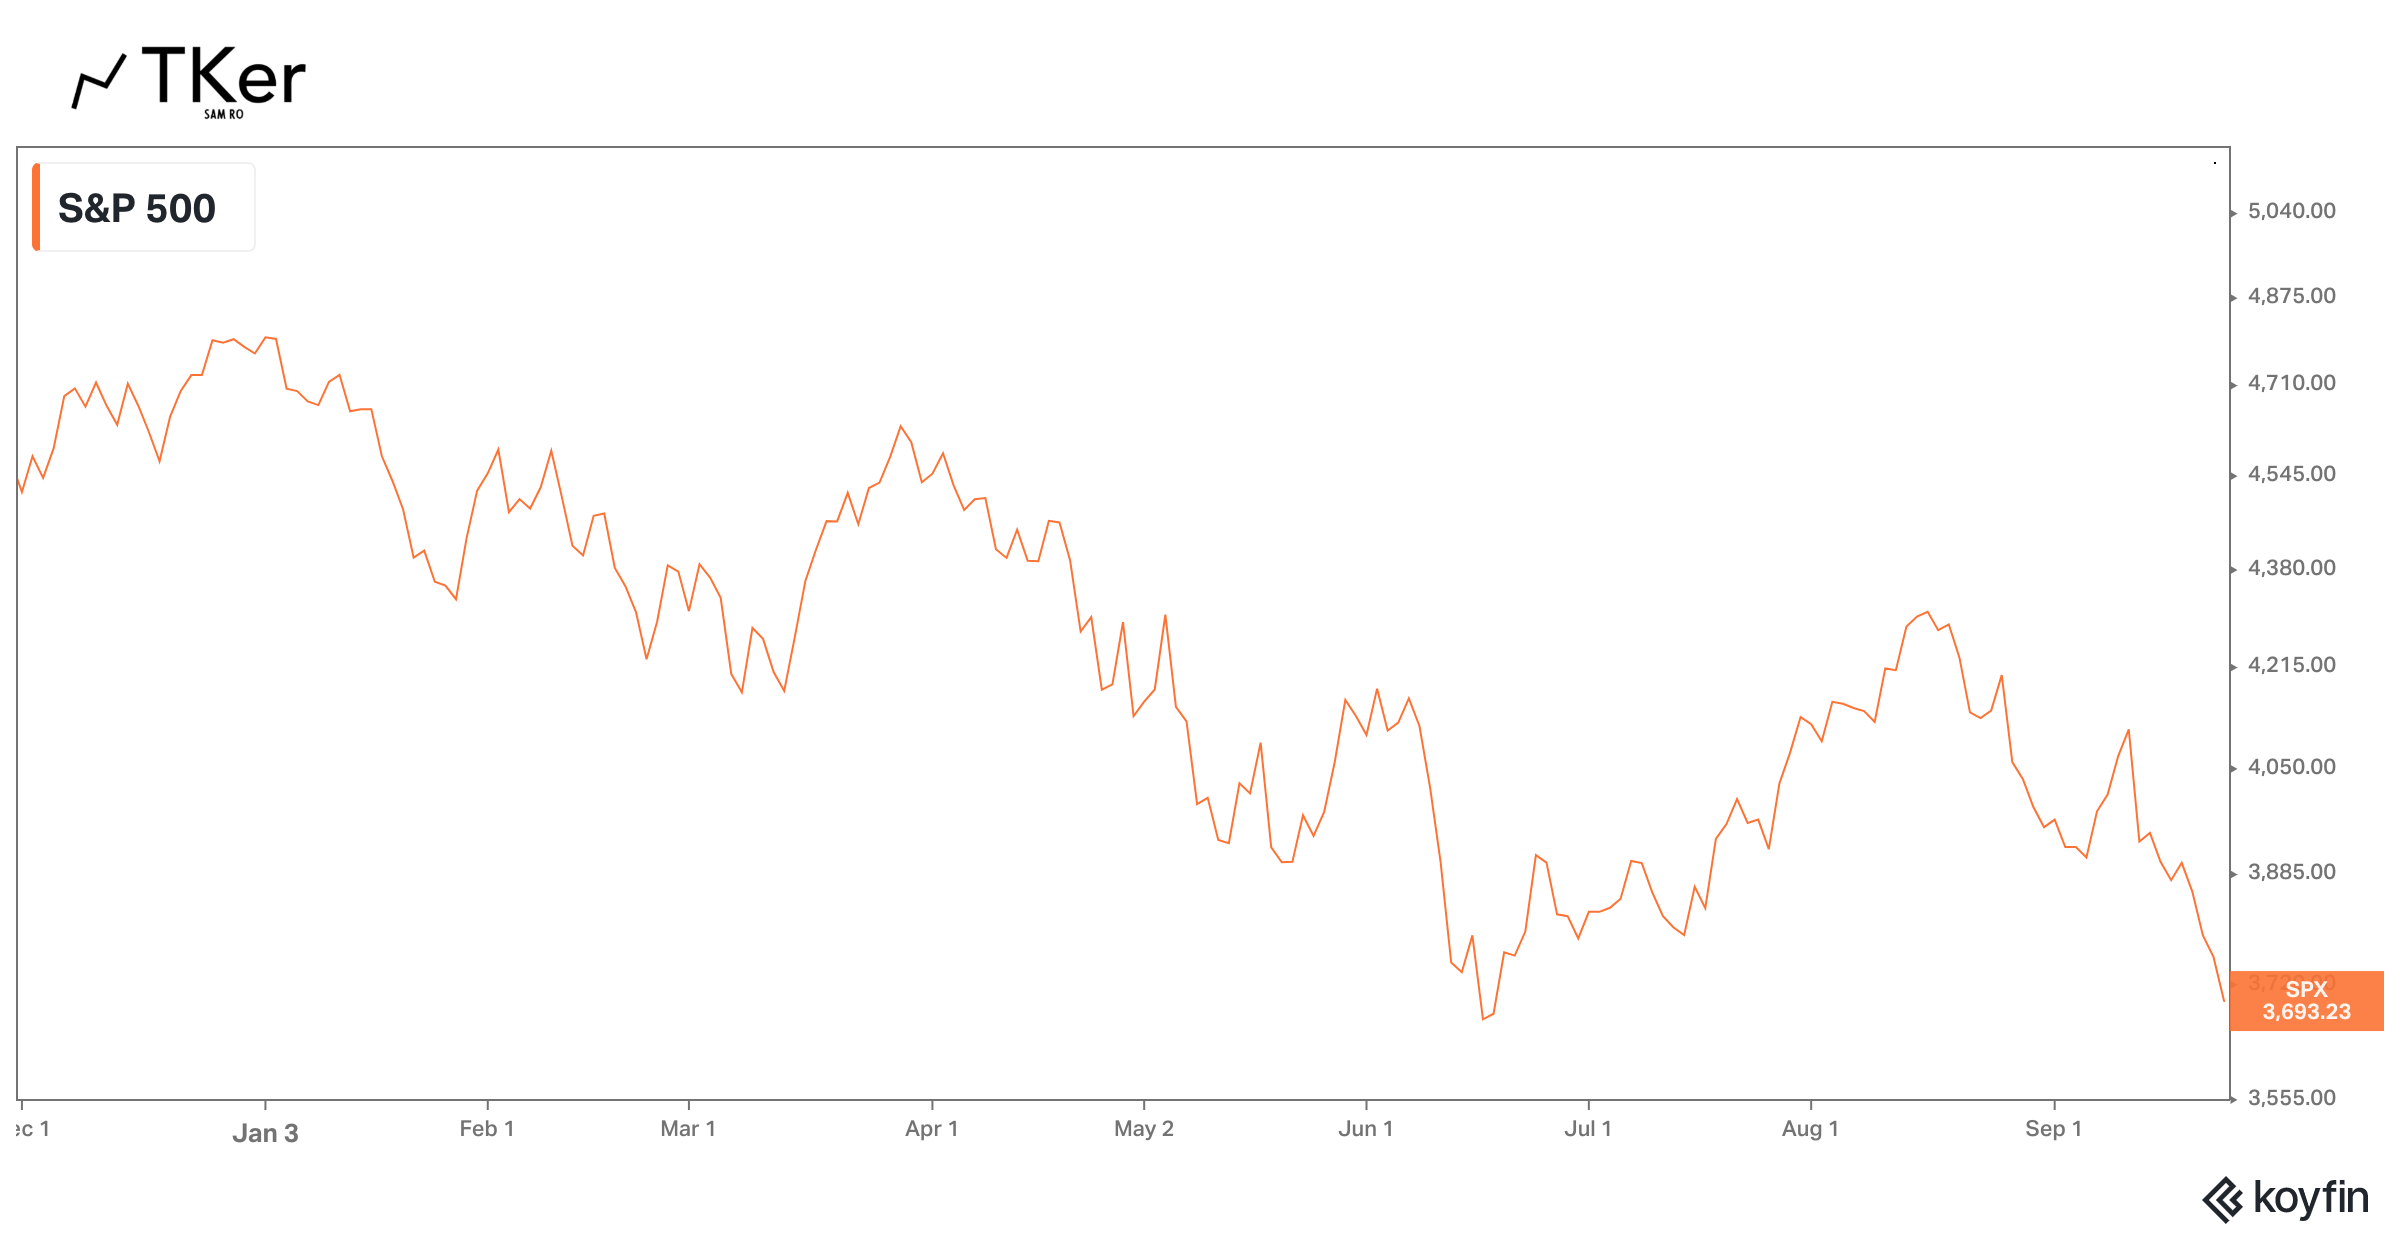
The S&P 500 fell 4.6% to close the week at 3,693.23. The index is now down 23.0% from its January 3 closing high of 4,796.56 and up just 0.7% from its June 16 closing low of 3,666.77.

The global market rout came with surging interest rates and a strengthening dollar.

It’s a big mess as investors suffer and the risk of a severe recession rises.

Analysts continue to reduce their expectations for earnings, warning the slowdown will cause profit margins to contract. (Read more about earnings here and profit margins here.)

Analysts are getting increasingly concerned about earnings. (Source: FactSet)

On Friday, Goldman Sachs slashed its year-end target for the S&P 500 to 3,600 from 4,300 amid higher-than-expected interest rates. From Goldman Sachs’ David Kostin:

“The expected path of interest rates is now higher than we previously assumed, which tilts the distribution of equity market outcomes below our prior forecast. The S&P 500 index actually reached our previous year-end target of 4300 in mid-August, but the rate complex has subsequently shifted dramatically. The higher interest rate scenario that we now incorporate into our valuation model supports a P/E of 15x (vs. prior forecast of 18x) and implies a year-end (3-month) S&P 500 target of 3600 (-5%) and 6-month and 12-month forecasts of 3600 (-5%) and 4000 (+6%).”

This is the firm’s fourth downward revision to its S&P target since the beginning of the year when it predicted the index to end the year at 5,100. (To be fair, almost all of the top strategists on Wall Street have cut their targets multiple times. It’s all a reminder that forecasting the stock market is very hard.)

1

“The outlook is unusually murky,” Kostin wrote. “The forward paths of inflation, economic growth, interest rates, earnings, and valuations are all in flux more than usual with a wider distribution of potential outcomes.”

That said, all of this market volatility seems to be what the Fed wants. In its effort to bring down inflation, the central bank has been tightening monetary policy, which has led to tighter financial conditions. Tighter financial conditions — which manifests in the form of higher borrowing costs, falling stock valuations, and a stronger dollar — are intended to slow demand in the economy, which in turn should help cool prices.

All of this speaks to the ongoing conundrum in markets: As long as inflation is uncomfortably high, the Fed will act in ways that are unfriendly to stock prices.

And so as long as inflation remains high, investors should manage their expectations for near-term returns.

Longer term, things look a bit more promising.

“Historically, buying stocks after they have been down 20% from record highs has been a good risk/reward proposition for longer-term investors,” Keith Lerner, chief market strategist at Truist Advisory Services, wrote on Friday. “Following past instances, the S&P 500 has been higher three years later in eight out of nine cases with a solid average return of 29%.”

(Source: Truist Advisory Services)

As usual, in the stock market, time pays.

By the way, keep in mind that the S&P 500 sees an average decline of roughly 30% around recessions. So assuming we’re heading for a recession, it’s possible that most — or perhaps all — of the downside is already priced in.

-

More from TKer:

  • Use valuation metrics like the P/E ratio with caution ⚠️

  • The record-high $1 trillion of stock buybacks isn't as wild as it seems 🧐

  • Are 'gravity-defying' profit margins finally coming to an end? 💸

  • Expectations for S&P 500 earnings are slipping 📉

  • Wall Street pros warn of more stock market volatility 🎢

Share


Reviewing the macro crosscurrents 🔀

There were a few notable data points from last week to consider:

  • 🤕 Powell reiterates pain. On Wednesday, the Federal Reserve hiked interest rates by another 75 basis points. Fed Chair Jerome Powell warned the central bank’s efforts to bring down inflation would come with economic pain. Indeed, Fed officials expect the labor market to cool with the unemployment rate jumping to 4.4% in 2023, up from the current 3.7% rate. “As an empirical observation, when the jobless rate rises that much from its low, a recession is in train,“ Neil Dutta, head of U.S. economics at Renaissance Macro Research, wrote on Thursday.

  • 💸 King dollar reigns supreme. The U.S. dollar surged against other currencies with the U.S. dollar index hitting a 20-year high. This is a significant risk to the S&P 500 as the underlying companies have significant exposure in non-U.S. markets.

  • 🙃 Rates surge and yield curve inverts. The 2-year Treasury yield jumped to a 15-year high. The 10-year yield hit an 11-year high. The former has been higher than the latter, which means the yield curve is inverted — a phenomenon that typically precedes recessions.

(Source: @CharlieBilello)
  • 🚨 Recession warning sign. The Conference Board’s Leading Economic Index

    2
    fell for the sixth consecutive month in August. The six-month average change was -0.46%, a reading that's historically associated with recessions. From The Conference Board's Ataman Ozyildirim: "Economic activity will continue slowing more broadly throughout the US economy and is likely to contract. A major driver of this slowdown has been the Federal Reserve’s rapid tightening of monetary policy to counter inflationary pressures. The Conference Board projects a recession in the coming quarters."

The LEI is sending a recession signal. (Source: The Conference Board)
  • 📉 Several U.S. states are already in contraction. From the Philly Fed’s State Coincident Indexes

    3
    report: “ Over the past three months, the indexes increased in 46 states, decreased in three states, and remained stable in one… Additionally, in the past month, the indexes increased in 26 states, decreased in 14 states, and remained stable in 10…“

(Source: Philly Fed)
  • 🙏 But it’s not all terrible. The S&P Global Flash US PMI Composite Output Index signaled contraction in economic activity in September. However, new orders grew, indicating good things down the road. Also, price inflation cooled, supplier deliveries sped up, and hiring activity continued to rise.

(Source: SPDJI)
  • 💼 The labor market is holding up. Even as the economy cools and hiring slows, employers seem to be holding on tight to their employees. Initial claims for unemployment insurance came in at 213,000 for the week ending September 17, up from 208,000 the week prior. While the number is up from its six-decade low of 166,000 in March, it remains near levels seen during periods of economic expansion.

Initial claims are low. (Source: DOL)
  • 👍 Yes, there are companies hiring. Amid the anecdotes of companies laying off workers, there are also anecdotes of companies hiring. From Bloomberg: “American Express Co. is on the hunt for software engineers, coders and developers, part of a 1,500-person hiring spree for its sprawling technology arm. The company, the biggest US card issuer by purchases, has already added more than 3,600 technical workers this year and hopes to fill the remaining openings by the end of the year, Ravi Radhakrishnan, AmEx’s chief information officer, said in an interview.“

(Source: Bloomberg)
  • 🏚 Home sales are cooling. Sales of previously owned homes fell 0.4% in August to an annualized rate of 4.8 million units. From NAR chief economist Lawrence Yun: "The housing sector is the most sensitive to and experiences the most immediate impacts from the Federal Reserve's interest rate policy changes. The softness in home sales reflects this year's escalating mortgage rates. Nonetheless, homeowners are doing well with near nonexistent distressed property sales and home prices still higher than a year ago."

(Source: @NAR_Research)
  • 💸 Home prices are cooling. From the NAR: “The median existing-home price for all housing types in August was $389,500, a 7.7% jump from August 2021 ($361,500)... However, it was the second month in a row that the median sales price retracted after reaching a record high of $413,800 in June, the usual seasonal trend of prices declining after peaking in the early summer.“

(Source: @NAR_Research)
  • 🔨 Home construction is cooling. According to the Census Bureau, new building permits fell 10% month-over-month in August. Starts climbed 12.2%, but completions declined by 5.4%. From Wells Fargo: “The surprising gain in total starts is a welcome reprieve from the onslaught of negative housing data received recently. That said, August's sharp decline in permits is a reminder that builders and developers are likely to continue scaling back production in response to retreating demand and higher financing costs.“

Housing construction is cooling. (Source: U.S. Census Bureau)
  • 🛠 Builder sentiment is in the dumps. From the NAHB: “Builder confidence in the market for newly built single-family homes fell three points in September to 46, the lowest level since May 2014 with the exception of the spring of 2020.“ From NAHB chief economist Robert Dietz: “Builder sentiment has declined every month in 2022, and the housing recession shows no signs of abating as builders continue to grapple with elevated construction costs and an aggressive monetary policy from the Federal Reserve that helped pushed mortgage rates above 6% last week, the highest level since 2008. In this soft market, more than half of the builders in our survey reported using incentives to bolster sales, including mortgage rate buydowns, free amenities and price reductions.“

Builder sentiment is tumbling. (Source: NAHB via Bloomberg)
  • 💵 Where the extremely wealthy live. From Credit Suisse: “Looking in more detail at the [ultra-high-net- worth] group reveals 84,490 adults with wealth above USD 100 million at the end of 2021, of which 7,070 are worth more than USD 500 million. The regional breakdown of the UHNW group as a whole is dominated by North America with 146,680 members (56%), while 42,780 (16%) live in Europe, 32,710 (12%) in China and 30,010 (11%) in Asia-Pacific countries, excluding China and India. Among individual countries, the United States leads by a huge margin with 141,140 members, equivalent to 53% of the world total.“

(Source: Credit Suisse)

Share

  • 🏢 Workers are returning to the office. From Kastle Systems: “…office occupancy has continued increasing steadily since Labor Day. Last week, occupancy rose more than four points to 47.5%, the highest level since before the pandemic, according to Kastle’s 10-city Back to Work Barometer. All cities tracked saw significant increases last week, with New York City experiencing the biggest jump, rising 8.7 percentage points to 46.6% occupancy. Despite that, Austin, Texas still surpassed New York City with office occupancy reaching 60.5%. We expect these rates to continue rising.“

  • 📉 Maybe the sell-off is almost over. From Oppenheimer’s Ari Wald: “…major market bottoms have occurred in October more than any other month since 1932. We think the combination of extreme pessimism and “less-intense” selling would provide the setup for another October turn. This reminds us of old Wall Street wisdom to Sell Rosh Hashanah, and Buy Yom Kippur. Those dates fall on September 26th and October 5th, respectively, in 2022.”

Putting it all together 🤔

Tighter monetary policy from the Federal Reserve is clearly impacting the housing market as higher mortgage rates cool activity. But it’s also having the central bank’s intended effect of cooling prices.

It’s the same story with the broader economy: Activity continues to cool while delivery times continue to improve, suggesting supply chain constraints continue to ease, which is taking pressure off of prices.

While some price indicators have been easing, inflation nevertheless remains troublingly high. Consequently, financial markets remain volatile as the Fed increasingly tightens financial conditions in its effort to cool prices.

The good news is the labor market remains very strong, with layoff activity near record lows. But prepare for things to cool. Even the Fed understands that its efforts could cause unemployment to rise.

And so, recession risks are intensifying and analysts are trimming their forecasts for earnings. For now, all of this makes for a conundrum for the stock market and the economy until we get “compelling evidence” that inflation is indeed under control.

For more, check out last week’s TKer macro crosscurrents »

Share


Best of TKer 📈

Here’s a roundup of some of TKer’s most talked-about paid and free newsletters. All of the headlines are hyperlinked to the archived pieces.

Why the recession we may or may not be heading for won't be that bad 💪

While the economy may not be in a recession now, it’s certainly slowing and is at risk of going into a recession. However, not every recession has to be an outright economic debacle like the global financial crisis or the Great Depression. Yes, unemployment would likely rise during the next recession, which would be unquestionably painful for those affected. But the losses could be limited and the duration of the economic contraction could be relatively short.

You can make any piece of data look bad if you try 🔄

There’s more than one way to frame a piece of economic or financial market data. It might be better than expected relative to economists’ expectations, but it could also be worse than expected relative to traders’ expectations. That same stat could be down on a month over month basis and also up on a year over year basis. It may be high relative to the 10-year average but low relative to the 5-year average. It may look bad on an absolute basis but it may look good relative to what may be the normal course of business. With that in mind, below are nine unsettling — albeit accurate — market observations that miss the point when you take a look at the big picture.

The complicated mess of the markets and economy, explained 🧩

Economic growth has since been awesome, powered by tons of job growth. GDP, personal consumption, and home prices roared to record levels as the unemployment rate tumbled. One problem: Inflation. Why? Supply hasn’t been able to keep up with booming demand, a dynamic that’s been fanning the flames of inflation.

The market beatings will continue until inflation improves 🥊

While the stock market is likely to generate healthy returns in the long run, there’s good reason for investors to manage expectations in the short run as the Federal Reserve gets increasingly aggressive with monetary policy.

Your guide to 'good news is bad news' and 'bad news is good news' 🙃

The Fed is actively trying to slow the economy — even if it means “some pain” for businesses and consumers — because it believes that is the prescription for getting inflation under control. In this world, good news about the economy is potentially bad news if it’s exacerbating the dislocation between supply and demand. Let’s review a few hypothetical headlines and examine why good news might be bad news — and vice versa.

700+ reasons why S&P 500 index investing isn't very 'passive'💡

Passive investing is a concept usually associated with buying and holding a fund that tracks an index. And no passive investment strategy has attracted as much attention as buying an S&P 500 index fund. However, the S&P 500 — an index of 500 of the largest U.S. companies — is anything but a static set of 500 stocks. From January 1995 through April 2022, 728 tickers have been added to the S&P 500, while 724 have been removed.

Share

1

As of the Dec. 5 TKer, Wall Street strategists were anticipating the S&P 500 to end 2022 somewhere between 4,400 to 5,300. The market is currently trading below the most bearish strategist’s target. Who knows? Maybe the market will surge during the final months of this year. That said, I think this excerpt from that newsletter was noteworthy:

⚠️ It’s incredibly difficult to predict with any accuracy where the stock market will be in a year. In addition to the countless number of variables to consider, there are also the totally unpredictable developments that occur along the way.

Strategists will often revise their targets as new information comes in. In fact, some of the numbers you see above represent revisions from prior forecasts.

For most of y’all, it’s probably ill-advised to overhaul your entire investment strategy based on a one-year stock market forecast.

Nevertheless, it can be fun to follow these targets. It helps you get a sense of the various Wall Street firm’s level of bullishness or bearishness.

2

Here’s more detail from the Conference Board: “The LEI is a predictive variable that anticipates (or “leads”) turning points in the business cycle by around 7 months… The ten components of The Conference Board Leading Economic Index® for the U.S. include: Average weekly hours in manufacturing; Average weekly initial claims for unemployment insurance; Manufacturers’ new orders for consumer goods and materials; ISM® Index of New Orders; Manufacturers’ new orders for nondefense capital goods excluding aircraft orders; Building permits for new private housing units; S&P 500® Index of Stock Prices; Leading Credit Index™; Interest rate spread (10-year Treasury bonds less federal funds rate); Average consumer expectations for business conditions.”

3

Here’s more detail from the Philly Fed: “The coincident indexes combine four state-level indicators to summarize current economic conditions in a single statistic. The four state-level variables in each coincident index are nonfarm payroll employment, average hours worked in manufacturing by production workers, the unemployment rate, and wage and salary disbursements deflated by the consumer price index (U.S. city average). The trend for each state’s index is set to the trend of its gross domestic product (GDP), so long-term growth in the state’s index matches long-term growth in its GDP.“

1
Share this post

The market beatings continue amid an 'unusually murky' outlook 🥊

www.tker.co
Previous
Next
1 Comment
Jin Daikoku
Sep 25, 2022Liked by Sam Ro, CFA

Any commentary regarding inflation in goods vs services? Could make for a good article.

Thanks as always.

Expand full comment
Reply
TopNewCommunity

No posts

Ready for more?

© 2023 Samuel Ro
Privacy ∙ Terms ∙ Collection notice
Start WritingGet the app
Substack is the home for great writing