
Picking a market-beating stock is far from a coin flip 🪙
A simple concept explains how a few big winners carry the market's returns 💪

Picking stocks in an attempt to beat the market averages is a challenging and often money-losing endeavor. In fact, most professional stock pickers aren’t able to beat their benchmarks consistently.
One reason for this is that few stocks actually deliver above-average returns.
According to S&P Dow Jones Indices, only 19% of S&P 500 index constituents outperformed the average stock’s return from the beginning of 2001 through Sept. 2025.
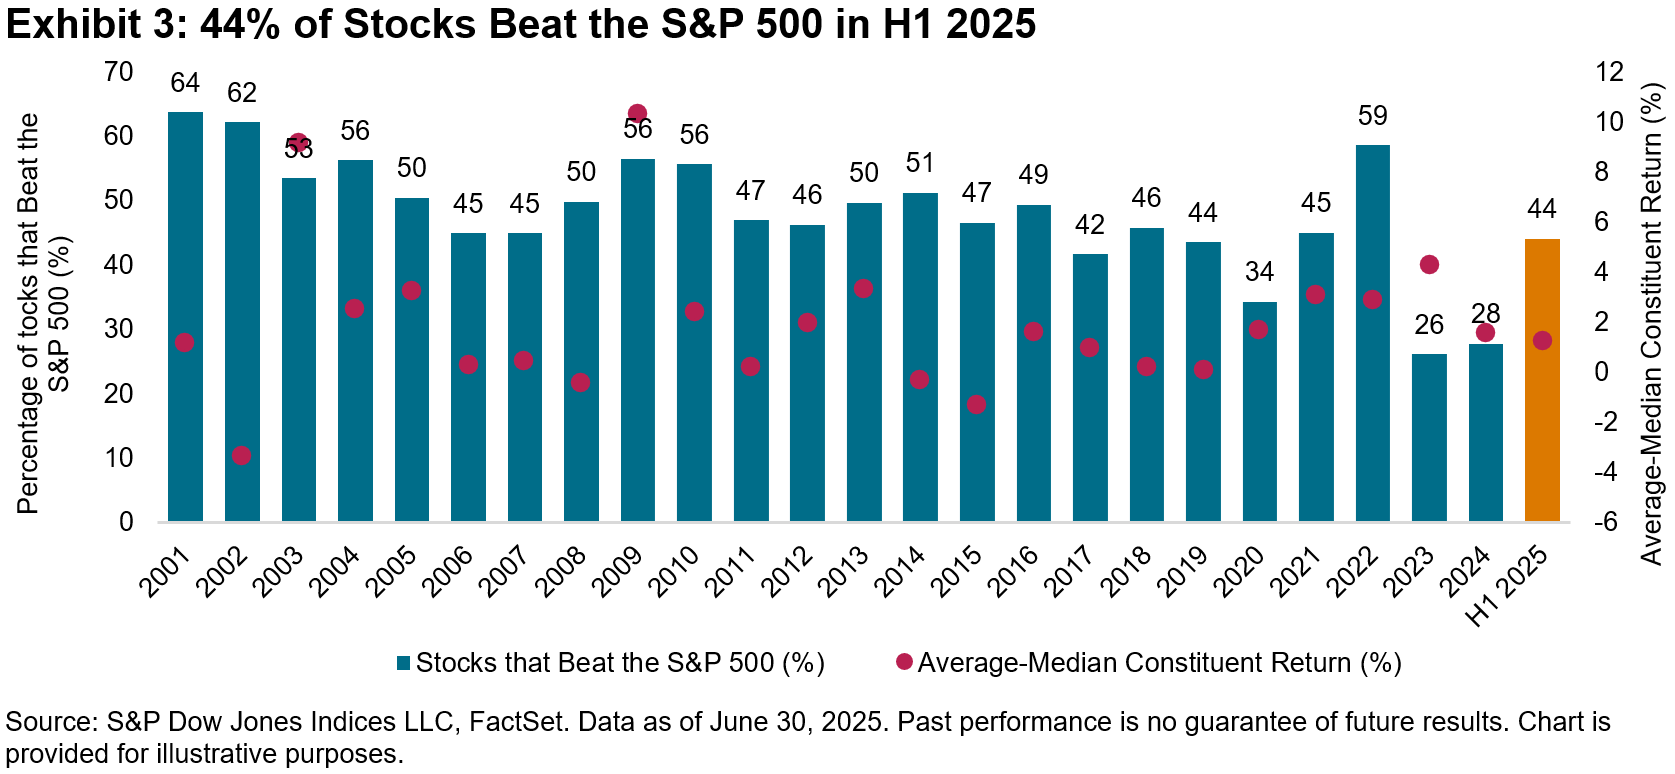
Just 44% of S&P 500 constituents outperformed the index in the first half of 2025. Only 28% outperformed in 2024. Most S&P stocks underperformed the index in 13 of the past 24 calendar years.
In other words, the odds of picking market-beating stocks have historically been worse than a coin flip.
If you beat the odds and successfully pick a market-beating stock, you could crush the market average. That’s because returns are positively skewed, and they have a very long right tail. When you invest in a stock, you can only lose 100% (the left tail), but your upside (the right tail) is theoretically unlimited.
This speaks to TKer Stock Market Truth No. 4: Stocks offer asymmetric upside.
“A long-standing challenge that active managers face is the positively skewed nature of equity returns, with an average return greater than that of the median,” wrote Anu Ganti, S&P Dow Jones’ Head of U.S. Index Investment Strategy.
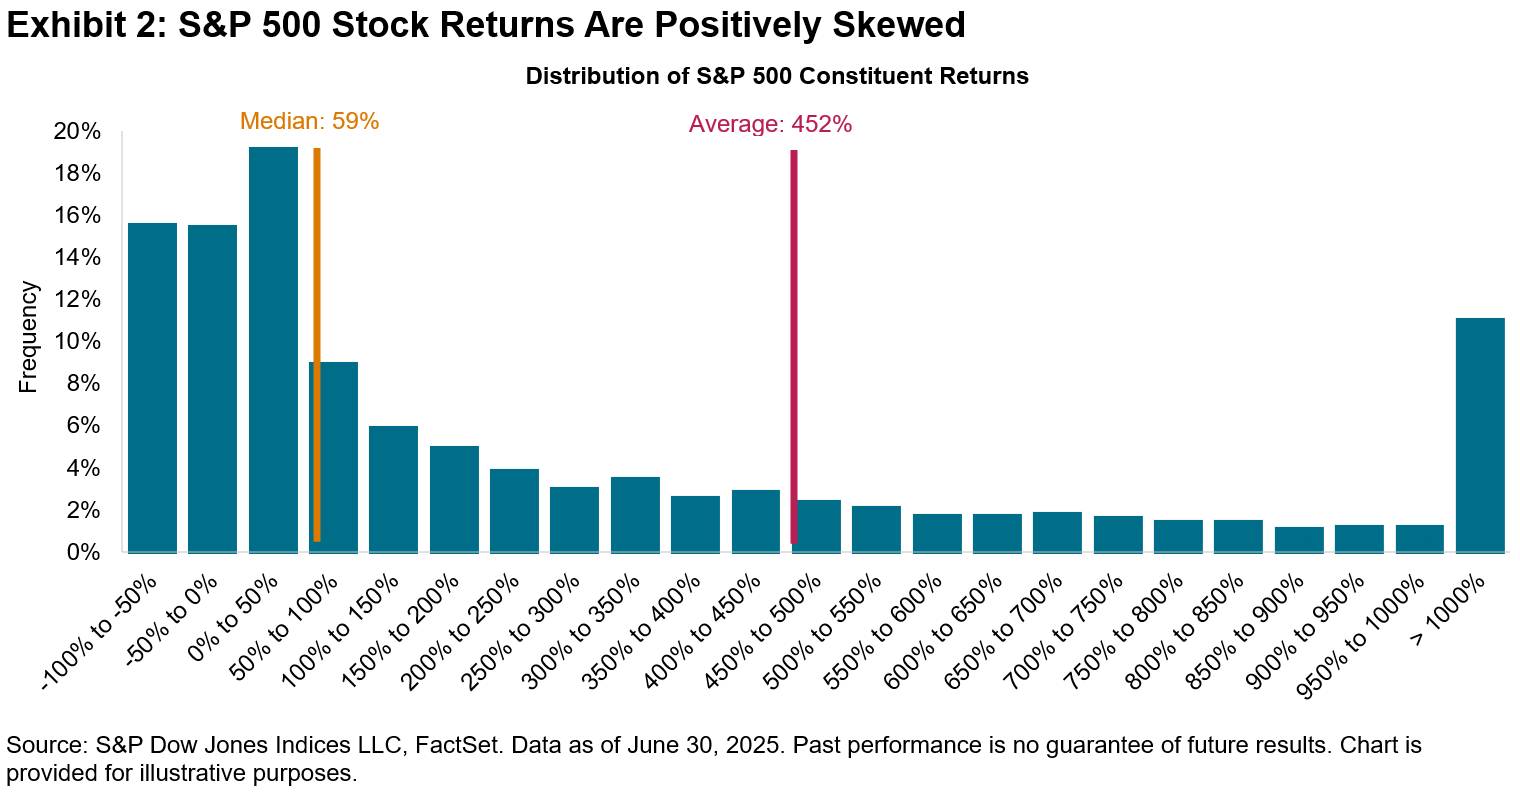
“The median return was 59%, far less than the arithmetic average of 452%,” Ganti observed after reviewing the data since 2001.
So while half of the S&P 500 constituents generated a return of 59% or less, the minority of stocks generating extraordinary returns lifted the average all the way to 452%.
The chart below explores this story from the perspective of each year’s performance. As the red dots show, the average return has been greater than the median return in 20 out of the past 24 years.
“When fewer stocks outperform, active management is harder,” Ganti said. “This is especially relevant for more concentrated portfolios that may be less likely to hold one of the relatively small number of outperforming stocks.”
This echoes something Warren Buffett said in his 2023 annual letter.
