
Reflecting on the stock market's headwind-defying run 📈
Plus a charted review of the macro crosscurrents 🔀

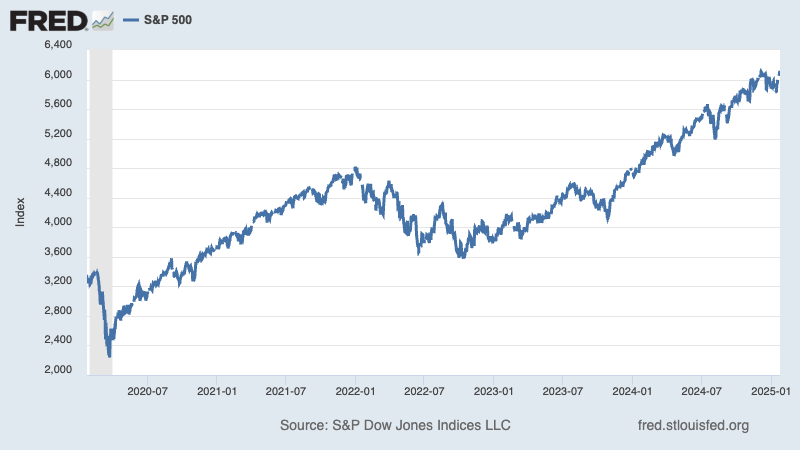
📈The stock market climbed to all-time highs, with the S&P 500 setting an intraday high of 6,128.18 on Friday and a closing high of 6,118.71 on Thursday. The index gained 1.7% last week to close at 6,101.24. It’s now up 3.7% year to date and up 70.6% from its October 12, 2022 c…
