[UPDATE 12/18/23: For additional and updated 2024 targets and commentary, read this.]
Stocks climbed last week, with the S&P 500 rising 0.8% to close at 4,594.63. The index is now up 19.7% year to date, up 28.4% from its October 12, 2022 closing low of 3,577.03, and down 4.2% from its January 3, 2022 record closing high of 4,796.56.
It’s that time of year when Wall Street’s top strategists tell clients where they see the stock market heading in the year ahead. Typically, the average forecast for the group predicts the S&P 500 climbing by about 10%, which is in line with historical averages.
This year, strategists are offering a pretty wide range of views. Some see weakness. Some see strength. The targets range from 4,200 to 5,500. This implies returns between -8.5% and +19.7% from Friday’s close. For what it’s worth, the forecasts aren’t as skewed to the downside as they were last year.
Before we move on, I’d caution against putting too much weight into one-year targets. It’s extremely difficult to predict short-term moves in the market with any accuracy. Few on Wall Street have ever been able to do this successfully. I do however think the research, analysis, and commentary behind these forecasts can be informative.
That said, here’s what’s driving Wall Street’s views for 2024:
The economists that these stock market forecasters work with are split on whether the U.S. economy will go into recession some time during the year, which has implications for revenue among other things. Those who are expecting continued expansion expect growth to be modest, and those looking for a recession expect any downturn to be brief and shallow. (Scroll down for: Wall Street’s 2024 U.S. economic outlook 🇺🇸)
Interestingly, most strategists still expect S&P 500 earnings to grow in 2024 despite lackluster GDP growth forecasts. This may have to do with the expectation that consumer spending shifts back toward goods from services and the fact that the S&P has greater exposure to the goods sector, whereas U.S. GDP has greater exposure to the services sector.
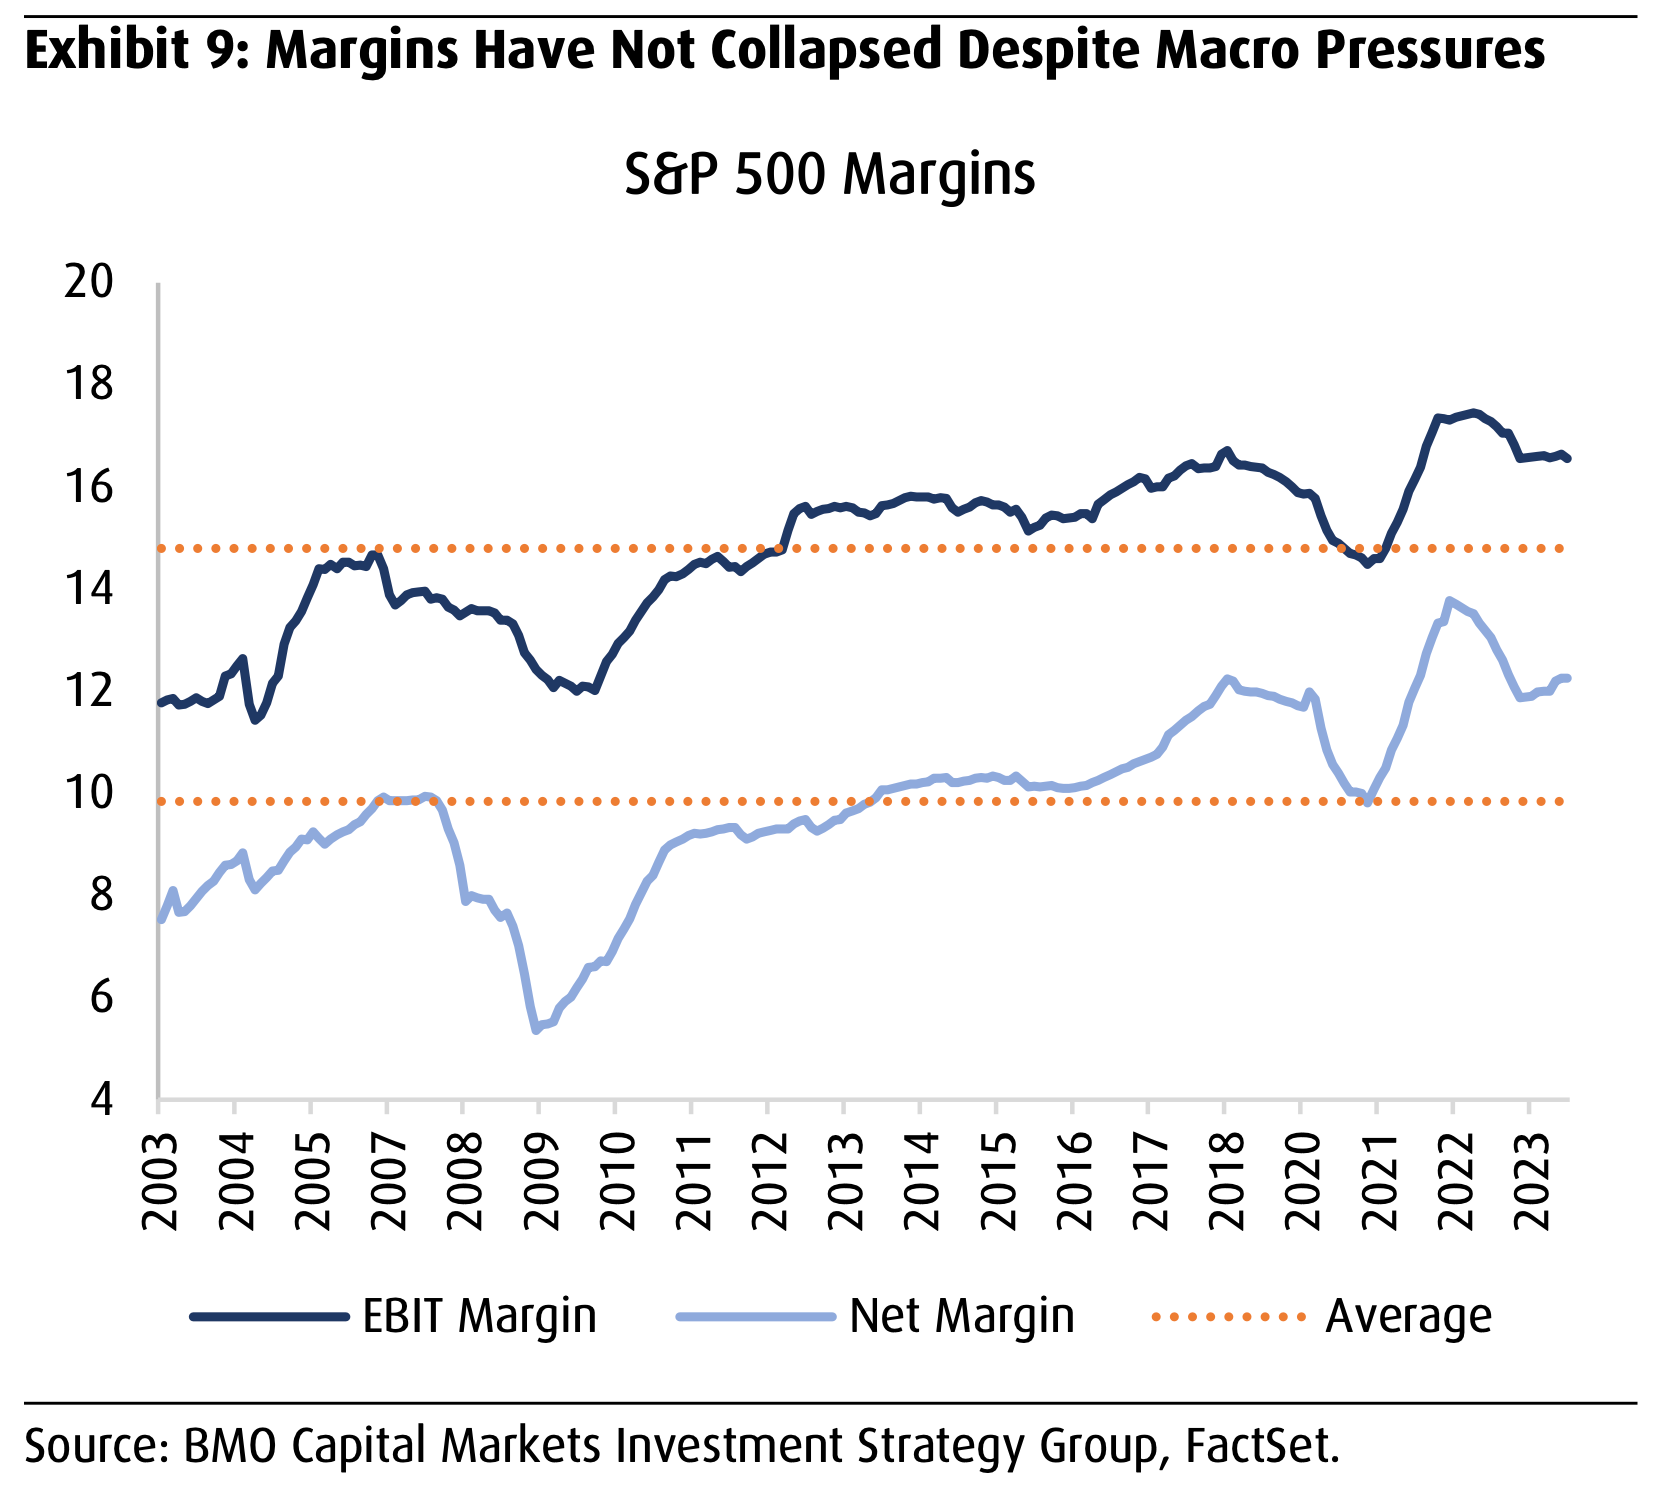
Thanks to improved operating efficiencies, many — but not all — strategists expect profit margins to stay high, which could help amplify earnings growth even with modest revenue growth.
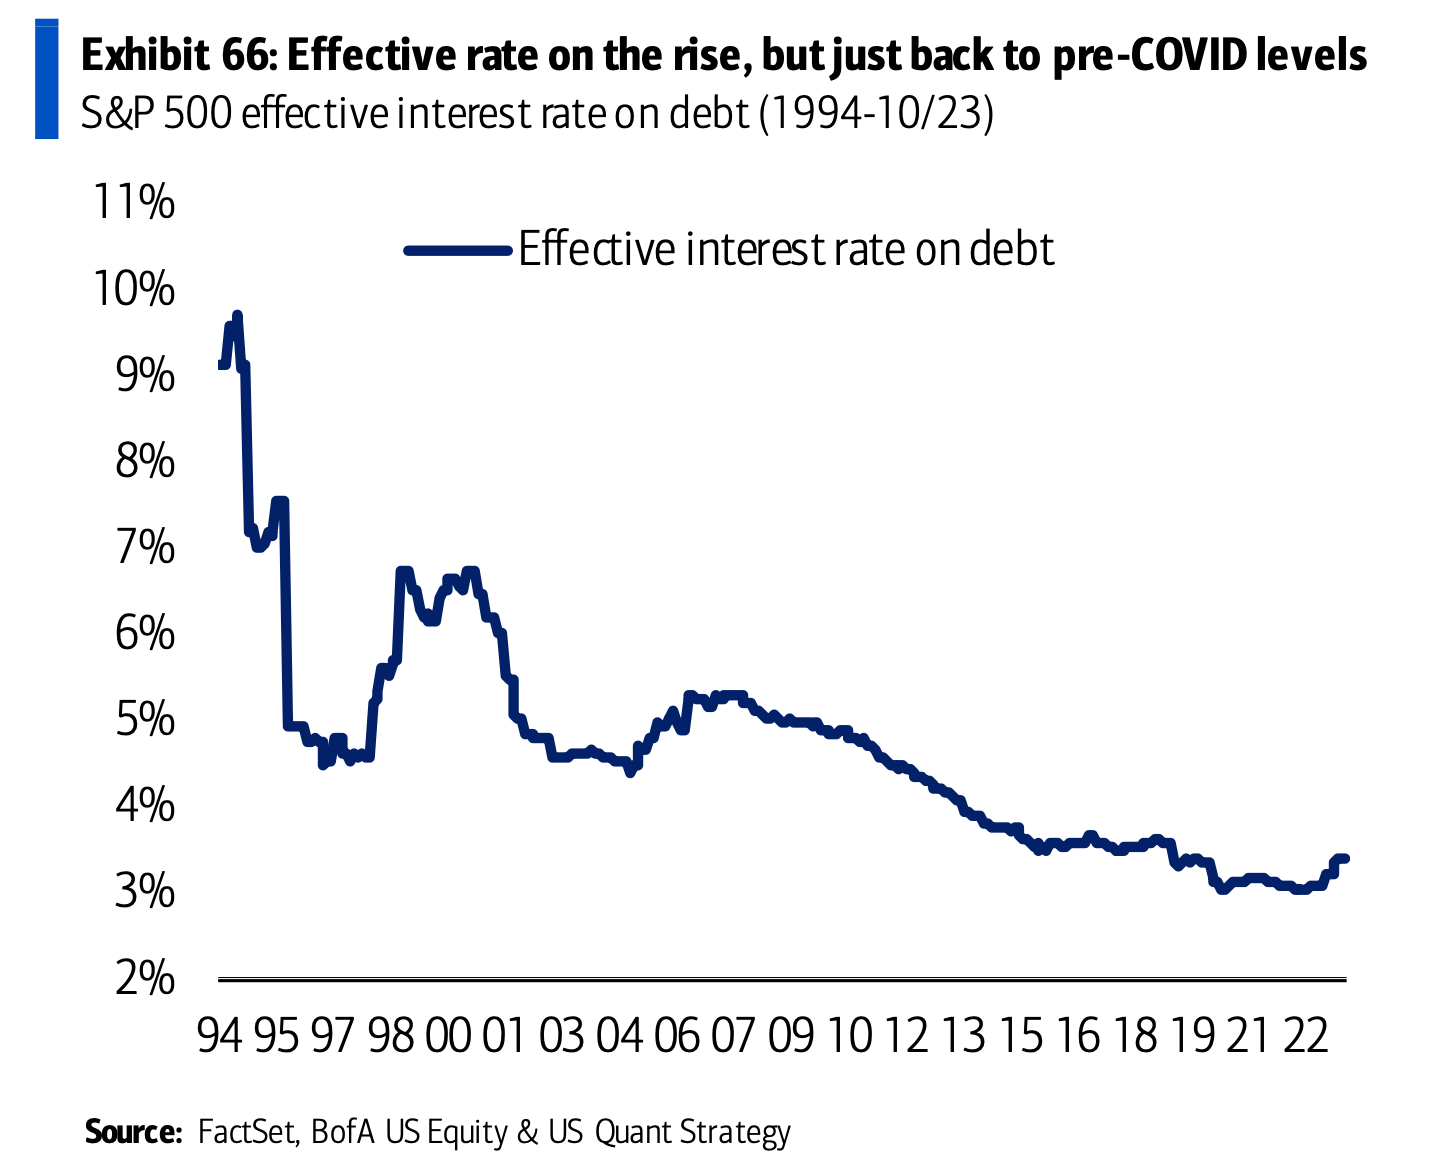
While most S&P 500 companies have low interest rates on their debts locked in for years, more and more firms will still have to refinance at market rates, which continue to hover at their highest levels in years. Higher interest expense is a headwind for earnings growth.
Most strategists agree that the worst of the inflation crisis is behind us. This means that should economic conditions deteriorate significantly, the Federal Reserve may once again find itself loosening financial conditions with interest rate cuts. While an economic downturn would be unwelcome, it’s nevertheless good news that the Fed seems to have room to stimulate the economy.
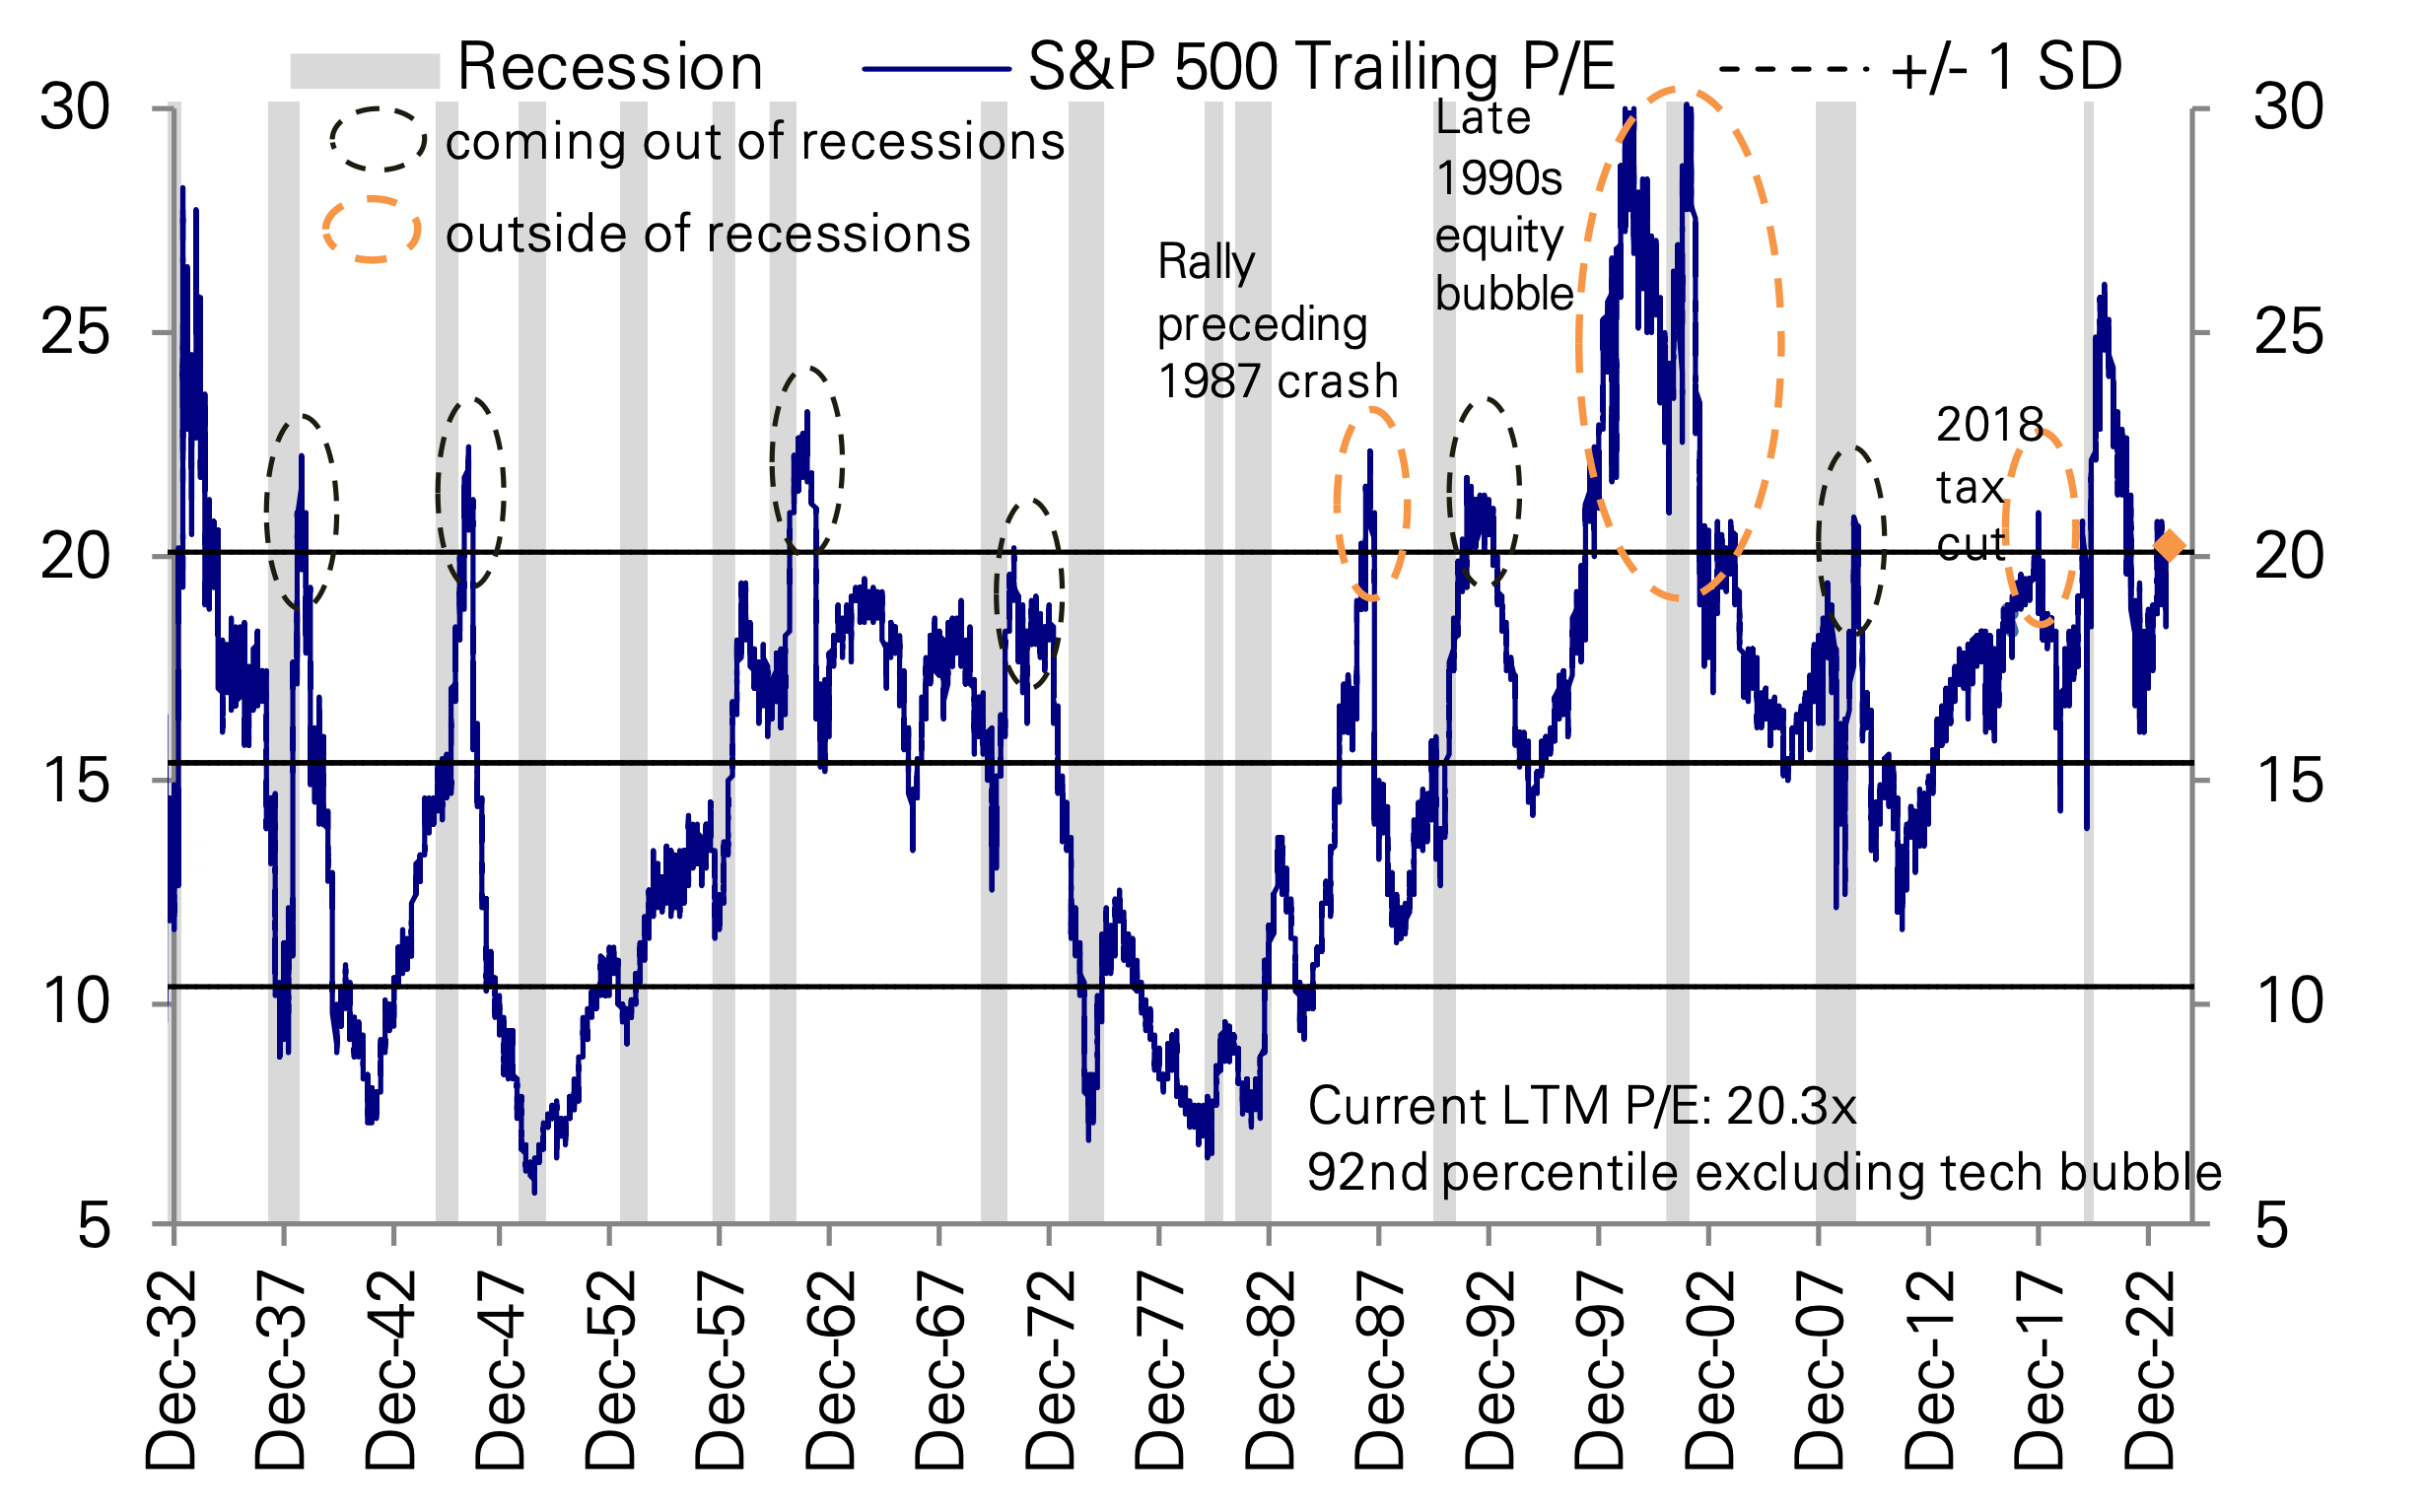
Strategists are also split on whether valuations are reasonable or whether they are a bit rich. This debate won’t go away anytime soon as valuations have historically signaled very little about short-term market moves.
On valuations, at least one strategist argues that excitement for artificial intelligence technologies could persist into the new year, and the market could be in the early stages of a bubble.
The 2024 S&P 500 price targets 🔮
Below is a roundup of 12 of these 2024 forecasts for the S&P 500, including highlights from the strategists’ commentary.
JPMorgan: 4,200, $225 EPS (as of Nov. 29) “With a stepdown in economic growth next year (US growth to slow to 0.7% YoY by 4Q24 from 2.8% 4Q23), eroding household excess savings and liquidity, and tightening credit, we see 2024 consensus hockey-stick EPS growth of 11% as unrealistic… Negative corporate sentiment should be a catalyst for sharply lower estimates early next year.“
Morgan Stanley: 4,500, $229 EPS (as of Nov. 13) “Near-term uncertainty should give way to an earnings recovery... Our 2024 EPS estimate [of $229] is consistent with output from our leading earnings models, which show a recovery in growth next year as well as our economists' expectations for growth next year... 2025 represents a strong earnings growth environment (+16%Y) as positive operating leverage and tech-driven productivity growth (AI) lead to margin expansion. On the valuation front, we forecast a 17.0x forward P/E multiple at the end of next year (20-year average P/E is 15.6x; currently 18.1x).“
UBS: 4,600, $228 EPS (as of Nov. 8) “Our 2024 target is based on a YE 2024E multiple of 18.5x (a -0.7x multiple point contraction) applied to 2025E EPS of $249. While UBS anticipates a steep decline in yields over this period, higher equity risk premiums should offset this benefit.“
Wells Fargo: 4,625, $235 EPS (as of Nov. 27) “With VIX low, credit spreads tight, equities rallying, and cost of capital higher/volatile, it's time to downshift. Expect a volatile and ultimately flattish SPX in 2024 (4625), as valuation limits upside and rate uncertainty elevates downside risk.“
Goldman Sachs: 4,700, $237 EPS (as of Nov. 15) “Our baseline assumption during the next year is the U.S. economy continues to expand at a modest pace and avoids a recession, earnings rise by 5%, and the valuation of the equity market equals 18x, close to the current P/E level. Our forecast falls slightly below the typical 8% return during presidential election years.“
Societe Generale: 4,750, $230 EPS (as of Nov. 20) “The S&P 500 should be in ‘buy-the-dip’ territory, as leading indicators for profits continue to improve. Yet, the journey to the end of the year should be far from smooth, as we expect a mild recession in the middle of the year, a credit market sell-off in 2Q and ongoing quantitative tightening.“
Barclays: 4,800, $233 (as of Nov. 28) “Whether ‘new normal’ or ‘old,’ a roller coaster 2023 proved that this cycle is anything but. We expect US equities to deliver single-digit returns next year as easing inflation is offset by modest economic deceleration.“
Bank of America: 5,000, $235 EPS (as of Nov. 21) “The equity risk premium could fall further, especially ex-Tech: we are past maximum macro uncertainty. The market has absorbed significant geopolitical shocks already and the good news is we’re talking about the bad news. Macro signals are muddled, but idiosyncratic alpha increased this year. We’re bullish not because we expect the Fed to cut, but because of what the Fed has accomplished. Companies have adapted (as they are wont to do) to higher rates and inflation.“
RBC: 5,000, $232 EPS (as of Nov. 22) “While the November rally has likely pulled forward some of 2024’s gains, we remain constructive on the U.S. equity market in the year ahead. Our valuation and sentiment work are sending constructive signals, partially offset by headwinds from a sluggish economy and uncertainty around the 2024 Presidential election. Our work also suggests that the greater appeal of bonds may end up being a dampener of US equity market returns but not necessarily a derailer of them.“
Deutsche Bank: 5,100, $250 (as of Nov. 27) “Are valuations high? We don’t think so. If inflation returns to 2%, as economists forecast and is priced in across asset classes, while payout ratios remain elevated, fair value in our reading is 18x, with a range of 16x-20x, which they have been in for the last 2 years. If earnings growth continues to recover as we forecast, valuations will remain well supported.“
BMO: 5,100, $250 EPS (as of Nov. 27) “[W]e believe U.S. stocks will attain another year of positive returns in 2024, albeit while demonstrating more sanguine, broadly distributed, and fundamentally defined performance relative to the last decade or so. In other words, normal and typical.“
Capital Economics: 5,500 (as of Dec. 1) “Still time for the S&P 500 to party like it’s 1999 …it has come a long way lately, thanks both to a rise in its valuation and to an increase in expectations for future earnings. …This partly reflects investors’ enthusiasm about AI technology. …if AI enthusiasm is inflating a bubble in the S&P 500, it’s one that is still in its early stages. We think the index could therefore make further gains: our end-2024 forecast is 5,500, ~20% above its current level.“
Two things about one-year price targets 🙋🏻♂️
Most of the equity strategists TKer follows produce incredibly rigorous, high-quality research that reflects a deep understanding of what drives markets. Consequently, the most valuable things these pros have to offer have little to do with one-year targets. (And in my years of interacting with many of these folks, at least a few of them don’t care for the exercise of publishing one-year targets. They do it because it’s popular with clients.)
So first off, don’t dismiss their work just because their one-year target is off the mark.
Second, I’ll repeat what I always say when discussing short-term forecasts for the stock market:
⚠️ It’s incredibly difficult to predict with any accuracy where the stock market will be in a year. In addition to the countless number of variables to consider, there are also the totally unpredictable developments that occur along the way.
Strategists will often revise their targets as new information comes in. In fact, some of the numbers you see above represent revisions from prior forecasts.
For most of y’all, it’s probably ill-advised to overhaul your entire investment strategy based on a one-year stock market forecast.
Nevertheless, it can be fun to follow these targets. It helps you get a sense of the various Wall Street firms’ level of bullishness or bearishness.
Good luck in 2024!
For older forecasts, read: Wall Street's 2023 outlook for stocks 🔭. and Wall Street's 2022 outlook for stocks 🔭.
-
Related from TKer:
The 'critical' consumer shift that could define stock performance in 2024 🔀
Just because bonds have become more attractive doesn't mean stocks have become unattractive 😍
A bullish way the stock market might not look like the economy in 2024 🤯
Goldman Sachs says to 'follow Taylor Swift's advice' in 2024 💃
Wall Street’s 2024 U.S. economic outlook 🇺🇸
Below is a sampling of what Wall Street is saying about the economy in 2024.
JPMorgan: “Although the economy has apparently managed to escape recession this year, we believe the risk of a downturn in ‘24 remains elevated. Fading post-pandemic tailwinds, building monetary headwinds, and dwindling fiscal offsets should all contribute to holding growth below trend, and we project real GDP to expand 0.7% in the coming year (4Q/4Q).“
Morgan Stanley: “High rates for longer cause a persistent drag, more than offsetting the fiscal impulse and bringing growth sustainably below potential from 3Q24. We maintain our view that the Fed will achieve a soft landing, but weakening growth will keep recession fears alive. We forecast that GDP slows from an estimated 2.5% 4Q/4Q (2.4%Y) in 2023 to 1.6% (1.9%) in 2024, and 1.4% (1.4%) in 2025.“
UBS: “We expect economic growth to slow sharply in the next few quarters, with a mild contraction worth half a percentage point in the middle of the year.“
Wells Fargo: “There already are some cracks that are beginning to appear in the economy, and these strains likely will intensify in the coming months as monetary restraint remains in place. Our base case is that real GDP will contract modestly starting in mid-2024.“
Goldman Sachs: “With the more daunting problems largely solved, the conditions for inflation to return to target in place, and the heaviest blows from monetary and fiscal tightening well behind us, we now see only a historically average 15% probability of recession over the next 12 months.“
Societe Generale: “In the US, the long-predicted recession will in our view belatedly materialise in 2024, most likely during the middle quarters of the year, though it stands to be brief and shallow.“
Barclays: “Base Case: Soft Landing“
BofA: “We see a soft landing – a period of positive but below-trend growth – as the most likely scenario“
RBC: “Inflation data is on the right track. Mounting headwinds should lead to slower growth and softer labor markets but stop short of recession.“
BMO: “But if [a recession] does occur, we would borrow an acronym from the political lexicon to describe its likely severity – RINO or recession in name only since labor market data continues to remain remarkably resilient and employment levels are what almost always determine how good or bad things get in the economy from our perspective.“
Deutsche Bank: “Our forecast of a mild recession in H1 2024 is thus little changed since our last update in October.“
-
Related from TKer:
Reviewing the macro crosscurrents 🔀
There were a few notable data points and macroeconomic developments from last week to consider:
👍 Inflation rates cool. The personal consumption expenditures (PCE) price index in October was up 3.0% from a year ago, down from the 3.4% increase in September. The core PCE price index — the Federal Reserve’s preferred measure of inflation — was up 3.5% during the month after coming in at 3.7% higher in the prior month.
On a month over month basis, the core PCE price index was up 0.16%. If you annualized the rolling three-month and six-month figures, the core PCE price index was up 2.4% and 2.5%, respectively.
While inflation rates remain above the Federal Reserve’s 2% target, they are clearly trending in that direction.
For more on cooling inflation, read: The end of the inflation crisis 🎈
⛽️ Gas prices are down. From AAA: “Despite less than stellar domestic demand, the national average for a gallon of gas fell only two cents since last week. The primary culprit is the cost of oil, which is creeping closer to $80 a barrel. Since oil is the main ingredient in gasoline, higher oil costs tend to put upward pressure on pump prices… Today’s national average of $3.24 is 26 cents less than a month ago and 26 cents less than a year ago.“
For more on energy prices, read: The other side of the surging oil price story 🛢
🛍️ Consumers are spending. According to BEA data, personal consumption expenditures increased 0.2% month over month in October to a record annual rate of $18.86 trillion.
Adjusted for inflation, real personal consumption expenditures also rose to a new record.
For more on what’s driving spending, read: People have money 💵
🛍️ Holiday shopping season is off to a strong start. From BofA: “Card spending per household (HH), as measured by BAC aggregated credit and debit cards, was up 2.3% on Black Friday (November 24), compared to the Black Friday in 2022.“
This is in line with other data from private firms showing Black Friday and Cyber Monday spending rising to record levels.
For more, read: People are spending 🛍️
🍝 Restaurant spending is cooling. From Apollo Global’s Torsten Slok: “Indicators of restaurant activity continue to show signs of weakness, see chart below. This is not surprising. The Fed is trying to slow down the economy, and weakness is now starting to appear in consumer services.“
For more on what the Fed’s been trying to do, read: A big misconception about the Fed's fight to bring down inflation 🙃
✈️ Air travel’s busiest day. From the TSA: “Yesterday (Nov. 26), TSA screened just over 2.9M individuals at airports nationwide, which represents an agency record – the busiest day ever for air travel.“
💼 Unemployment claims rise. Initial claims for unemployment benefits increased to 218,000 during the week ending November 25, up from 209,000 the week prior. While this is up from a September 2022 low of 182,000, it continues to trend at levels associated with economic growth.
For more on the labor market, read: The hot but cooling labor market in 16 charts 📊🔥🧊
👍 Consumer confidence improves. On Tuesday, we learned The Conference Board’s Consumer Confidence Index increased in November. From the firm’s Dana Peterson: “General improvements were seen across the spectrum of income groups surveyed in November. Nonetheless, write-in responses revealed consumers remain preoccupied with rising prices in general, followed by war/conflicts and higher interest rates… Assessments of the present situation ticked down in November, driven by less optimistic views on current job availability, which outweighed slightly improved views on the state of business conditions.“
Meanwhile, “Consumers’ assessment of their Family’s Current Financial Situation improved in November.“
And, “Consumers’ assessment of their Family’s Expected Financial Situation, Six Months Hence was also more optimistic in November.“
For more on consumer finances, read: People have money 💵
👎 Labor market confidence improves slightly but trend reflects cooling. From The Conference Board’s September Consumer Confidence survey: “39.3% of consumers said jobs were ‘plentiful,’ up slightly from 37.9% in October. However, 15.4% of consumers said jobs were ‘hard to get,’ up from 14.1%.“
Many economists monitor the spread between these two percentages (a.k.a., the labor market differential), and it’s been reflecting a cooling labor market.
For more on the labor market, read: The hot but cooling labor market in 16 charts 📊🔥🧊
🤷🏻♂️ Americans’ sentiment is detached from reality. From the FT: “Americans are consistently wrong in the negative direction on almost every measure we polled. By huge margins, they believe inflation is still rising (it’s falling), that it has outstripped wage growth (wages have outpaced prices), and that they have become less wealthy (they’ve become much wealthier)… My advice: if you want to know what Americans really think of economic conditions, look at their spending patterns. Unlike cautious Europeans, US consumers are back on the pre-pandemic trendline and buying more stuff than ever.“
For more on this disconnect, read: A bullish contradiction 🛍
📈 Mortgage rates decline. According to Freddie Mac, the average 30-year fixed-rate mortgage fell to 7.22%. From Freddie Mac: “The current trajectory of rates is an encouraging development for potential homebuyers, with purchase application activity recently rising to the same level as mid-September when rates were similar to today’s levels. The modest uptick in demand over the last month signals that there will likely be more competition in a market that remains starved for inventory.”
🏠 Home prices rise. According to the S&P CoreLogic Case-Shiller index, home prices rose 0.3% month-over-month in September. From SPDJI’s Craig Lazzara: “On a year-to-date basis, the National Composite has risen 6.1%, which is well above the median full calendar year increase in more than 35 years of data. Although this year's increase in mortgage rates has surely suppressed the quantity of homes sold, the relative shortage of inventory for sale has been a solid support for prices. Unless higher rates or exogenous events lead to general economic weakness, the breadth and strength of this month's report are consistent with an optimistic view of future results.“
For more on mortgages and home prices, read: Why home prices and rents are creating all sorts of confusion about inflation 😖
🏘️ New home sales fall. Sales of newly built homes fell 5.6% in October to an annualized rate of 679,000 units.
For more, read: The U.S. housing market has gone cold 🥶
📈 Profit margins were up in Q3. From Schwab’s Liz Ann Sonders: “Corporate profit margins rebounded in 3Q23, helping reverse some of past year’s decline.“
For more on profit margins, read: A bullish earnings story is brewing 📈
🏭 Manufacturing surveys don’t look good. From S&P Global’s November Manufacturing PMI report: “U.S. manufacturers reported yet another tough month in November. Output barely rose as inflows of new work showed a renewed decline, hinting at little – if any – contribution to fourth quarter GDP from the goods-producing sector.”
Similarly, the ISM’s July Manufacturing PMI signaled contraction in the sector for the 13th consecutive month.
These unfavorable survey results continue to come as hard broad measures of the economy continue to hold up.
It’s worth remembering that soft data like the PMI surveys don’t necessarily reflect what’s actually going on in the economy.
For more on this, read: What businesses do > what businesses say 🙊
🏭 Manufacturing construction is booming. Construction spending data from the Census Bureau suggests the state of manufacturing is much stronger than implied by the soft survey data.
📈 Near-term GDP growth estimates are cooling. The Atlanta Fed’s GDPNow model sees real GDP growth climbing at a 1.2% rate in Q4.
For more on the forces bolstering economic growth, read: 9 reasons to be optimistic about the economy and markets 💪
Putting it all together 🤔
We continue to get evidence that we could see a bullish “Goldilocks” soft landing scenario where inflation cools to manageable levels without the economy having to sink into recession.
This comes as the Federal Reserve continues to employ very tight monetary policy in its ongoing effort to bring inflation down. While it’s true that the Fed has taken a less hawkish tone in 2023 than in 2022, and that most economists agree that the final interest rate hike of the cycle has either already happened or is near, inflation still has to cool more and stay cool for a little while before the central bank is comfortable with price stability.
So we should expect the central bank to keep monetary policy tight, which means we should be prepared for tight financial conditions (e.g., higher interest rates, tighter lending standards, and lower stock valuations) to linger. All this means monetary policy will be unfriendly to markets for the time being, and the risk the economy slips into a recession will be relatively elevated.
At the same time, we also know that stocks are discounting mechanisms — meaning that prices will have bottomed before the Fed signals a major dovish turn in monetary policy.
Also, it’s important to remember that while recession risks may be elevated, consumers are coming from a very strong financial position. Unemployed people are getting jobs, and those with jobs are getting raises.
Similarly, business finances are healthy as many corporations locked in low interest rates on their debt in recent years. Even as the threat of higher debt servicing costs looms, elevated profit margins give corporations room to absorb higher costs.
At this point, any downturn is unlikely to turn into economic calamity given that the financial health of consumers and businesses remains very strong.
And as always, long-term investors should remember that recessions and bear markets are just part of the deal when you enter the stock market with the aim of generating long-term returns. While markets have had a pretty rough couple of years, the long-run outlook for stocks remains positive.
For more on how the macro story is evolving, check out the the previous TKer macro crosscurrents »
TKer’s best insights about the stock market 📈
Here’s a roundup of some of TKer’s most talked-about paid and free newsletters about the stock market. All of the headlines are hyperlinked to the archived pieces.
10 truths about the stock market 📈
The stock market can be an intimidating place: It’s real money on the line, there’s an overwhelming amount of information, and people have lost fortunes in it very quickly. But it’s also a place where thoughtful investors have long accumulated a lot of wealth. The primary difference between those two outlooks is related to misconceptions about the stock market that can lead people to make poor investment decisions.
The makeup of the S&P 500 is constantly changing 🔀
Passive investing is a concept usually associated with buying and holding a fund that tracks an index. And no passive investment strategy has attracted as much attention as buying an S&P 500 index fund. However, the S&P 500 — an index of 500 of the largest U.S. companies — is anything but a static set of 500 stocks.
The key driver of stock prices: Earnings💰
For investors, anything you can ever learn about a company matters only if it also tells you something about earnings. That’s because long-term moves in a stock can ultimately be explained by the underlying company’s earnings, expectations for earnings, and uncertainty about those expectations for earnings. Over time, the relationship between stock prices and earnings have a very tight statistical relationship.
Stomach-churning stock market sell-offs are normal🎢
Investors should always be mentally prepared for some big sell-offs in the stock market. It’s part of the deal when you invest in an asset class that is sensitive to the constant flow of good and bad news. Since 1950, the S&P 500 has seen an average annual max drawdown (i.e., the biggest intra-year sell-off) of 14%.
High and rising interest rates don't spell doom for stocks👍
Generally speaking, rising interest rates are not welcome news for the economy and the stock market. They represent higher financing costs for businesses and consumers. All other things being equal, rising rates represent a hindrance to growth. However, the world is complicated, and this narrative comes with a lot of nuance. One big counterintuitive piece to this narrative is that historically, stocks have actually performed well during periods of rising interest rates.
How stocks performed when the yield curve inverted ⚠️
There’ve been lots of talk about the “yield curve inversion,” with media outlets playing up that this bond market phenomenon may be signaling a recession. Admittedly, yield curve inversions have a pretty good track record of being followed by recessions, and recessions usually come with significant market sell-offs. But experts also caution against concluding that inverted yield curves are bulletproof leading indicators.
How the stock market performed around recessions 📉📈
Every recession in history was different. And the range of stock performance around them varied greatly. There are two things worth noting. First, recessions have always been accompanied by a significant drawdown in stock prices. Second, the stock market bottomed and inflected upward long before recessions ended.
In the stock market, time pays ⏳
Since 1928, the S&P 500 generated a positive total return more than 89% of the time over all five-year periods. Those are pretty good odds. When you extend the timeframe to 20 years, you’ll see that there’s never been a period where the S&P 500 didn’t generate a positive return.
What a strong dollar means for stocks 👑
While a strong dollar may be great news for Americans vacationing abroad and U.S. businesses importing goods from overseas, it’s a headwind for multinational U.S.-based corporations doing business in non-U.S. markets.
Economy ≠ Stock Market 🤷♂️
The stock market sorta reflects the economy. But also, not really. The S&P 500 is more about the manufacture and sale of goods. U.S. GDP is more about providing services.
Stanley Druckenmiller's No. 1 piece of advice for novice investors 🧐
…you don't want to buy them when earnings are great, because what are they doing when their earnings are great? They go out and expand capacity. Three or four years later, there's overcapacity and they're losing money. What about when they're losing money? Well, then they’ve stopped building capacity. So three or four years later, capacity will have shrunk and their profit margins will be way up. So, you always have to sort of imagine the world the way it's going to be in 18 to 24 months as opposed to now. If you buy it now, you're buying into every single fad every single moment. Whereas if you envision the future, you're trying to imagine how that might be reflected differently in security prices.
Peter Lynch made a remarkably prescient market observation in 1994 🎯
Some event will come out of left field, and the market will go down, or the market will go up. Volatility will occur. Markets will continue to have these ups and downs. … Basic corporate profits have grown about 8% a year historically. So, corporate profits double about every nine years. The stock market ought to double about every nine years… The next 500 points, the next 600 points — I don’t know which way they’ll go… They’ll double again in eight or nine years after that. Because profits go up 8% a year, and stocks will follow. That's all there is to it.
Warren Buffett's 'fourth law of motion' 📉
Long ago, Sir Isaac Newton gave us three laws of motion, which were the work of genius. But Sir Isaac’s talents didn’t extend to investing: He lost a bundle in the South Sea Bubble, explaining later, “I can calculate the movement of the stars, but not the madness of men.” If he had not been traumatized by this loss, Sir Isaac might well have gone on to discover the Fourth Law of Motion: For investors as a whole, returns decrease as motion increases.
Most pros can’t beat the market 🥊
According to S&P Dow Jones Indices (SPDJI), 59.7% of U.S. large-cap equity fund managers underperformed the S&P 500 during the first half of 2023. As you stretch the time horizon, the numbers get more dismal. Over a three-year period, 79.8% underperformed. Over a 10-year period, 85.6% underperformed. And over a 20-year period, 93.6% underperformed.
The sobering stats behind 'past performance is no guarantee of future results' 📊
S&P Dow Jones Indices found that funds beat their benchmark in a given year are rarely able to continue outperforming in subsequent years. For example, 318 large-cap equity funds were in the top half of performance in 2020. Of those funds, 39% came in the top half again in 2021, and just 5% were able to extend that streak through 2022. If you set the bar even higher and consider those in the top quartile of performance, just 7% of 156 large-cap funds remained in the top quartile in 2021. No large-cap funds were able to stay in the top quartile for the three consecutive years ending in 2022.
The odds are stacked against stock pickers 🎲
Picking stocks in an attempt to beat market averages is an incredibly challenging and sometimes money-losing effort. In fact, most professional stock pickers aren’t able to do this on a consistent basis. One of the reasons for this is that most stocks don’t deliver above-average returns. According to S&P Dow Jones Indices, only 24% of the stocks in the S&P 500 outperformed the average stock’s return from 2000 to 2022. Over this period, the average return on an S&P 500 stock was 390%, while the median stock rose by just 93%.
This is one of my favorite posts you make every year. Thank you, Sam, for aggregating this -- and adding much needed context!