
17 stock market charts that caught my eye 🧐
Beneath the surface of the S&P 500 📊


Every week, I thumb through a few hundred research reports from Wall Street analysts. I also read a ton of brilliant blogs. And every now and then, I see some good tweets. This has been the case for the past decade or so.
This means I see a lot of charts, stats, and insights, many of which you see curated in TKer.
Unfortunately, I just don’t have the capacity to write about all of them.
So today I’m dumping a bunch of charts into one big newsletter. It consists of stuff I came across over the past few weeks. Many are updates to charts I’ve cited in the past. You might notice there’s not much technical analysis here. I’m classically trained in fundamental analysis.
By the way, if you find chart roundups like this valuable, let me know at sam@tker.co. Maybe I’ll make this more of a regular thing.
Without further ado:
Corporations are holding more long-term, fixed-rate debt
That average maturity of bonds issued by S&P 500 companies is 11 years today, according to Bank of America’s Savita Subramanian. This compares to seven years in Q4 2007. This suggests companies are less sensitive to short-term fluctuations in interest rates.

For more on the debt load of Corporate America, read: Why consumers and businesses will prevent any slowdown from becoming economic calamity 💰
Servicing that debt isn’t as hard as it used to be
Since the global financial crisis, S&P 500 companies spent a lot of time and effort beefing up their balance sheets. As this chart from Credit Suisse’s Jonathan Golub shows, interest expense as a percentage of sales is very low today.
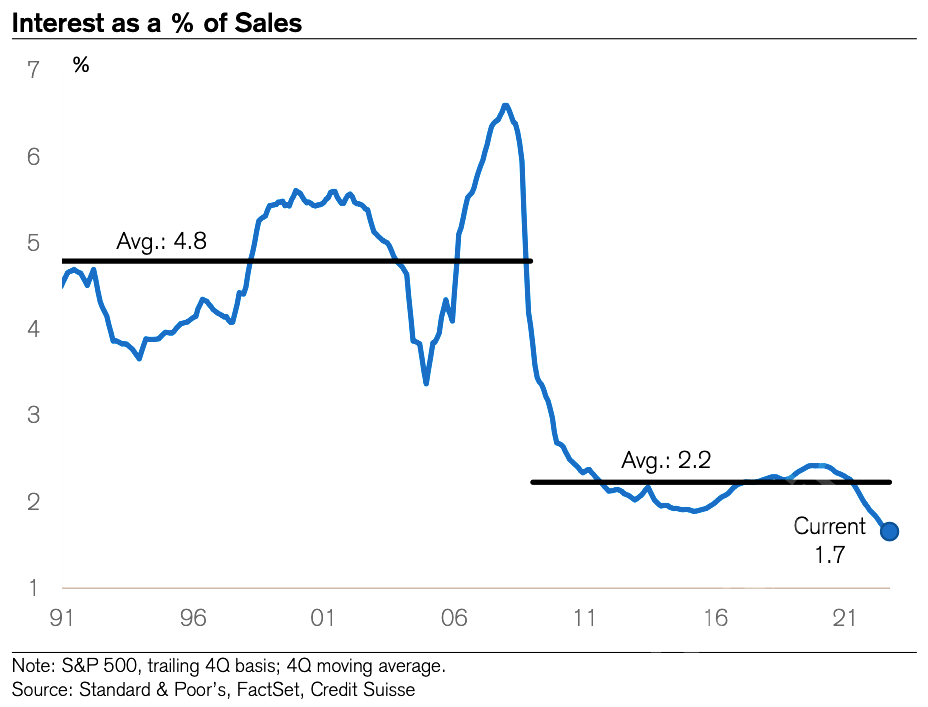
For more on servicing debt, read: Why repaying $500 can be harder than repaying $1,000 🤔
The cost structure of companies isn’t what it used to be
The way businesses operate has evolved over time. As this chart from Goldman Sachs’ David Kostin shows, the cost of goods sold used to be much larger as a percentage of sales.

Kostin put a spotlight on selling, general & administrative expenses (SG&A) as a percentage of sales, which has been coming down in recent years.

It’s also worth noting that net income as a percentage of sales (i.e., the net profit margin) is much higher today than it used to be.

For more on profit margins, read: Are 'gravity-defying' profit margins finally coming to an end? 💸
Contracting profit margins don’t guarantee lower profits
As Kostin’s chart above shows, the consensus forecast is for profit margins to contract in 2023. However, as this next chart from BMO Capital Markets’ Brian Belski shows, “annual periods of S&P 500 profit margin compression do not necessarily coincide with steep declines in earnings.“

For more on the outlook for profits, read: A simple explanation for why the stock market isn't doing worse 📈
