One of the most misunderstood moments in stock market cycles ⏱️
Plus a charted review of the macro crosscurrents 🔀
📉 The stock market fell, with the S&P 500 shedding 2.3% last week to close at 5,638.94. It’s now down 9.2% from its February 19 closing high of 6144.15 and up 57.6% from its October 12, 2022 closing low of 3,577.03. For more on market moves, read: Investing in the stock market is an unpleasant process 📉
-
The stock market is a discounting mechanism, which means its price reflects expectations for the future, and its price fluctuations reflect the market’s attempt to factor in changes to those expectations.
Believe it or not, in a given moment, the stock market does not care too much about the present state of things. That’s because expectations for the present will have been priced into the market days, weeks, and months in the past.
That is to say, the stock market reacts to news to the degree the new information 1) is not in line with what the market expected for the present, and 2) changes what the market expects for the future.
There are some more factors that drive stock prices over time. But in the context of digesting major news headlines, these are the two relationships to watch.
Because the stock market is so heavily dependent on expectations for the future, we inevitably get moments when stock market behavior appears to conflict with information about the present. Specifically, we sometimes get stock prices falling amid good news and rising amid bad news.
These are some of the most misunderstood moments in stock market cycles.
That time stocks surged as the economy crashed 🤯
One of the more dumbfounding instances of this counterintuitive dynamic came during the spring of 2020 when the economy was reeling from the COVID-19 pandemic lockdowns.
After a sharp 35% drop, the S&P 500 bottomed and inflected upward on March 23 that year.
But we continued to get disastrous economic reports for weeks as the stock market rallied.
This resulted in one of the defining screengrabs of the pandemic. It was from the April 9 episode of “Mad Money with Jim Cramer.” Cramer’s show highlighted how the stock market had its best week in decades while the chyron reported the cumulative three-week tally of unemployment insurance claims ballooned to 16 million.
People were confused.

Yes, the economy was in bad shape in April. But expectations were already extremely low, which meant the bar for developments that could cause stocks to go higher was also very low.
In retrospect, it seems the stock market got it right.
It wasn’t until June that we learned job creation resumed in May. And it wasn’t until July 2021 that we learned that the recession had ended in April 2020.
The stock market, for its part, recovered all of its pandemic losses and reached new record highs in August 2020. (So, if you had dumped stocks as the news was getting bad and you had waited for good news to get back in, then you might’ve actually missed out on considerable gains you could’ve earned by just holding through the crisis.)
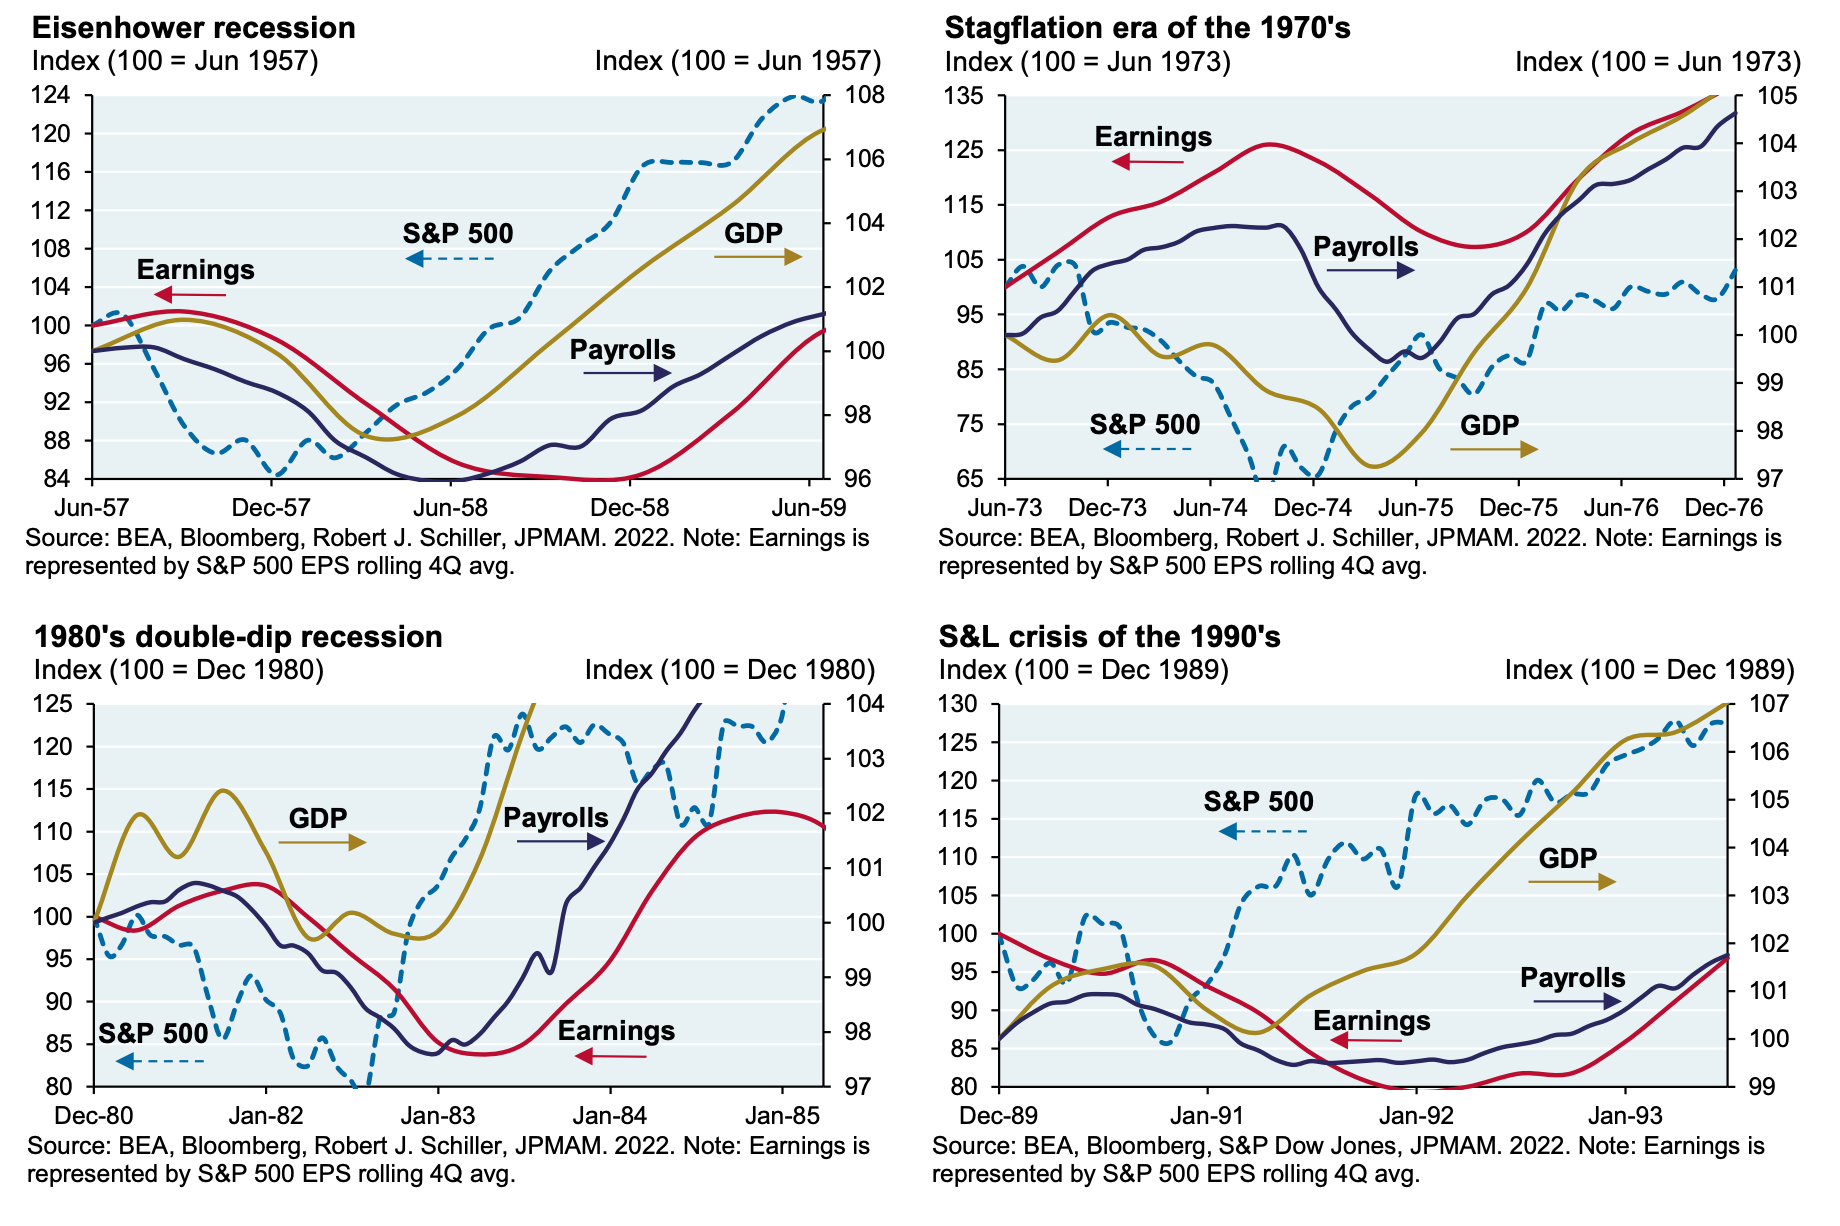
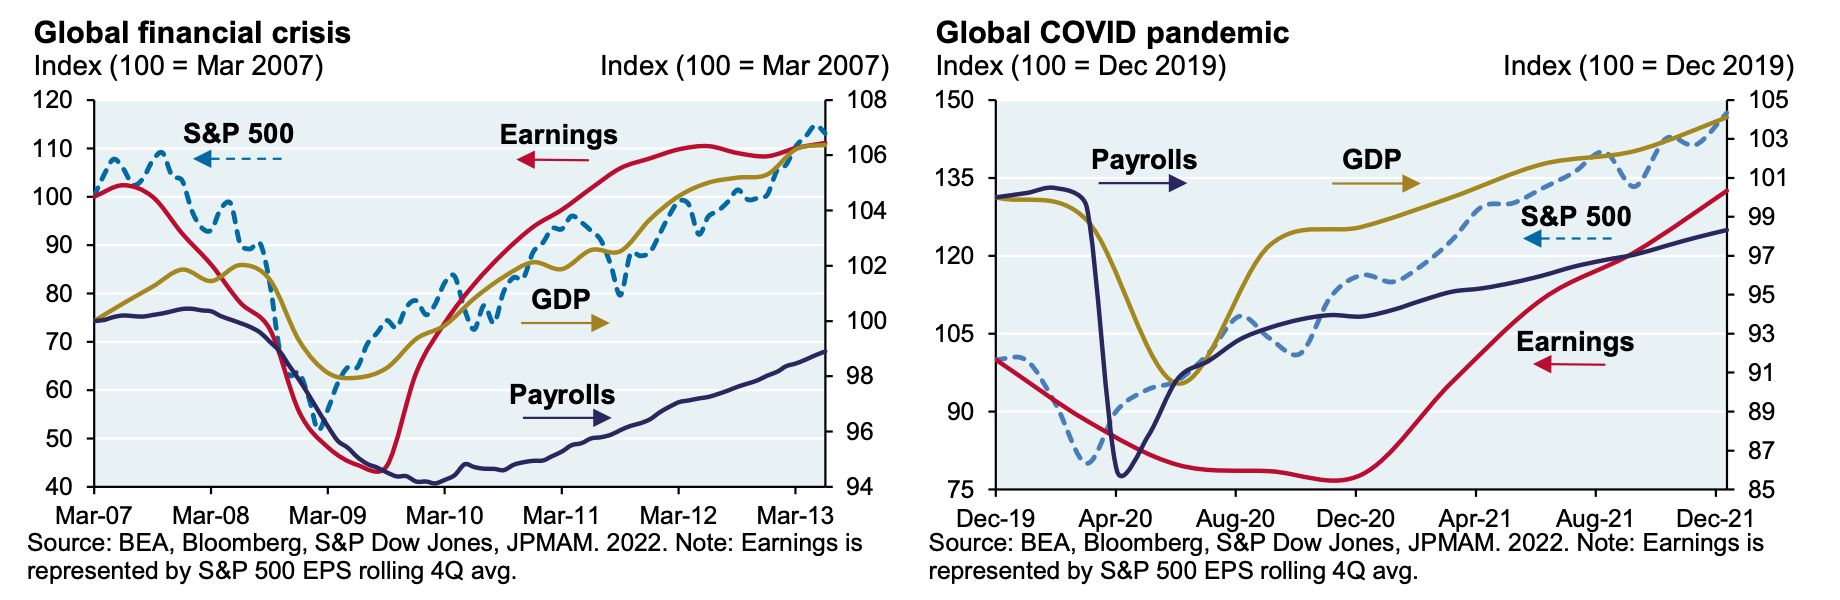
This was not just a pandemic recession phenomenon. The stock market usually begins its recovery long before the economy. JPMorgan’s Michael Cembalest reviewed the history in an October 2022 research note.
“There is a remarkable consistency to the patterns shown below: equities tend to bottom several months (at least) before the rest of the victims of a recession,” he wrote.
As you can see in Cembalest’s charts, stock prices (dotted blue line) tend to inflect upwards before we see improvements in earnings (red line), GDP (yellow line), and employment (purple line).

Historically, the stock market bottomed about five months before the economy. Sometimes the lead time is longer. Sometimes its shorter. On one extremely rare occasion — the Dotcom bubble — the market bottomed after the economy.
The economic news has been getting gloomier 👀
The U.S. economy has been cooling for a while as the major tailwinds early in the recovery normalized.
The good news had been that the economy was nevertheless still growing bolstered by consumers’ ability to spend and businesses’ willingness to invest.
While we might not necessarily be heading for recession, we could be in the midst of a “growth scare,” which has historically come with big stock market sell-offs followed by rapid rallies.
Growth scare-y anecdotes have been accumulating recently. Since the beginning of March:
Delta Airlines warned that their “outlook has been impacted by the recent reduction in consumer and corporate confidence caused by increased macro uncertainty.“
According to the NFIB’s February Small Business Optimism survey, capital spending plans tumbled to their lowest level since 2020.
From the NY Fed’s February Survey of Consumer Expectations: “Households expressed more pessimism about their year-ahead financial situations in February, while unemployment, delinquency, and credit access expectations deteriorated notably.“
From the University of Michigan’s March Survey of Consumers: “Consumer sentiment slid another 11% this month, with declines seen consistently across all groups by age, education, income, wealth, political affiliations, and geographic regions. …expectations for the future deteriorated across multiple facets of the economy, including personal finances, labor markets, inflation, business conditions, and stock markets.“
Wall Street firms, including Goldman Sachs, Morgan Stanley, and JPMorgan cut their GDP growth forecasts.
Even President Trump euphemistically warned that Americans could face “some disturbance” and a “period of transition” as his administration moves forward with costly tariffs. Treasury Secretary Bessent echoed the sentiment, warning of an economic “detox period.”
Because the stock market is a discounting mechanism, you could argue that the current drawdown that began on Feb. 19 was the market pricing in the bad news we’re getting now.
This again speaks to the quandary investors face as they think about making adjustments to their portfolios. The stock market does not price in what’s going on today. It’s pricing in what’s expected in the weeks, months, and years ahead.
And that future is uncertain. It could be worse than what we currently expect. It could be better.
No one can say for sure that the stock market hit its low for the year. However, we also shouldn’t be surprised if we soon experience a sustained rally as incoming news just confirm gloomy expectations that have already been priced into the market.
Zooming out 🔭
In hindsight, divergences in the stock market and the economy make sense. But in the moment, it often feels wrong.
What feels right is when the stock market falls as you get information that indicates the present and near future are deteriorating, and vice versa.
However, there is likely to be a moment where the stock market moves higher as it resumes pricing in a better future. And that moment is likely to happen when the economic headlines are bad.
It all speaks to the perils of trying to time the market.
Is it possible we learn that the economic situation proves far worse than what’s priced into the market today? Absolutely.
Can we guarantee that? Absolutely not.
-
Related from TKer:
Timely perspective from the paid TKer archives ⏳
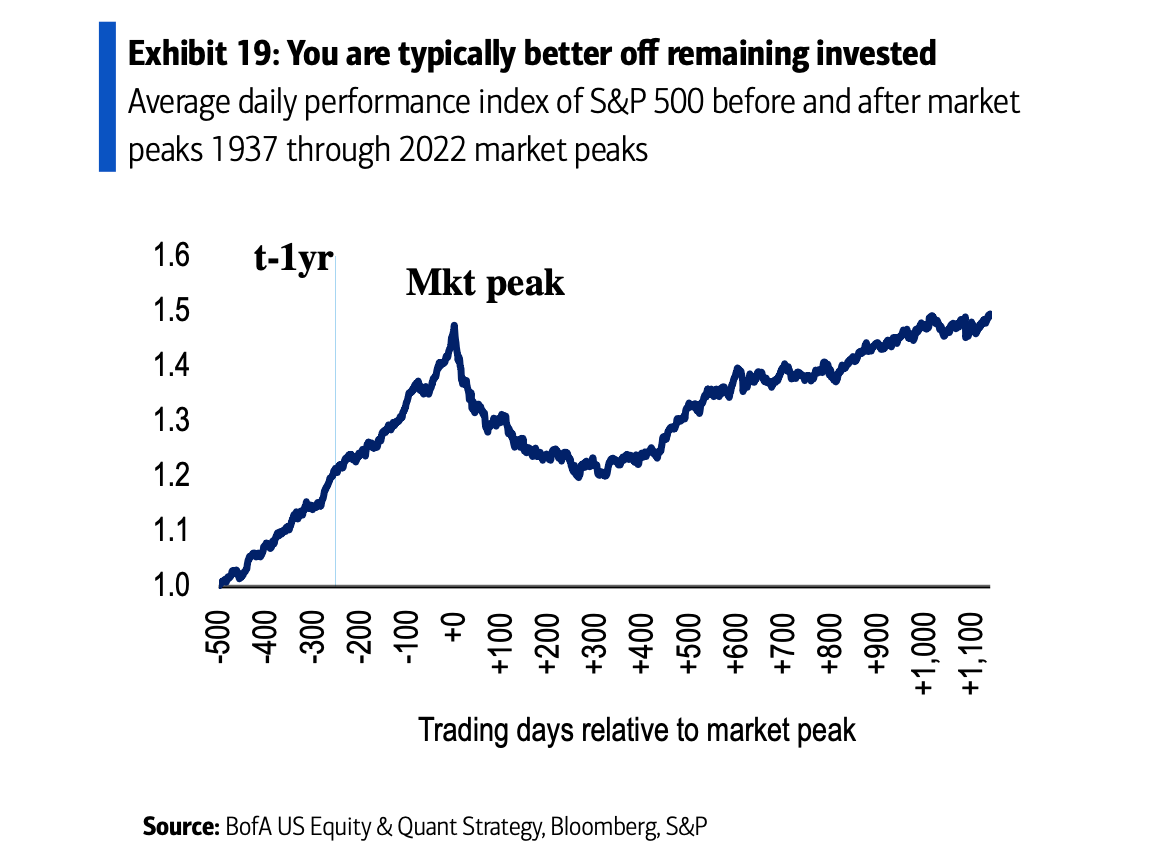
Why is it so treacherous to time market tops? Below is an excerpt from the July 9, 2024, TKer:
…Unfortunately, timing market tops is hard.
Sure, you may not have to pinpoint the exact top and subsequent bottom to improve your returns.
But you have to come pretty darn close.
BofA’s Savita Subramanian recently examined this question in a June note to clients (emphasis added):
Q: Is it better to sell early or late?
A: Neither. Remaining invested is generally superior to emotional selling. With perfect foresight, selling 1 to 3 months early would have protected investors as gains sacrificed were lower than losses over the subsequent 1 to 3 months. But the tradeoff neutralized at 6-months and skewed positive at 12m holding periods…
Keep in mind that if you are a long-term investor, timing the market comes with not one, but two trades. You have to sell what you believe is the top, and then you also have to know under what conditions you would buy back in…
Read the rest at: BofA: 'Q: Is it better to sell early or late? A: Neither.' ⏰
Review of the macro crosscurrents 🔀
There were several notable data points and macroeconomic developments since our last review:
👎 Consumer vibes tumble. From the University of Michigan’s March Surveys of Consumers: “Consumer sentiment slid another 11% this month, with declines seen consistently across all groups by age, education, income, wealth, political affiliations, and geographic regions. Sentiment has now fallen for three consecutive months and is currently down 22% from December 2024. While current economic conditions were little changed, expectations for the future deteriorated across multiple facets of the economy, including personal finances, labor markets, inflation, business conditions, and stock markets.“

Politics clearly plays a role in peoples’ perception of the economy:

Notably, expectations for inflation appear to be a partisan matter.

For more on the state of sentiment, read: The post-election sentiment sea change 🔃 and Beware how your politics distort how you perceive economic realities 😵💫
👎 Small business optimism falls. From the NFIB’s February Small Business Optimism Index report: “Uncertainty is high and rising on Main Street, and for many reasons. How future developments are resolved will shape the economy’s future. Confidence that the economy will continue to grow is fading.”

For more on the state of sentiment, read: The post-election sentiment sea change 🔃 and Beware how your politics distort how you perceive economic realities 😵💫
👍 Inflation cools. The Consumer Price Index (CPI) in February was up 2.8% from a year ago, down from the 3% rate in January. Adjusted for food and energy prices, core CPI was up 3.1%, down from the prior month’s 3.3% level.

On a month-over-month basis, CPI and core CPI were up 0.2%.

If you annualize the six-month trend in the monthly figures — a reflection of the short-term trend in prices — core CPI climbed 3.6%.

For more on inflation, read: The end of the inflation crisis 🎈and The Fed closes a chapter with a rate cut ✂️
👎 Inflation expectations deteriorate but remain cool. From the New York Fed’s February Survey of Consumer Expectations: “Median inflation expectations increased by 0.1 percentage point at the one-year horizon, to 3.1%, and were unchanged at the three-year and five-year horizons (both at 3.0%) in February. … Median inflation uncertainty — or the uncertainty expressed regarding future inflation outcomes — increased at all three horizons.”

The introduction of tariffs as proposed by president-elect Donald Trump would be inflationary. For more, read: 5 outstanding issues as President Trump threatens the world with tariffs 😬
⛽️ Gas prices tick lower. From AAA: “Despite increased demand, gas prices dipped lower this week, with today’s national average at $3.07 per gallon, about 3 cents lower than a week ago. This drop at the pump comes as many travelers gear up to hit the road for spring break and drivers may be surprised to find gas under $3 in 31 states.”

For more on energy prices, read: Higher oil prices meant something different in the past 🛢️
💳 Card spending data is holding up. From JPMorgan: “As of 07 Mar 2025, our Chase Consumer Card spending data (unadjusted) was 2.6% above the same day last year. Based on the Chase Consumer Card data through 07 Mar 2025, our estimate of the US Census February control measure of retail sales m/m is 0.20%.”
From BofA: “Total BAC card spending per HH was up 0.3% m/m in Feb. We forecast 0.0% & 0.2% for ex-auto & core control retail sales. Travel-related spending has been weak in the BAC card data this year. This is consistent with flat y/y airport traffic. We find evidence suggesting that DOGE cuts are weighing on spending in the DC area. However, the impact is localized for now.“
For more on the consumer, read: Americans have money, and they're spending it 🛍️
🏠 Mortgage rates tick higher. According to Freddie Mac, the average 30-year fixed-rate mortgage increased to 6.65% from 6.63% last week. From Freddie Mac: “Despite volatility in the markets, the 30-year fixed-rate mortgage remained essentially flat from last week. Mortgage rates continue to be relatively low versus the last few months, and homebuyers have responded. Purchase applications are up 5% as compared to a year ago. The combination of modestly lower mortgage rates and improving inventory is a positive sign for homebuyers in this critical spring homebuying season.”

There are 147 million housing units in the U.S., of which 86.6 million are owner-occupied and 34 million (or 40%) of which are mortgage-free. Of those carrying mortgage debt, almost all have fixed-rate mortgages, and most of those mortgages have rates that were locked in before rates surged from 2021 lows. All of this is to say: Most homeowners are not particularly sensitive to movements in home prices or mortgage rates.
For more on mortgages and home prices, read: Why home prices and rents are creating all sorts of confusion about inflation 😖
💼 Unemployment claims tick lower. Initial claims for unemployment benefits declined to 220,000 during the week ending March 8, down from 222,000 the week prior. This metric continues to be at levels historically associated with economic growth.

Federal layoffs brought by the Trump administration’s Department of Government Efficiency appear making their way into the data. Initial claims filed by federal employees came in at 1,580 in the week ending March 1.
For more context, read: A note about federal layoffs 🏛️ and The labor market is cooling 💼
💼 Job openings rise. According to the BLS’s Job Openings and Labor Turnover Survey, employers had 7.74 million job openings in January, up from 7.51 million in December.

During the period, there were 6.85 million unemployed people — meaning there were 1.1 job openings per unemployed person. This continues to be one of the more obvious signs of excess demand for labor. However, this metric has returned to prepandemic levels.

For more on job openings, read: Were there really twice as many job openings as unemployed people? 🤨 and Revisiting the key chart to watch amid the Fed's war on inflation 📈
👍 Layoffs remain depressed, hiring remains firm. Employers laid off 1.63 million people in January. While challenging for all those affected, this figure represents just 1% of total employment. This metric remains at prepandemic levels.

For more on layoffs, read: Every macro layoffs discussion should start with this key metric 📊
Hiring activity continues to be much higher than layoff activity. During the month, employers hired 5.39 million people.

That said, the hiring rate — the number of hires as a percentage of the employed workforce — has been trending lower, which could be a sign of trouble to come in the labor market.

For more on why this metric matters, read: The hiring situation 🧩
🤔 People are quitting less. In January, 3.27 million workers quit their jobs. This represents 21% of the workforce. While the rate ticked up last month, it continues to trend below prepandemic levels.

A low quits rate could mean a number of things: more people are satisfied with their job; workers have fewer outside job opportunities; wage growth is cooling; productivity will improve as fewer people are entering new unfamiliar roles.
For more, read: Promising signs for productivity ⚙️
🏢 Offices remain relatively empty. From Kastle Systems: “Peak day office occupancy was 63.4% on Tuesday last week, down six tenths of a point from the previous week. Philadelphia hit a post-pandemic record high of 53.6% on Tuesday, up nearly a full point from the previous week. The average low was on Friday at 36.4%, up 1.2 points from last week.”

For more on office occupancy, read: This stat about offices reminds us things are far from normal 🏢
Putting it all together 🤔
Earnings look bullish: The long-term outlook for the stock market remains favorable, bolstered by expectations for years of earnings growth. And earnings are the most important driver of stock prices.
Demand is positive: Demand for goods and services is positive, and the economy continues to grow. At the same time, economic growth has normalized from much hotter levels earlier in the cycle. The economy is less “coiled” these days as major tailwinds like excess job openings have faded.
But growth is cooling: The economy remains very healthy, supported by strong consumer and business balance sheets, though momentum is slowing. Overall, job creation remains positive, and the Federal Reserve — having resolved the inflation crisis — has shifted its focus toward supporting the labor market.
Actions speak louder than words: We are in an odd period given that the hard economic data has decoupled from the soft sentiment-oriented data. Consumer and business sentiment has been relatively poor, even as tangible consumer and business activity continue to grow and trend at record levels. From an investor’s perspective, what matters is that the hard economic data continues to hold up.
Stocks look better than the economy: Analysts expect the U.S. stock market could outperform the U.S. economy, thanks largely due to positive operating leverage. Since the pandemic, companies have adjusted their cost structures aggressively. This has come with strategic layoffs and investment in new equipment, including hardware powered by AI. These moves are resulting in positive operating leverage, which means a modest amount of sales growth — in the cooling economy — is translating to robust earnings growth.
Mind the ever-present risks: Of course, this does not mean we should get complacent. There will always be risks to worry about — such as U.S. political uncertainty, geopolitical turmoil, energy price volatility, cyber attacks, etc. There are also the dreaded unknowns. Any of these risks can flare up and spark short-term volatility in the markets.
Investing is never a smooth ride: There’s also the harsh reality that economic recessions and bear markets are developments that all long-term investors should expect to experience as they build wealth in the markets. Always keep your stock market seat belts fastened.
Think long term: For now, there’s no reason to believe there’ll be a challenge that the economy and the markets won’t be able to overcome over time. The long game remains undefeated, and it’s a streak long-term investors can expect to continue.
For more on how the macro story is evolving, check out the previous review of the macro crosscurrents »
Key insights about the stock market 📈
Here’s a roundup of some of TKer’s most talked-about paid and free newsletters about the stock market. All of the headlines are hyperlinked to the archived pieces.
10 truths about the stock market 📈
The stock market can be an intimidating place: It’s real money on the line, there’s an overwhelming amount of information, and people have lost fortunes in it very quickly. But it’s also a place where thoughtful investors have long accumulated a lot of wealth. The primary difference between those two outlooks is related to misconceptions about the stock market that can lead people to make poor investment decisions.
The makeup of the S&P 500 is constantly changing 🔀
Passive investing is a concept usually associated with buying and holding a fund that tracks an index. And no passive investment strategy has attracted as much attention as buying an S&P 500 index fund. However, the S&P 500 — an index of 500 of the largest U.S. companies — is anything but a static set of 500 stocks.

The key driver of stock prices: Earnings💰
For investors, anything you can ever learn about a company matters only if it also tells you something about earnings. That’s because long-term moves in a stock can ultimately be explained by the underlying company’s earnings, expectations for earnings, and uncertainty about those expectations for earnings. Over time, the relationship between stock prices and earnings have a very tight statistical relationship.

Stomach-churning stock market sell-offs are normal🎢
Investors should always be mentally prepared for some big sell-offs in the stock market. It’s part of the deal when you invest in an asset class that is sensitive to the constant flow of good and bad news. Since 1950, the S&P 500 has seen an average annual max drawdown (i.e., the biggest intra-year sell-off) of 14%.

High and rising interest rates don't spell doom for stocks👍
Generally speaking, rising interest rates are not welcome news for the economy and the stock market. They represent higher financing costs for businesses and consumers. All other things being equal, rising rates represent a hindrance to growth. However, the world is complicated, and this narrative comes with a lot of nuance. One big counterintuitive piece to this narrative is that historically, stocks have actually performed well during periods of rising interest rates.

How the stock market performed around recessions 📉📈
Every recession in history was different. And the range of stock performance around them varied greatly. There are two things worth noting. First, recessions have always been accompanied by a significant drawdown in stock prices. Second, the stock market bottomed and inflected upward long before recessions ended.

In the stock market, time pays ⏳
Since 1928, the S&P 500 generated a positive total return more than 89% of the time over all five-year periods. Those are pretty good odds. When you extend the timeframe to 20 years, you’ll see that there’s never been a period where the S&P 500 didn’t generate a positive return.

What a strong dollar means for stocks 👑
While a strong dollar may be great news for Americans vacationing abroad and U.S. businesses importing goods from overseas, it’s a headwind for multinational U.S.-based corporations doing business in non-U.S. markets.

Economy ≠ Stock Market 🤷♂️
The stock market sorta reflects the economy. But also, not really. The S&P 500 is more about the manufacture and sale of goods. U.S. GDP is more about providing services.

Stanley Druckenmiller's No. 1 piece of advice for novice investors 🧐
…you don't want to buy them when earnings are great, because what are they doing when their earnings are great? They go out and expand capacity. Three or four years later, there's overcapacity and they're losing money. What about when they're losing money? Well, then they’ve stopped building capacity. So three or four years later, capacity will have shrunk and their profit margins will be way up. So, you always have to sort of imagine the world the way it's going to be in 18 to 24 months as opposed to now. If you buy it now, you're buying into every single fad every single moment. Whereas if you envision the future, you're trying to imagine how that might be reflected differently in security prices.
Peter Lynch made a remarkably prescient market observation in 1994 🎯
Some event will come out of left field, and the market will go down, or the market will go up. Volatility will occur. Markets will continue to have these ups and downs. … Basic corporate profits have grown about 8% a year historically. So, corporate profits double about every nine years. The stock market ought to double about every nine years… The next 500 points, the next 600 points — I don’t know which way they’ll go… They’ll double again in eight or nine years after that. Because profits go up 8% a year, and stocks will follow. That's all there is to it.
Warren Buffett's 'fourth law of motion' 📉
Long ago, Sir Isaac Newton gave us three laws of motion, which were the work of genius. But Sir Isaac’s talents didn’t extend to investing: He lost a bundle in the South Sea Bubble, explaining later, “I can calculate the movement of the stars, but not the madness of men.” If he had not been traumatized by this loss, Sir Isaac might well have gone on to discover the Fourth Law of Motion: For investors as a whole, returns decrease as motion increases.
Most pros can’t beat the market 🥊
According to S&P Dow Jones Indices (SPDJI), 65% of U.S. large-cap equity fund managers underperformed the S&P 500 in 2024. As you stretch the time horizon, the numbers get even more dismal. Over a three-year period, 85% underperformed. Over a 10-year period, 90% underperformed. And over a 20-year period, 92% underperformed. This 2023 performance follows 14 consecutive years in which the majority of fund managers in this category have lagged the index.

Proof that 'past performance is no guarantee of future results' 📊
S&P Dow Jones Indices found that funds beat their benchmark in a given year are rarely able to continue outperforming in subsequent years. For example, 334 large-cap equity funds were in the top half of performance in 2021. Of those funds, 58.7% came in the top half again in 2022. But just 6.9% were able to extend that streak through 2023. If you set the bar even higher and consider those in the top quartile of performance, just 20.1% of 164 large-cap funds remained in the top quartile in 2022. No large-cap funds were able to stay in the top quartile for the three consecutive years ending in 2023.

The odds are stacked against stock pickers 🎲
Picking stocks in an attempt to beat market averages is an incredibly challenging and sometimes money-losing effort. In fact, most professional stock pickers aren’t able to do this on a consistent basis. One of the reasons for this is that most stocks don’t deliver above-average returns. According to S&P Dow Jones Indices, only 24% of the stocks in the S&P 500 outperformed the average stock’s return from 2000 to 2022. Over this period, the average return on an S&P 500 stock was 390%, while the median stock rose by just 93%.

I distinctly remember considering dabbling in some market timing during the early Covid days of 2020. I remember watching the market continue to trade around ATH into mid-February of 2020, while I had been convinced for at least 2 weeks that the pandemic would not be contained to China and would eventually spread globally. I was constantly second guessing myself: "What has already been priced in?" "Do people really not expect this to be a major event?" "Am I getting bad information?" "Am I just overreacting because I'm more concerned about this than others?"
I ended up concluding that I was, in fact, overreacting, and held through the (extremely short) crash/recovery cycle.
The market can often feel like it's gaslighting you if you correctly anticipate a major event. But it is more likely to humble you, because there's always something to worry about, and most things that might feel scary to you end up having very little effect on the market.