
The unluckiest market timer I know made another poorly timed trade 🤦🏻♂️
Plus a charted review of the macro crosscurrents 🔀


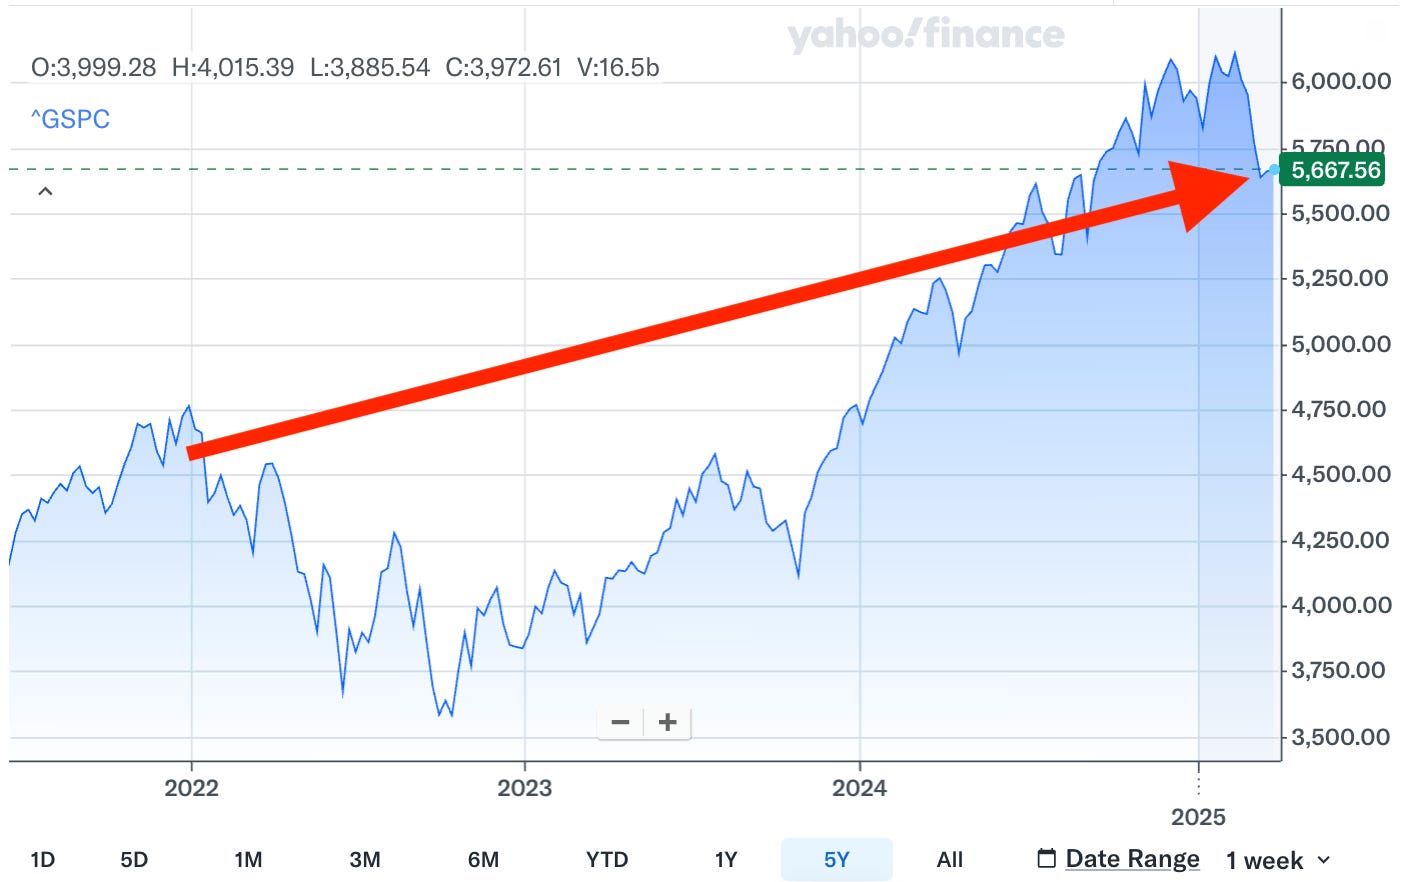
📈 The stock market climbed, with the S&P 500 rising 0.5% last week to close at 5,667.56. It’s now down 7.7% from its February 19 closing high of 6,144.15 and up 58.4% from its October 12, 2022 closing low of 3,577.03. For more on market moves, read: Investing in the stock market is an unpleasant process 📉
-
Like most people who invest in the stock market, I too get nervous when prices are going down. When the selling gets protracted, muscle knots sometimes form in my neck and upper back.
To cope, I do my best to remember that history teaches us big sell-offs are what stock market investing is all about, and that the path to long-term riches in the stock market is riddled with stomach-churning volatility. And importantly, “time in the market beats timing the market.”
With that said, let me tell you about a recent personal experience that confirmed to me that I’m the unluckiest market timer I know.
I bought the top, again 🤦🏻♂️
I consider myself lucky in many ways — except when it comes to timing the stock market.
To be clear, I do not trade actively much at all. But on rare occasions outside of regular periodic contributions to my retirement accounts, I’ve had the good fortune of having some extra cash to put to work.
I recently had one of those occasions.
On Feb. 13, I met with my accountant to do my 2024 tax returns. I learned I had some room to lower my taxable income. And one of the actions I took was contributing more to my self-employed 401(k) plan.
Wasting no time, I transferred cash to that account. And on Feb. 18, I added to my S&P 500 index fund position. The trade confirmation came in on Feb. 19.
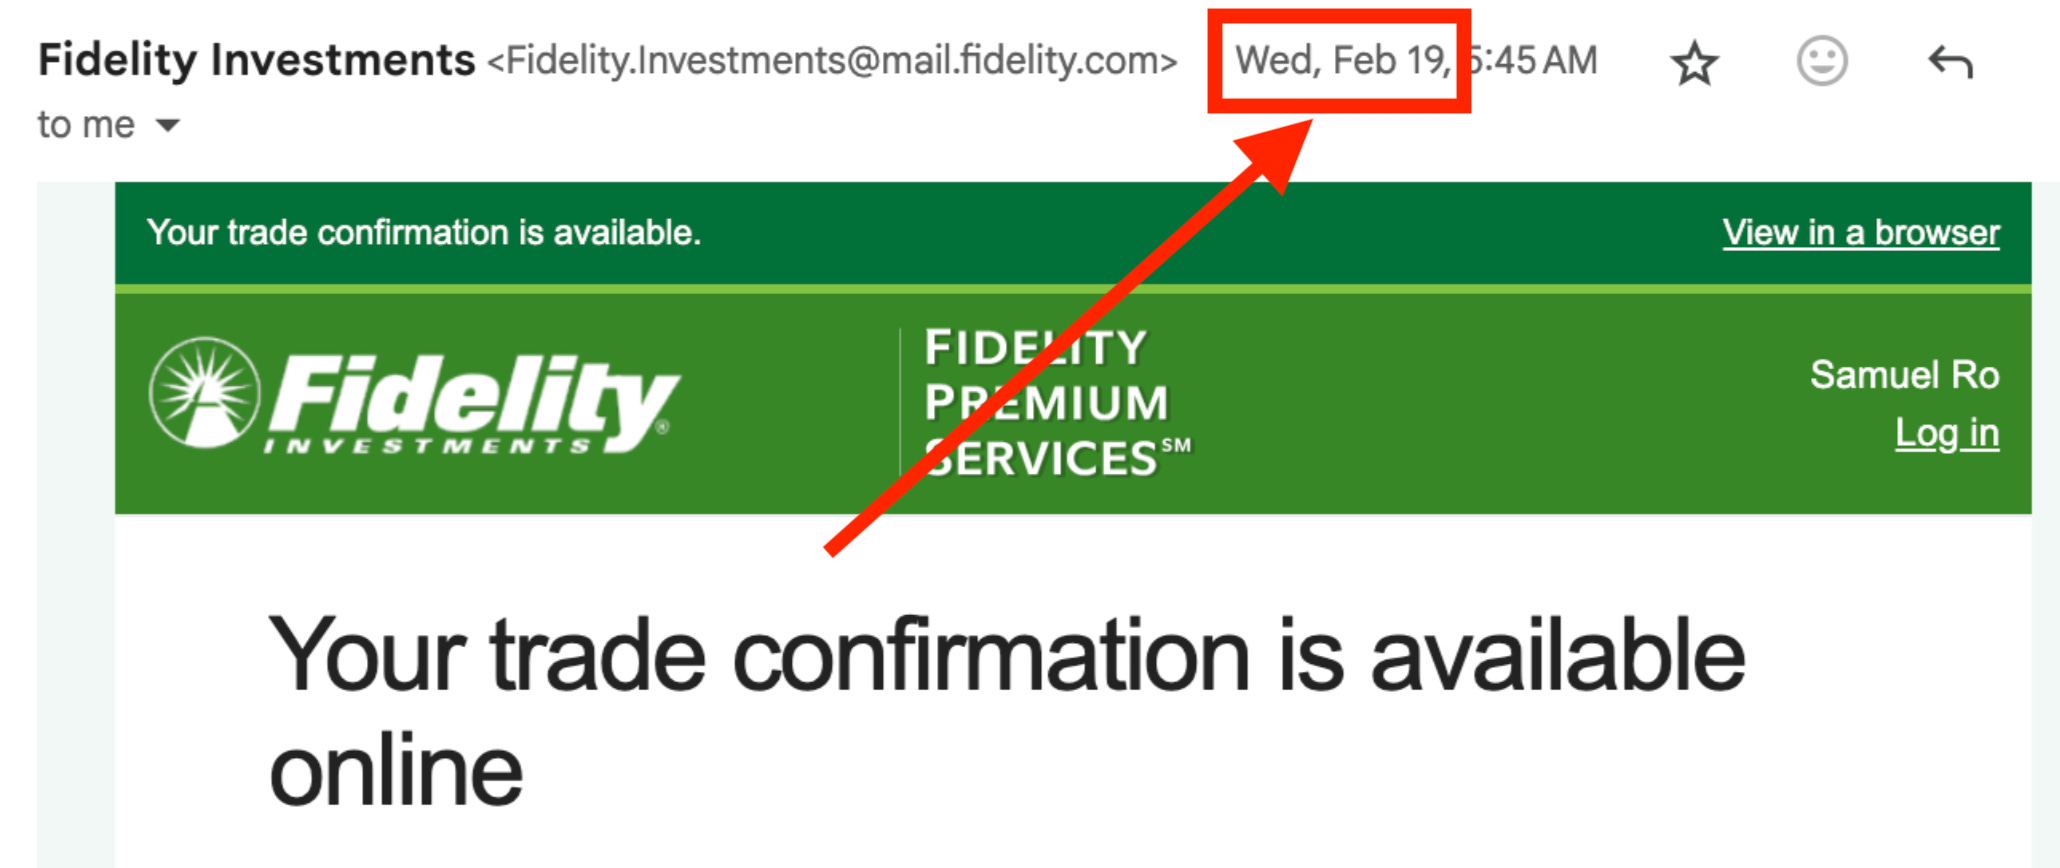
Coincidentally, Feb. 19 was when the S&P 500 last touched a record high before rapidly tumbling into the correction we are living today.

This was not a small amount of money I put to work.
Was it poorly timed? Yes.
Was it a mistake? No.
You’re probably thinking that I should’ve dollar-cost-averaged into the market.
I actually already engage in dollar-cost averaging because of the way my income comes in. But on these unusual occasions, I prefer to make lump sum purchases. I still have 20-30 years until retirement, so I’m not much of a “cash on the sidelines” kind of guy. Also, I’ve read Nick Maggiulli’s piece “Dollar Cost Averaging vs Lump Sum,“ so I understand the kind of risk I’m taking.
I signed up for this.
And now I’m living TKer Stock Market Truth No. 2: You can get smoked in the short-term.
Time is the unlucky market timer’s best friend ⏱️
This is not the first time I found myself with some cash to put to work.
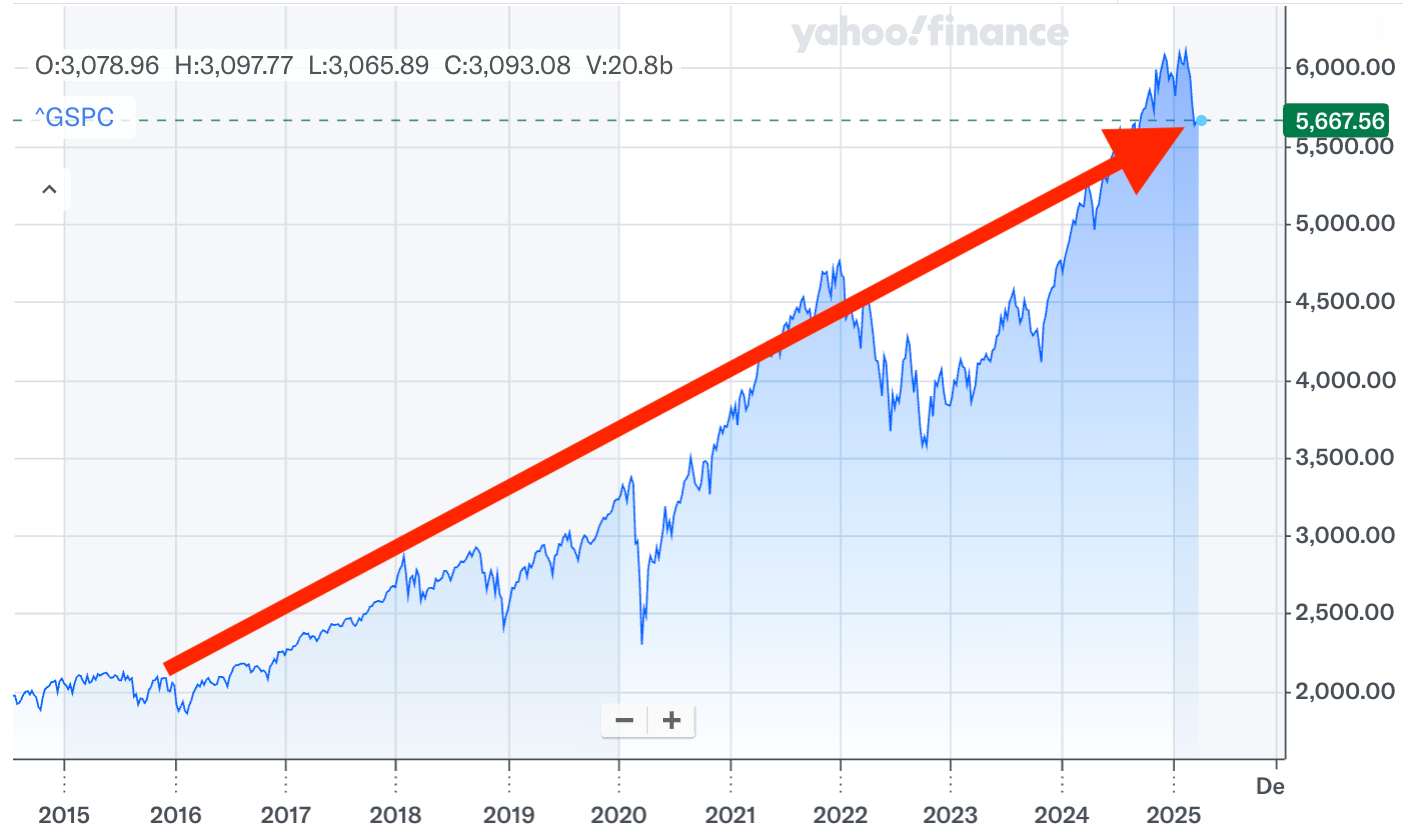
As I wrote in the March 6, 2022 TKer, I faced similar situations in late 2015 and late 2021. Both times, I made lump sum purchases into S&P 500 index funds.
And both times, those purchases were almost immediately followed by steep sell-offs.
The 2015 purchase happened while the S&P was on the precipice of a 14% correction. The 2021 purchases happened right as the market was entering a bear market, which saw the S&P fall 25% before bottoming in October 2022.
I am literally the unluckiest market timer I know.
Fortunately, my full-time job is researching the data and writing about having exposure to stocks during the market’s ups and downs. It’s helped me keep my investment decisions very informed.
I also have a carefully thought-out personalized financial strategy that takes into account the risk of big drawdowns. Importantly, I have a time horizon that allows me to ride out the downturns as I build wealth for the long run.
Thanks to having good financial information and a good financial plan, I held on.
And today, those older very poorly timed trades are in the black, and they’re helping me get closer to achieving my long-term financial goals.
The S&P 500 is up about 170% since my late 2015 purchase.
And it’s up about 20% since my late 2021 and early 2022 purchases.
As Bespoke’s Paul Hickey says: “Time heals in the markets.“
Timing the market like Warren Buffett 👯♀️
Like billionaire investor Warren Buffett, I don’t claim to be good at timing the stock market. (Buffett receives praise for writing a widely circulated op-ed titled “Buy American” during the global financial crisis. Though, he published it in Oct. 2008 before the S&P fell another 26%.)
Fortunately, you don’t have to be a good market timer to be a successful investor. You just have to be able to put in the time.
Investing in the stock market will continue to be an unpleasant process as we cope with two conflicting realities: In the long-run, the stock market usually goes up; but in the short-run, anything and everything can go very badly.
As you do your best to keep your emotions in check, I suggest you remember the lessons from history. You can read all about them in TKer’s archives.
-
Related from TKer:
No amount of risk management prepares you for when Sam Ro’s apartment gets flooded 🚣🏻
A time-tested way to buy stocks when the market is tumbling 📉
It's OK to have emotions — just don't let them near your stock portfolio 📉
Timely perspective from the paid TKer archives ⏳
The stock market will test an investor’s mettle. Below is an excerpt from the January 23, 2022, TKer:
…Investing in the stock market is a challenging mental exercise.
Among other things, investors have to cope with two seemingly conflicting realities: In the long-run, things almost always work out for the better; but in the short-run, anything and everything can go very badly.
In an environment where news headlines seem overwhelmingly alarming, I think it’s helpful for investors to see what history says about the market implications of comparable events. And as you’ll read on TKer, there’s nothing that the stock market couldn’t overcome given enough time.
HOWEVER, it can’t be reiterated enough that 5% pullbacks and 10% corrections happen more often than not in any given year. Bear markets, where stocks fall by more than 20% from their highs, are less frequent, but they are something that long-term investors are likely to confront during their investment time horizons.
Unfortunately, it is incredibly difficult to predict when stocks will fall. And exiting stocks in an attempt to avoid short-term losses can prove incredibly costly to long-term returns.
So, whether or not you can comprehensively identify and balance all of the potential bullish and bearish market catalysts, it’s probably a good idea to just always be prepared for stocks to experience some big dips on their long upward journey…
Read the rest at: Coping with two conflicting realities 🧸🐂
