
Mind the anecdata 🤏
Plus a charted review of the macro crosscurrents 🔀


The New York Giants appear to have a supply chain problem.
In a research note to clients Friday, Wells Fargo’s Christopher Harvey flagged a locker-room interview with Giants wide receiver Kenny Golladay from earlier in the week. Behind him was a printout notifying players “DO NOT GIVE YOUR GAME JERSEY AWAY OR SWAP IT… THE UNIFORM COMPANY WHO MAKES OUR JERSEYS CAN NOT MAKE ANYMORE FOR US THIS YEAR.”1
It’s a funny anecdote.
It’s also the kind of anecdote that a market prognosticator might reference to support her priors that we are still in the throes of a global supply chain crisis.
However, this is what statisticians might characterize as a type I error, or a false positive.
In reality, most broad supply chain-related metrics (e.g., delivery times, inventories, freight costs, shipping capacity, inflation) suggest this crisis we were facing a year ago has subsided. [For more on this, read: “A bunch of charts showing how supply chains have improved⛓“ and “9 reasons to be optimistic about the economy 💪.]
Yes, there will be plenty of anecdotes suggesting otherwise. But this will always be the case for everything.
We can say the same thing about the high-profile, large-scale layoffs announced at big tech companies over the past year. Last week, Microsoft announced it would cut 10,000 jobs and Google-parent Alphabet announced it would cut 12,000 jobs.
There’s no question these are large numbers, and it’s a very difficult situation for those affected.
But according to Goldman Sachs research, there have been numerous instances when a spike in layoffs in the the tech industry — which represents less than 3% of total employment — did not portend widespread job cuts across the economy. [For more on this, read: “Don't be misled by no-context reports of big tech layoffs 🤨.“]
Unfortunately, it’s the case that many companies conduct many layoffs even during periods of economic growth. For almost two years, U.S. employers have laid off between 1.2 million and 1.5 million employees a month. Again, these are large numbers. However, these figures amount to just 0.8% to 1.0% of total employment, which is low by historical standards. Prior to the pandemic, this layoff rate never fell below 1.1%. [For more on this, read: “9 reasons to be optimistic about the economy and markets 💪.”]

These trends are confirmed by weekly initial claims for unemployment insurance, which are near the lowest levels of the current economic cycle.

The fact that unemployment remains low and job openings have been ticking lower from very high levels suggest many people being laid off are quickly finding work elsewhere.
Vox’s Emily Stewart said it well in an article published Thursday: “If a whisper of a layoff is the thing that goes bump in the night, tons of news stories about thousands of people at Big Important Companies being out of a job feels like the giant monster standing in your door ready to eat you. But all is not as it seems.“
The Atlantic’s Derek Thompson had an article on the topic Friday, noting that among other things tech was in a bubble in recent years. On Saturday, The Wall Street Journal highlighted that from 2019 to 2022, “the employee count at Amazon doubled, Microsoft’s rose 53%, Google parent Alphabet Inc.’s increased 57% and Facebook owner Meta’s ballooned 94%.“
[For more on this, read: “Beware alarming business stories that get a lot of news coverage 🗞️.“]
We certainly can’t rule out the possibility that significant layoffs could come to larger parts of the economy. However, the data suggest the pain is relatively isolated.
Anecdata isn’t totally worthless 🤔
Every couple of weeks, the Federal Reserve publishes its “Beige Book” of economic anecdotes. And it’ll include stuff like:
"A low-cost retailer reported that falling gas prices had driven stronger sales in December, but a high-end retailer exclaimed that 'December is not happening!'"
“Moreover, visits to major tourist attractions, such as the Statue of Liberty, have rebounded to pre-pandemic levels. While attendance at Broadway shows has been mixed, high-profile musicals targeted towards visitors have reportedly fared quite well.“
Anecdotes can be valuable in that they often put a face on the stats we read about every day. Sometimes, they will indeed confirm changes in the economic tides.
However, I’d approach anecdotes with caution. If they’re not confirmed by broader measures or if they conflict with the confluence of available data, then you risk making type I and type II (i.e., a false negative) errors.
So don’t dismiss the anecdata. Just be mindful.
-
Related from TKer:
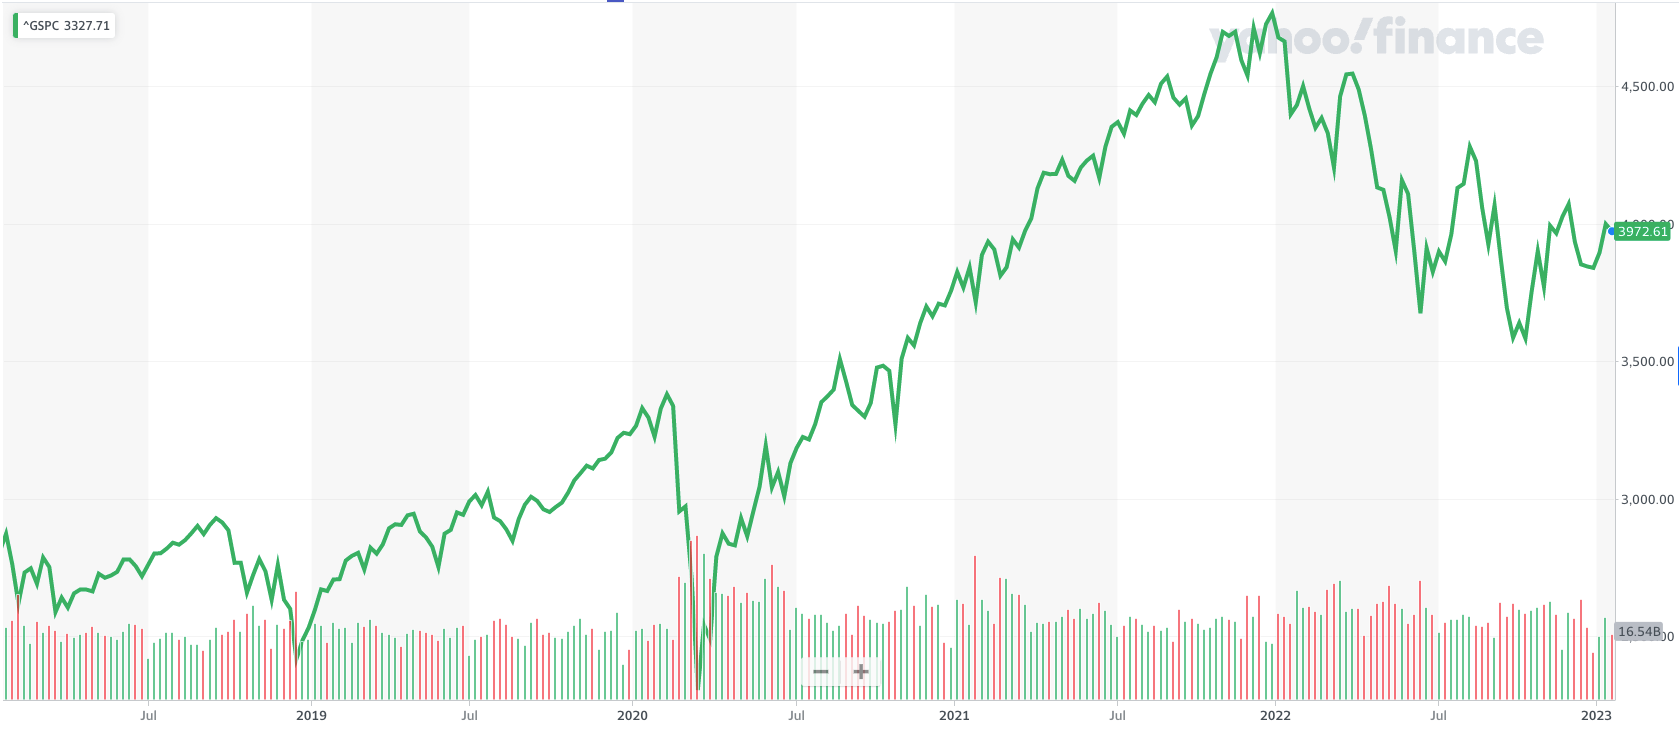
Stocks retreated, with the S&P 500 slipping 0.7% last week. The index is now up 11.1% from its October 12 closing low of 3,577.03 and down 17.2% from its January 3, 2022 closing high of 4,796.56.
Here’s a random stat courtesy of our friends at S&P Dow Jones Indices: “Happy Lunar New Year to those who celebrate! The year of the Rabbit will begin this Sunday (Jan. 22nd), and history may put a hop in investors’ steps in the coming year: based on data since 1931, the year of the Rabbit had the fourth highest average price return for the S&P 500 across the 12 animal signs in the Chinese Zodiac.“

File this one under spurious correlations. That said, it’s kind of fun to think about. Make sure to give grief to your friends and colleagues who were born in a year of the Snake.
-
Related from TKer:
Everyone’s talking about a near-term sell-off. A contrarian signal? 🤔
One of the most frequently cited risks to stocks in 2023 is 'overstated' 😑
Don't expect average returns in the stock market this year 📊
Reviewing the macro crosscurrents 🔀
There were a few notable data points from last week to consider:
