How the stock market performed around recessions 📉📈
A recession is not imminent, but it's good to be aware of the risks ⚠️
There’s been some buzz in the news1 about what appear to be increasing risks of a recession in the U.S. economy.2
Jonathan Golub, chief U.S. equity strategist at Credit Suisse, listed the factors driving these concerns in a research note on Monday: “Fed tightening. A flattening yield curve. Negative real wage growth. Declining consumer confidence. Rising inflation/oil prices. Decelerating profits. Covid-19. Ukraine.”
“Given this cornucopia of headwinds, it’s no surprise that investors are increasingly concerned about the potential for recession/stagflation,” Golub said.
He concluded, however, that these fears are “overstated.”3
Similarly, RBC Capital Markets notes that while “the risk of recession has clearly grown,” it is not the firm’s base-case scenario.
All that said, it’s worth considering how stocks perform around recessions, because recessions do indeed happen.
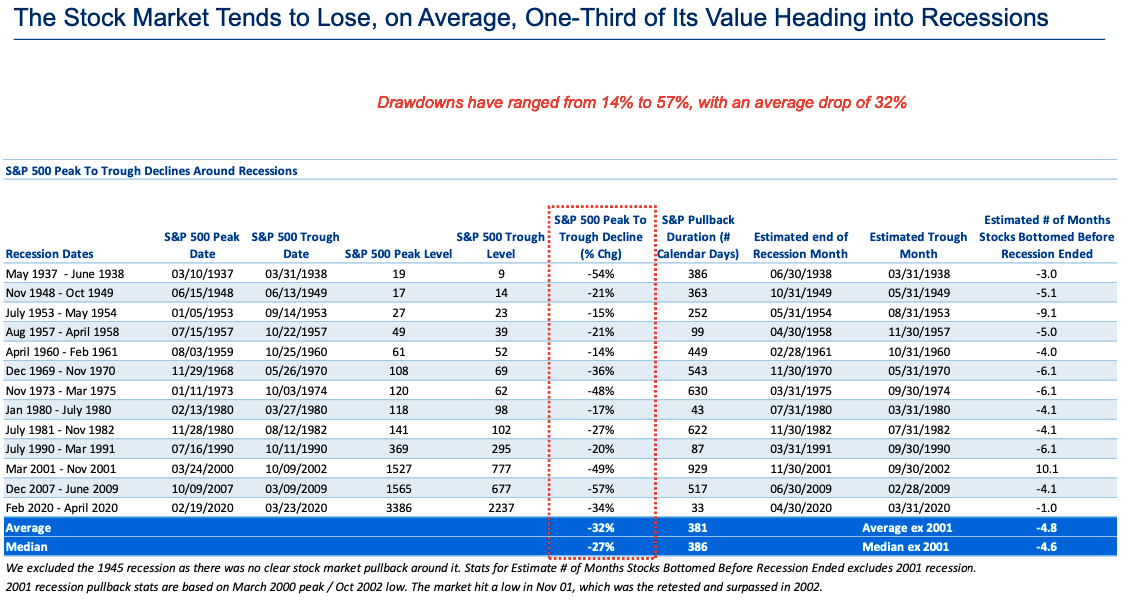
Lori Calvasina, head of U.S. equity strategy at RBC, looked into the history and compiled the data in the table below.
“On average, the stock market has fallen 32% [from] peak to trough heading into and in the early days of a recession—remarkably similar to the 34% drop seen in 2020 during the pandemic,” she observed. On average, these pullbacks lasted 381 days.
As you can see, every recession is different. And the range of stock performance varies greatly.
There are two things worth noting.


