Stocks made new record highs, with the S&P 500 reaching a closing high of 5,088.80 and an intraday high of 5,111.06 on Friday. For the week, the S&P gained 1.7%. The index is now up 6.7% year to date and up 42.3% from its October 12, 2022 closing low of 3,577.03.
As prices have climbed, valuations have followed. While they’re not at all-time highs, valuations are currently above long-term averages, raising doubts about whether it’s a great time to buy.
This is a bit of a quandary for investors.
Perhaps we can gain some insight from arguably the greatest stock market investor of all time: Warren Buffett.
How a new investment philosophy changed Berkshire forever 💰
Buffett’s new annual letter to Berkshire Hathaway shareholders opened with a thoughtful tribute to Charlie Munger, his long-time partner who died in November.
He highlighted the huge impact Munger had on how he thought about investing. From the letter (emphasis added):
…Charlie, in 1965, promptly advised me: “Warren, forget about ever buying another company like Berkshire. But now that you control Berkshire, add to it wonderful businesses purchased at fair prices and give up buying fair businesses at wonderful prices. In other words, abandon everything you learned from your hero, Ben Graham. It works but only when practiced at small scale.” With much back-sliding I subsequently followed his instructions.
Many years later, Charlie became my partner in running Berkshire and, repeatedly, jerked me back to sanity when my old habits surfaced. Until his death, he continued in this role and together we, along with those who early on invested with us, ended up far better off than Charlie and I had ever dreamed possible.
In case you aren’t familiar, Ben Graham wrote the finance classic The Intelligent Investor. Also known as the “father of value investing,” Graham was Buffett’s professor at Columbia Business School and later his boss.
Under Graham’s guidance, Buffett mastered the idea of “buying fair businesses at wonderful prices,” or stocks trading at less than their intrinsic value.
One colorful iteration of this is “cigar butt” investing. Buffett explained in his 1989 letter to Berkshire shareholders:
If you buy a stock at a sufficiently low price, there will usually be some hiccup in the fortunes of the business that gives you a chance to unload at a decent profit, even though the long-term performance of the business may be terrible. I call this the "cigar butt" approach to investing. A cigar butt found on the street that has only one puff left in it may not offer much of a smoke, but the "bargain purchase" will make that puff all profit.
Buffett had a lot of success with this approach.
However, the issue with “cigar butt” investing is that there aren’t many opportunities, and the opportunities tend to be small.
Munger’s suggestion to flip the script and add “wonderful businesses purchased at fair prices” expanded the range of opportunities that Berkshire could pursue for its growing portfolio.
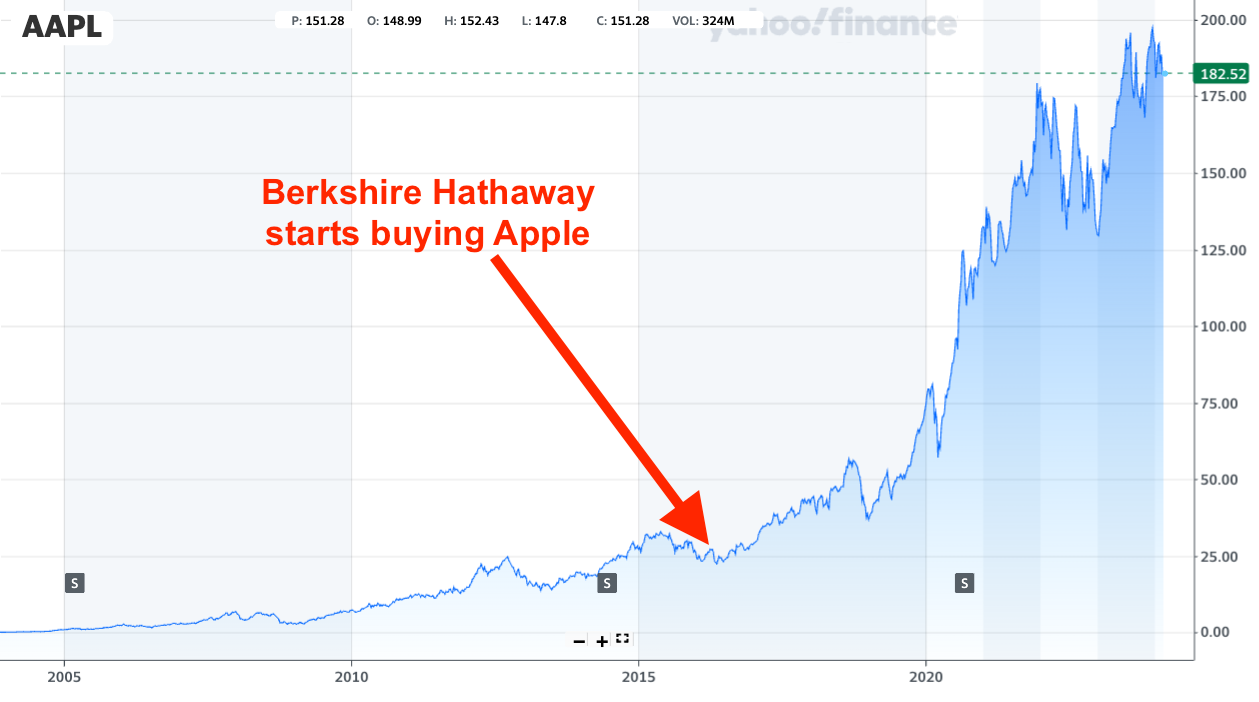
It’s this kind of thinking that justified Berkshire amassing shares of Apple starting in 2016 at a time when many questioned how much further the stock could run.
“He'd made so much money in the other technique that it was hard for him to leave something that had worked so well,” Munger said in a 2019 interview. “But it was not going to scale. So when he started looking for investment values in great businesses that were temporarily under pressure, it changed everything for the better. Now we could scale up to the big time.”
The greatest trade 🤝
Great trades are rarely simple analytical exercises where outcomes match expectations. They often challenge your instincts, and they require that you balance humility and discipline with a willingness to change your mind.
While it’s hard enough to sell a stock that’s created a ton of wealth for you, it’s a whole other thing to step away from a working investment strategy you’ve been mastering for your entire career.
But this is what Munger urged Buffett to do, and the change has so far been a winning move for Berkshire and its shareholders.
I’d argue Buffett’s greatest trade didn’t involve any single financial security. Rather, I’d say his greatest trade was selling “cigar butt” investing and buying the investing philosophy championed by his right-hand man.
Credit to Munger for making the recommendation. Credit to Buffett for executing the trade.
Getting back to the stock market 📈
It’s hard to argue the stock market is clearly undervalued. In other words, you might not say buying the S&P 500 today is comparable to buying a “fair business at a wonderful price.”
But could you compare it to buying a “wonderful business at a fair price”? Does the S&P represent an opportunity that could generate attractive returns in the years to come?
Well, it sure looks a lot more attractive than a cigar butt.
-
Related from TKer:
UBS raises its target for the S&P 500 📈
On Tuesday, Jonathan Golub, chief U.S. equity strategist for UBS, raised his year-end target for the S&P 500 to 5,400 from 5,150. This is his second revision from his initial target.
“Despite our bullish outlook, it appears we were not bullish enough,” he wrote. “We are also increasing our 2024-25 EPS estimates from $235 to $240, and $250 to $255, implying 9.1% and 6.3% growth over the next 2 years.“
Golub is not alone in having to tweak his forecasts. His peers at Goldman Sachs, RBC, and CFRA are among those who’ve already raised their targets.
Don’t be surprised to see more of these revisions as the S&P 500’s performance, so far, has exceeded many strategists’ expectations.
Amazon to replace Walgreens in the Dow 🧮
From S&P Dow Jones Indices:
Amazon.com Inc. (NASD:AMZN) will replace Walgreens Boots Alliance Inc. (NASD:WBA) in the Dow Jones Industrial Average. Reflecting the evolving nature of the American economy, this change will increase consumer retail exposure as well as other business areas in the DJIA. The index change was prompted by DJIA constituent Walmart Inc.’s (NYSE:WMT) decision to split its stock 3:1, which will reduce Walmart’s index weight due to the price weighted construction of the index. Walmart will remain in the DJIA.
The change will be effective head of the market opens on February 26.
For more on stock splits, read: The curious thing about stock splits 🔪
For more on turnover in stock indexes, read: The makeup of the S&P 500 is constantly changing 🔀
Reviewing the macro crosscurrents 🔀
There were a few notable data points and macroeconomic developments from last week to consider:
👍 Popular economic indicator no longer signals recession. The Conference Board’s Leading Economic Index (LEI) — a composite of market and economic metrics — has had a good track record of predicting recessions. But over the past two years, it has been signaling a recession that hasn’t come. In its January update, the organization notes the index is no longer signaling a recession. From The Conference Board’s Justyna Zabinska-La Monica: “While the declining LEI continues to signal headwinds to economic activity, for the first time in the past two years, six out of its ten components were positive contributors over the past six-month period (ending in January 2024). As a result, the leading index currently does not signal recession ahead. While no longer forecasting a recession in 2024, we do expect real GDP growth to slow to near zero percent over Q2 and Q3.“
The new report drew criticism from veteran Wall Street analyst Ed Yardeni. From his note Tuesday: “Rather than admit that the LEI has been misleading, The Conference Board tweaked the rule of thumb, which had been that three consecutive declines in the LEI signaled a looming recession. Now it's how many of its components are falling over a six month period. In our opinion, the LEI is due for a product recall.“
Lesson: Beware leading indicators. There are no perfect predictors of what’s to come.
For more on the recession that never came, read: Still waiting for that recession people have been worried about 🕰️
💼 Unemployment claims fall. Initial claims for unemployment benefits fell to 201,000 during the week ending February 17, down from 212,000 the week prior. While this is above the September 2022 low of 182,000, it continues to trend at levels historically associated with economic growth.
For more on the labor market, read: The hot but cooling labor market in 16 charts 📊🔥🧊
💳 Card data suggests spending is holding up. From JPMorgan: “As of 16 Feb 2024, our Chase Consumer Card spending data (unadjusted) was 1.1% below the same day last year. Based on the Chase Consumer Card data through 16 Feb 2024, our estimate of the US Census February control measure of retail sales m/m is 0.31%.
For more on consumer finances, read: People have money 💵
🏚 Home sales rise. Sales of previously owned homes increased by 3.1% in January to an annualized rate of 4.0 million units. From NAR chief economist Lawrence Yun: “While home sales remain sizably lower than a couple of years ago, January's monthly gain is the start of more supply and demand. Listings were modestly higher, and home buyers are taking advantage of lower mortgage rates compared to late last year.“
💸 Home prices ticked lower. Prices for previously owned homes declined month over month, but were up from year-ago levels. From the NAR: “The median existing-home price for all housing types in January was $379,100, an increase of 5.1% from one year ago ($360,800).“
🏠 Mortgage rates tick up. According to Freddie Mac, the average 30-year fixed-rate mortgage rose to 6.90% from 6.77% the week prior. From Freddie Mac: “Strong incoming economic and inflation data has caused the market to re-evaluate the path of monetary policy, leading to higher mortgage rates. Historically, the combination of a vibrant economy and modestly higher rates did not meaningfully impact the housing market. The current cycle is different than historical norms, as housing affordability is so low that good economic news equates to bad news for homebuyers, who are sensitive to even minor shifts in affordability.”
For more on mortgages and home prices, read: Why home prices and rents are creating all sorts of confusion about inflation 😖
⛽️ Gas prices unchanged. From AAA: “After suddenly spiking more than a dime two weeks ago, the national average for a gallon of gas had a calm week by remaining at $3.27. News that the large BP-Whiting refinery in Indiana, offline since early February due to power issues, is reopening soon may have contributed to easing pump price nerves. The refinery processes nearly 440,000 barrels of crude daily, and the shutdown caused gasoline prices throughout the Midwest to rise.”
For more on energy prices, read: The other side of the oil price story 🛢
💰Corporations have cash. From Bloomberg: “Corporate cashpiles have risen as a percentage of gross domestic product to 16% as of the third-quarter last year from 12% in March 2020 due to the Covid liquidity shock, according to Tony Carfang, managing director at the Carfang Group. That’s an additional $1 trillion of cash companies are hoarding, he said, noting the tally reached $4.4 trillion in the third quarter.“
For more on corporate finances, read: The bright side of higher interest rates ☀️
👎 Survey signals growth, but deceleration. From S&P Global’s February U.S. PMI: “The early PMI data for February indicate that the U.S. economy continued to expand midway through the first quarter, pointing to annualized GDP growth in the region of 2%. Although service sector growth cooled slightly, manufacturing staged a welcome return to growth, with factory output growing at the fastest rate for ten months.“
For more, read: Economic growth: Slowdown, recession, or something else? 🇺🇸
Price signals have been tame. From the report: “The sustained expansion is being accompanied by subdued price pressures. Although up slightly in February, the survey’s gauge of selling prices for goods and services continues to run at a level consistent with the Fed hitting its 2% inflation target, and a further fall in cost growth to the lowest since October 2020 hints at price pressures remaining subdued in the coming months.“
For more, read: Inflation: Is the worst behind us? 🎈
Putting it all together 🤔
We continue to get evidence that we are experiencing a bullish “Goldilocks” soft landing scenario where inflation cools to manageable levels without the economy having to sink into recession.
This comes as the Federal Reserve continues to employ very tight monetary policy in its ongoing effort to get inflation under control. While it’s true that the Fed has taken a less hawkish tone in 2023 and 2024 than in 2022, and that most economists agree that the final interest rate hike of the cycle has either already happened, inflation still has to stay cool for a little while before the central bank is comfortable with price stability.
So we should expect the central bank to keep monetary policy tight, which means we should be prepared for relatively tight financial conditions (e.g., higher interest rates, tighter lending standards, and lower stock valuations) to linger. All this means monetary policy will be unfriendly to markets for the time being, and the risk the economy slips into a recession will be relatively elevated.
At the same time, we also know that stocks are discounting mechanisms — meaning that prices will have bottomed before the Fed signals a major dovish turn in monetary policy.
Also, it’s important to remember that while recession risks may be elevated, consumers are coming from a very strong financial position. Unemployed people are getting jobs, and those with jobs are getting raises.
Similarly, business finances are healthy as many corporations locked in low interest rates on their debt in recent years. Even as the threat of higher debt servicing costs looms, elevated profit margins give corporations room to absorb higher costs.
At this point, any downturn is unlikely to turn into economic calamity given that the financial health of consumers and businesses remains very strong.
And as always, long-term investors should remember that recessions and bear markets are just part of the deal when you enter the stock market with the aim of generating long-term returns. While markets have had a pretty rough couple of years, the long-run outlook for stocks remains positive.
For more on how the macro story is evolving, check out the the previous TKer macro crosscurrents »
TKer’s best insights about the stock market 📈
Here’s a roundup of some of TKer’s most talked-about paid and free newsletters about the stock market. All of the headlines are hyperlinked to the archived pieces.
10 truths about the stock market 📈
The stock market can be an intimidating place: It’s real money on the line, there’s an overwhelming amount of information, and people have lost fortunes in it very quickly. But it’s also a place where thoughtful investors have long accumulated a lot of wealth. The primary difference between those two outlooks is related to misconceptions about the stock market that can lead people to make poor investment decisions.
The makeup of the S&P 500 is constantly changing 🔀
Passive investing is a concept usually associated with buying and holding a fund that tracks an index. And no passive investment strategy has attracted as much attention as buying an S&P 500 index fund. However, the S&P 500 — an index of 500 of the largest U.S. companies — is anything but a static set of 500 stocks.
The key driver of stock prices: Earnings💰
For investors, anything you can ever learn about a company matters only if it also tells you something about earnings. That’s because long-term moves in a stock can ultimately be explained by the underlying company’s earnings, expectations for earnings, and uncertainty about those expectations for earnings. Over time, the relationship between stock prices and earnings have a very tight statistical relationship.
Stomach-churning stock market sell-offs are normal🎢
Investors should always be mentally prepared for some big sell-offs in the stock market. It’s part of the deal when you invest in an asset class that is sensitive to the constant flow of good and bad news. Since 1950, the S&P 500 has seen an average annual max drawdown (i.e., the biggest intra-year sell-off) of 14%.
High and rising interest rates don't spell doom for stocks👍
Generally speaking, rising interest rates are not welcome news for the economy and the stock market. They represent higher financing costs for businesses and consumers. All other things being equal, rising rates represent a hindrance to growth. However, the world is complicated, and this narrative comes with a lot of nuance. One big counterintuitive piece to this narrative is that historically, stocks have actually performed well during periods of rising interest rates.
How stocks performed when the yield curve inverted ⚠️
There’ve been lots of talk about the “yield curve inversion,” with media outlets playing up that this bond market phenomenon may be signaling a recession. Admittedly, yield curve inversions have a pretty good track record of being followed by recessions, and recessions usually come with significant market sell-offs. But experts also caution against concluding that inverted yield curves are bulletproof leading indicators.
How the stock market performed around recessions 📉📈
Every recession in history was different. And the range of stock performance around them varied greatly. There are two things worth noting. First, recessions have always been accompanied by a significant drawdown in stock prices. Second, the stock market bottomed and inflected upward long before recessions ended.
In the stock market, time pays ⏳
Since 1928, the S&P 500 generated a positive total return more than 89% of the time over all five-year periods. Those are pretty good odds. When you extend the timeframe to 20 years, you’ll see that there’s never been a period where the S&P 500 didn’t generate a positive return.
What a strong dollar means for stocks 👑
While a strong dollar may be great news for Americans vacationing abroad and U.S. businesses importing goods from overseas, it’s a headwind for multinational U.S.-based corporations doing business in non-U.S. markets.
Economy ≠ Stock Market 🤷♂️
The stock market sorta reflects the economy. But also, not really. The S&P 500 is more about the manufacture and sale of goods. U.S. GDP is more about providing services.
Stanley Druckenmiller's No. 1 piece of advice for novice investors 🧐
…you don't want to buy them when earnings are great, because what are they doing when their earnings are great? They go out and expand capacity. Three or four years later, there's overcapacity and they're losing money. What about when they're losing money? Well, then they’ve stopped building capacity. So three or four years later, capacity will have shrunk and their profit margins will be way up. So, you always have to sort of imagine the world the way it's going to be in 18 to 24 months as opposed to now. If you buy it now, you're buying into every single fad every single moment. Whereas if you envision the future, you're trying to imagine how that might be reflected differently in security prices.
Peter Lynch made a remarkably prescient market observation in 1994 🎯
Some event will come out of left field, and the market will go down, or the market will go up. Volatility will occur. Markets will continue to have these ups and downs. … Basic corporate profits have grown about 8% a year historically. So, corporate profits double about every nine years. The stock market ought to double about every nine years… The next 500 points, the next 600 points — I don’t know which way they’ll go… They’ll double again in eight or nine years after that. Because profits go up 8% a year, and stocks will follow. That's all there is to it.
Warren Buffett's 'fourth law of motion' 📉
Long ago, Sir Isaac Newton gave us three laws of motion, which were the work of genius. But Sir Isaac’s talents didn’t extend to investing: He lost a bundle in the South Sea Bubble, explaining later, “I can calculate the movement of the stars, but not the madness of men.” If he had not been traumatized by this loss, Sir Isaac might well have gone on to discover the Fourth Law of Motion: For investors as a whole, returns decrease as motion increases.
Most pros can’t beat the market 🥊
According to S&P Dow Jones Indices (SPDJI), 59.7% of U.S. large-cap equity fund managers underperformed the S&P 500 during the first half of 2023. As you stretch the time horizon, the numbers get more dismal. Over a three-year period, 79.8% underperformed. Over a 10-year period, 85.6% underperformed. And over a 20-year period, 93.6% underperformed.
The sobering stats behind 'past performance is no guarantee of future results' 📊
S&P Dow Jones Indices found that funds beat their benchmark in a given year are rarely able to continue outperforming in subsequent years. For example, 318 large-cap equity funds were in the top half of performance in 2020. Of those funds, 39% came in the top half again in 2021, and just 5% were able to extend that streak through 2022. If you set the bar even higher and consider those in the top quartile of performance, just 7% of 156 large-cap funds remained in the top quartile in 2021. No large-cap funds were able to stay in the top quartile for the three consecutive years ending in 2022.
The odds are stacked against stock pickers 🎲
Picking stocks in an attempt to beat market averages is an incredibly challenging and sometimes money-losing effort. In fact, most professional stock pickers aren’t able to do this on a consistent basis. One of the reasons for this is that most stocks don’t deliver above-average returns. According to S&P Dow Jones Indices, only 24% of the stocks in the S&P 500 outperformed the average stock’s return from 2000 to 2022. Over this period, the average return on an S&P 500 stock was 390%, while the median stock rose by just 93%.