

All things considered, it’s been a pretty good year for the stock market.
Year to date, the S&P 500 is up over 11%.
Meanwhile, the index has experienced an intra-year max drawdown of 9%, below the historical average of 14%.
In other words, we’d have to get a pretty ugly market sell-off in the next four months for 2026 to go down as an average year — which is certainly possible and why investors should always keep their stock market seat belts fastened.
As TKer’s 10 Truths remind us, while the long game is undefeated, a lot can go wrong — and right — in the short term.
With that in mind, here are some charts about the present moment that caught my eye.
Many stocks are going in the opposite direction of the market
For those catching up, beta measures how much an individual stock moves relative to the market average (e.g., the S&P 500). For example, if an S&P stock has a beta of 1, then it has historically moved in tandem with the index. If its beta is greater than 1, its moves have been more amplified than the index (e.g., a tech stock that goes up 2% on a day the S&P 500 goes up 1%). If its beta is between 0 and 1, its moves have been more subdued.
If a stock’s beta is negative, then it’s been moving in the opposite direction of the market. Historically, few S&P stocks have had negative betas.
That brings us to this observation by Janus Henderson’s Richard Bernstein.
“The stock market’s recent narrow leadership … has left a near-record number of companies with negative betas,” Bernstein wrote. “That should sound very odd to everyone, but it was true during and after the Tech Bubble, and it’s true again today.”
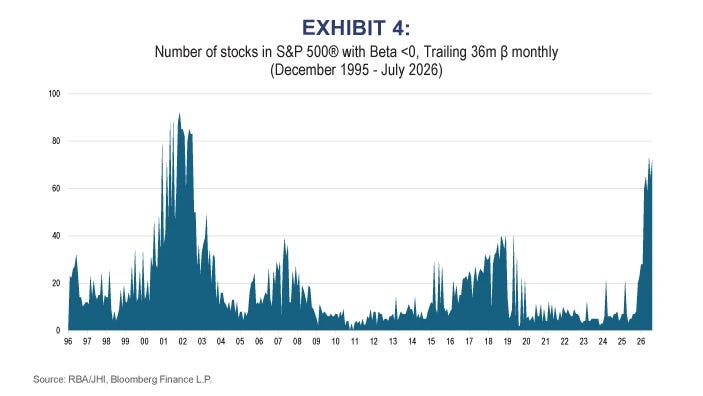
“Leadership has been so narrow that stocks can diversify stocks!“ Bernstein quipped.
This helps us better understand why correlations within the S&P have tumbled.
There’s much to be said about this. For now, one point I’ll make is that it would not be unprecedented for many stocks to lag even as the market averages continued to trend higher.
But for those of us who lived through the Tech Bubble, this development is understandably unsettling.
Related: The first half of 2026 confirmed a valuable stock market lesson 🤔
Getting the midterms behind us could be bullish
The second year of a president’s term tends to be the weakest of the four years. Strategists typically blame midterm elections for raising uncertainty.
On the plus side, the stock market has performed consistently well once we get a clearer indication of what the results could look like.
“Since 1970, the market has started to rally on average around a month (22 trading days) before a midterm election, as polling data provides clearer indications of results,” BlackRock analysts wrote. “As event risk passes post-election, equities have historically experienced tailwinds, with an average return of 14.1% in the following six months compared to 5.7% in non-midterm years.”
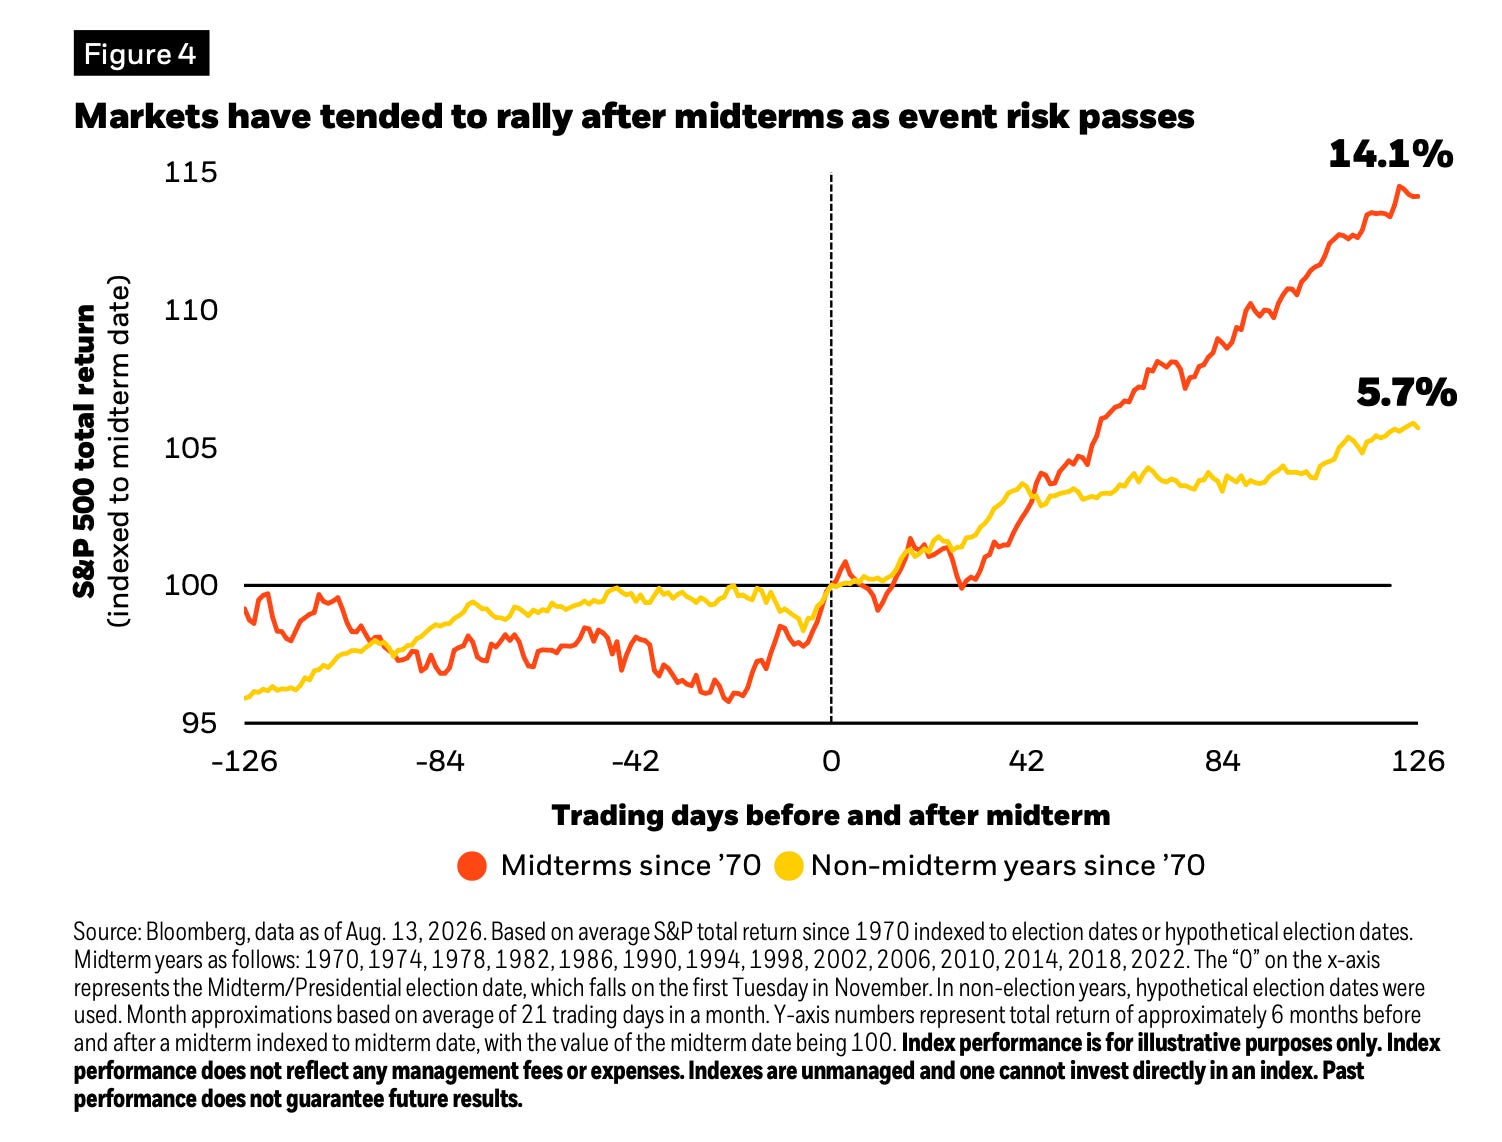
Interestingly, election results don’t necessarily have to be “good” or “bad” relative to your political leanings.
“Regardless of the outcome, midterms can help reduce uncertainty, with markets often rallying after the event,” the analysts added.
This is true of presidential elections too.
You could make the case that some outcomes are more favorable for business than others.
But in the business world, the only thing worse than a less favorable outcome is uncertainty about the future.
Related: If you think things are bad now, just keep in mind that they could get much worse 📉
Pension funds have been doing well, which could be a headwind for stocks
The stock market’s impressive gains have been a win for those invested.
Ironically, this may have created a headwind for … the stock market.
From Citadel Securities’ Scott Rubner: “The top 100 U.S. pension plans are approximately 112% funded, their highest funding levels since 2001. Strong funding levels continue to incentivize plans to de-glide and immunize portfolios, creating the potential for mechanical equity selling and fixed income buying into quarter-end.”
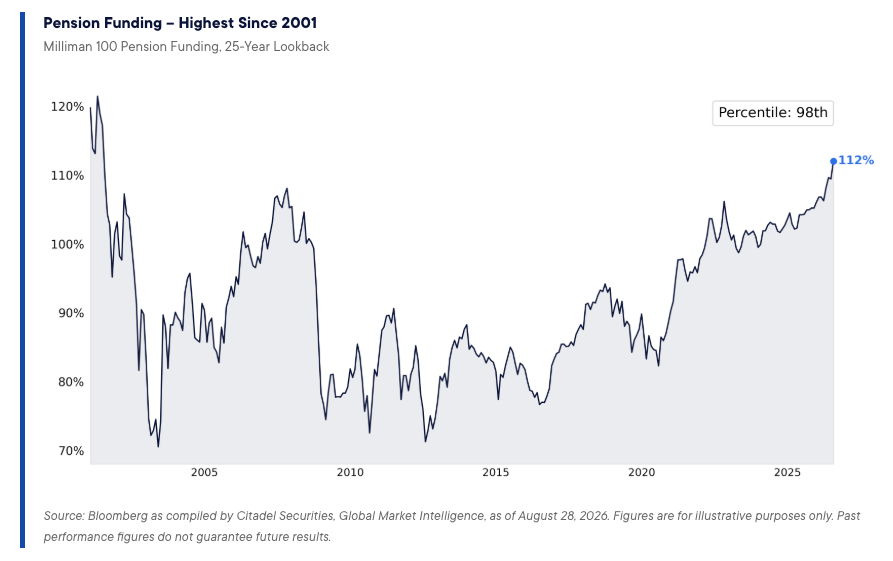
It makes sense. If I were tracking well ahead of my savings goals, I might adjust my allocations to reduce risk in my portfolio, too.
That said, I’m not sure I’d personally trade this development.
I only highlight it because it’s one of the countless things going on in the market that may or may not explain why prices do what they do in the short term.
It’s more complicated than ‘higher interest rates are bad for stocks’
All else equal, higher interest rates mean higher financing costs. All else equal, higher interest rates mean lower theoretical valuations.
But the stock market’s relationship with interest rates is far more complicated than that. Consider the simple chart below.