Taming my 'big dumb lizard brain' with a 'cowboy account' 🦎
Plus a charted review of the macro crosscurrents 🔀
📉 The stock market declined, with the S&P 500 falling 1.5% last week to close at 5,580.94. It’s now down 9.2% from its February 19 closing high of 6,144.15 and up 56% from its October 12, 2022 closing low of 3,577.03. For more on market moves, read: Investing in the stock market is an unpleasant process 📉
-
Something I love about Barry Ritholtz’s writing is how he often surprises you with unexpected insights.
Sure, he advances well-known — but still underappreciated — wisdom like how index fund investing is hard to beat and why making short-term market forecasts is futile.
But he offers much more than that.
Take this excerpt on psychology from his new book, “How Not To Invest,” which he shared in a recent piece for Bloomberg:
Trick Your Lizard Brain
Nobel laureate Paul Samuelson once said, “Investing should be more like watching paint dry or watching grass grow. If you want excitement, take $800 and go to Las Vegas.” While the dopamine hit that comes from a risky stock bet paying off may be enjoyable, passive management is the better option for most investors looking to grow long-term wealth.
The catch is that you must take steps to protect yourself from, well, yourself. To do so, set up a “mad-money account” — or a cowboy account, as it’s sometimes called. Add less than 5% of your liquid capital, so maybe $5,000 if you’re liquid enough to have $100,000 as a safety net. Now you can indulge your inner hedge fund manager without jeopardizing anything too material.
If it works out, you’re more likely to let those winners run because it’s for fun and not your real money. If it’s a debacle, appreciate the terrific lesson that should remind you that this is not your forte.
In his book, Barry shares a little more on what he personally does:
In my cowboy account, using 2% of my liquid net worth, I play the dumbest game possible: Market timing with out-of-the-money stock option calls…
He discusses specific trades he’s made. I’ll let you buy the book if you really want the details.
Here’s his bottom line.
Regardless of the results, it allows my inner junkie to leave my main portfolio alone. That is the true value of the cowboy account — my real money remains unmolested by me and my big dumb lizard brain.
Like most of us, Barry is not a machine. He is a human with a brain. And when your brain is mismanaged, it can be your worst enemy.
The idea of having a “cowboy account” is not without its issues. Some of you might say it could be a slippery slope towards costlier risk taking. This advice certainly isn’t for everybody. But let’s also not pretend like living in denial of your instincts and biases isn’t risky either.
As TKer subscribers know, my investing mostly consists of buying and holding passively managed index funds. But while I may have lost my taste for picking stocks and timing the market a long time ago, I haven’t lost my appetite for risk.
Personally, I’ve taken Samuelson’s advice much more literally. Occasionally, I like to play craps live in a casino. That’s the game where you often hear crowds of people cheer loudly as they engage in the mania of a “hot” table. I won’t get into too much detail, but it’s a game where I can lose enough that it’s memorably painful but not so much that it’s material to my finances. Importantly, it satiates my risk appetite, and it gives me renewed appreciation for my financial plan at relatively low cost.
In some ways, investing is like dieting: For many people, attempting to cut out junk food entirely just doesn’t work.
If you want to learn more about how real people can better navigate the treacherous world of investing, buy Barry’s book. He’s got real world solutions for your real world challenges.
For more info, head to HowNotToInvestBook.com »

-
Related from TKer:
Most stock-picking pros underperformed in 2024's market rally 🫤
Warren Buffett reminds us how picking winning stocks is hard 🤓
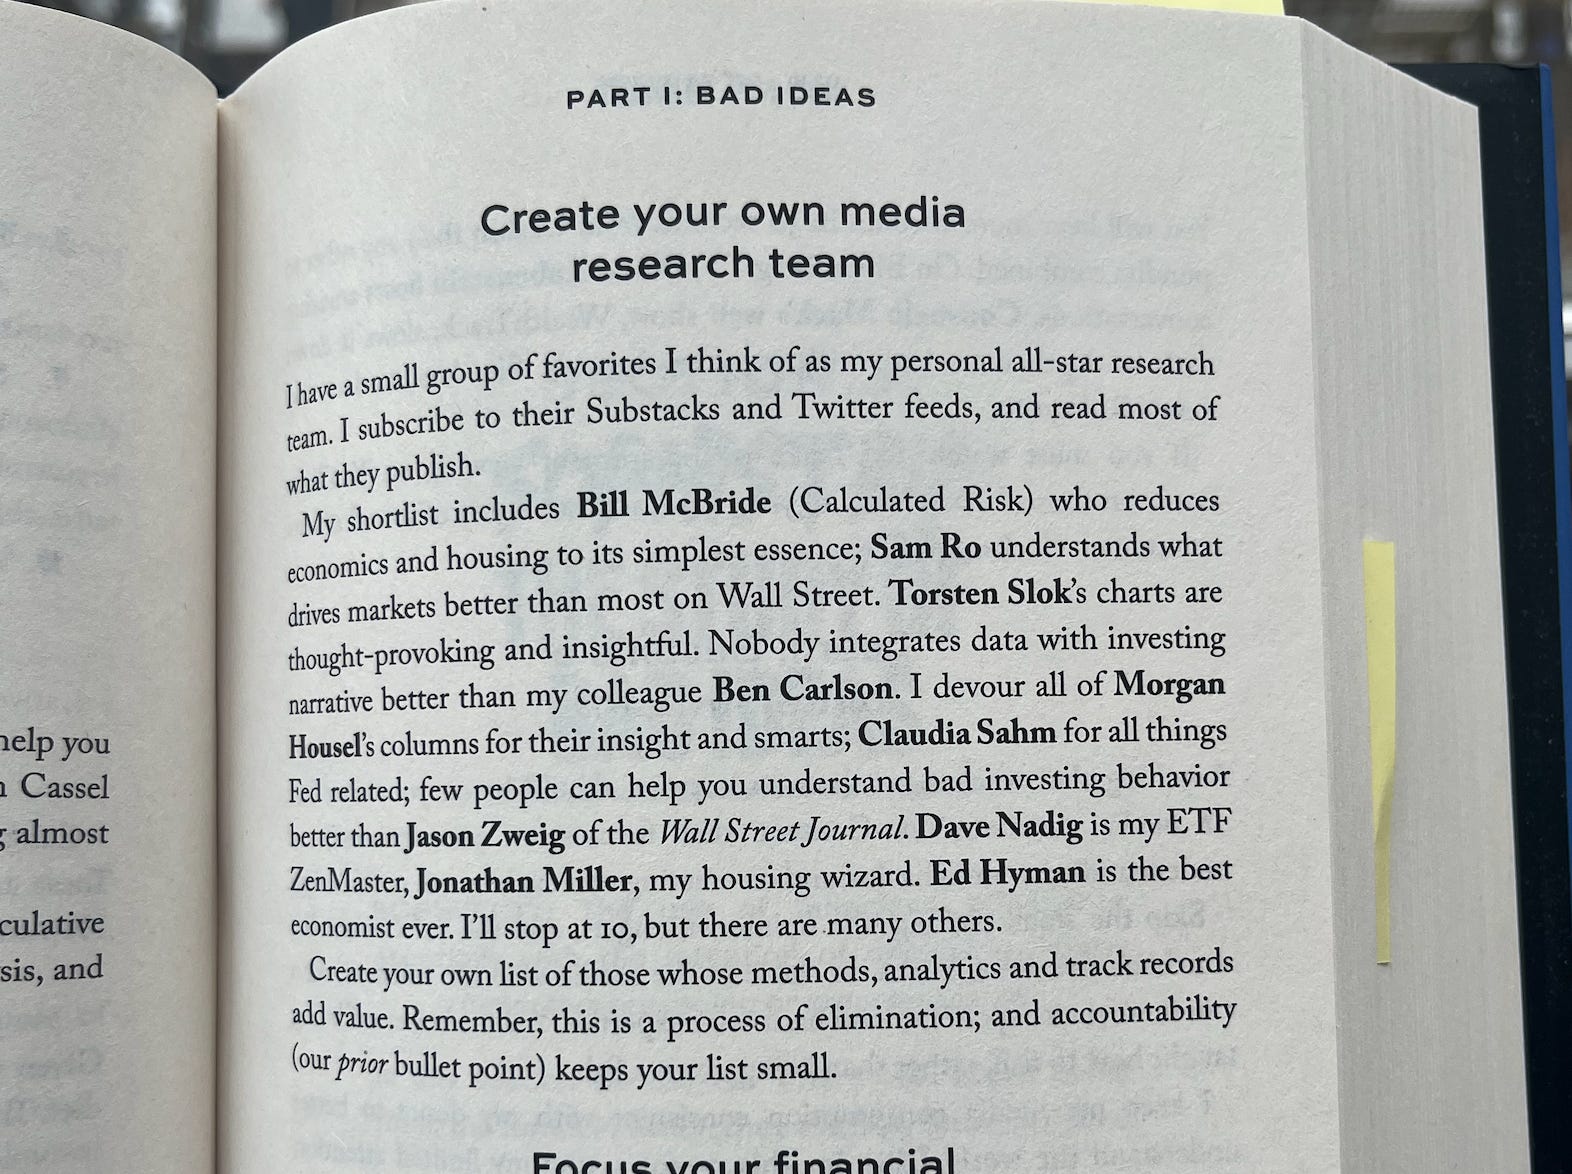
📘 Sam Ro mention!
I was shocked and humbled to learn that Barry mentioned me in “How NOT To Invest.” I’ve been reading his blogs since before the financial crisis. He’s had a huge impact on how I think and write about markets.
If you like TKer, then you’ll love Barry’s writing. Catch up on his views by reading his book!
Listen up! 🎧

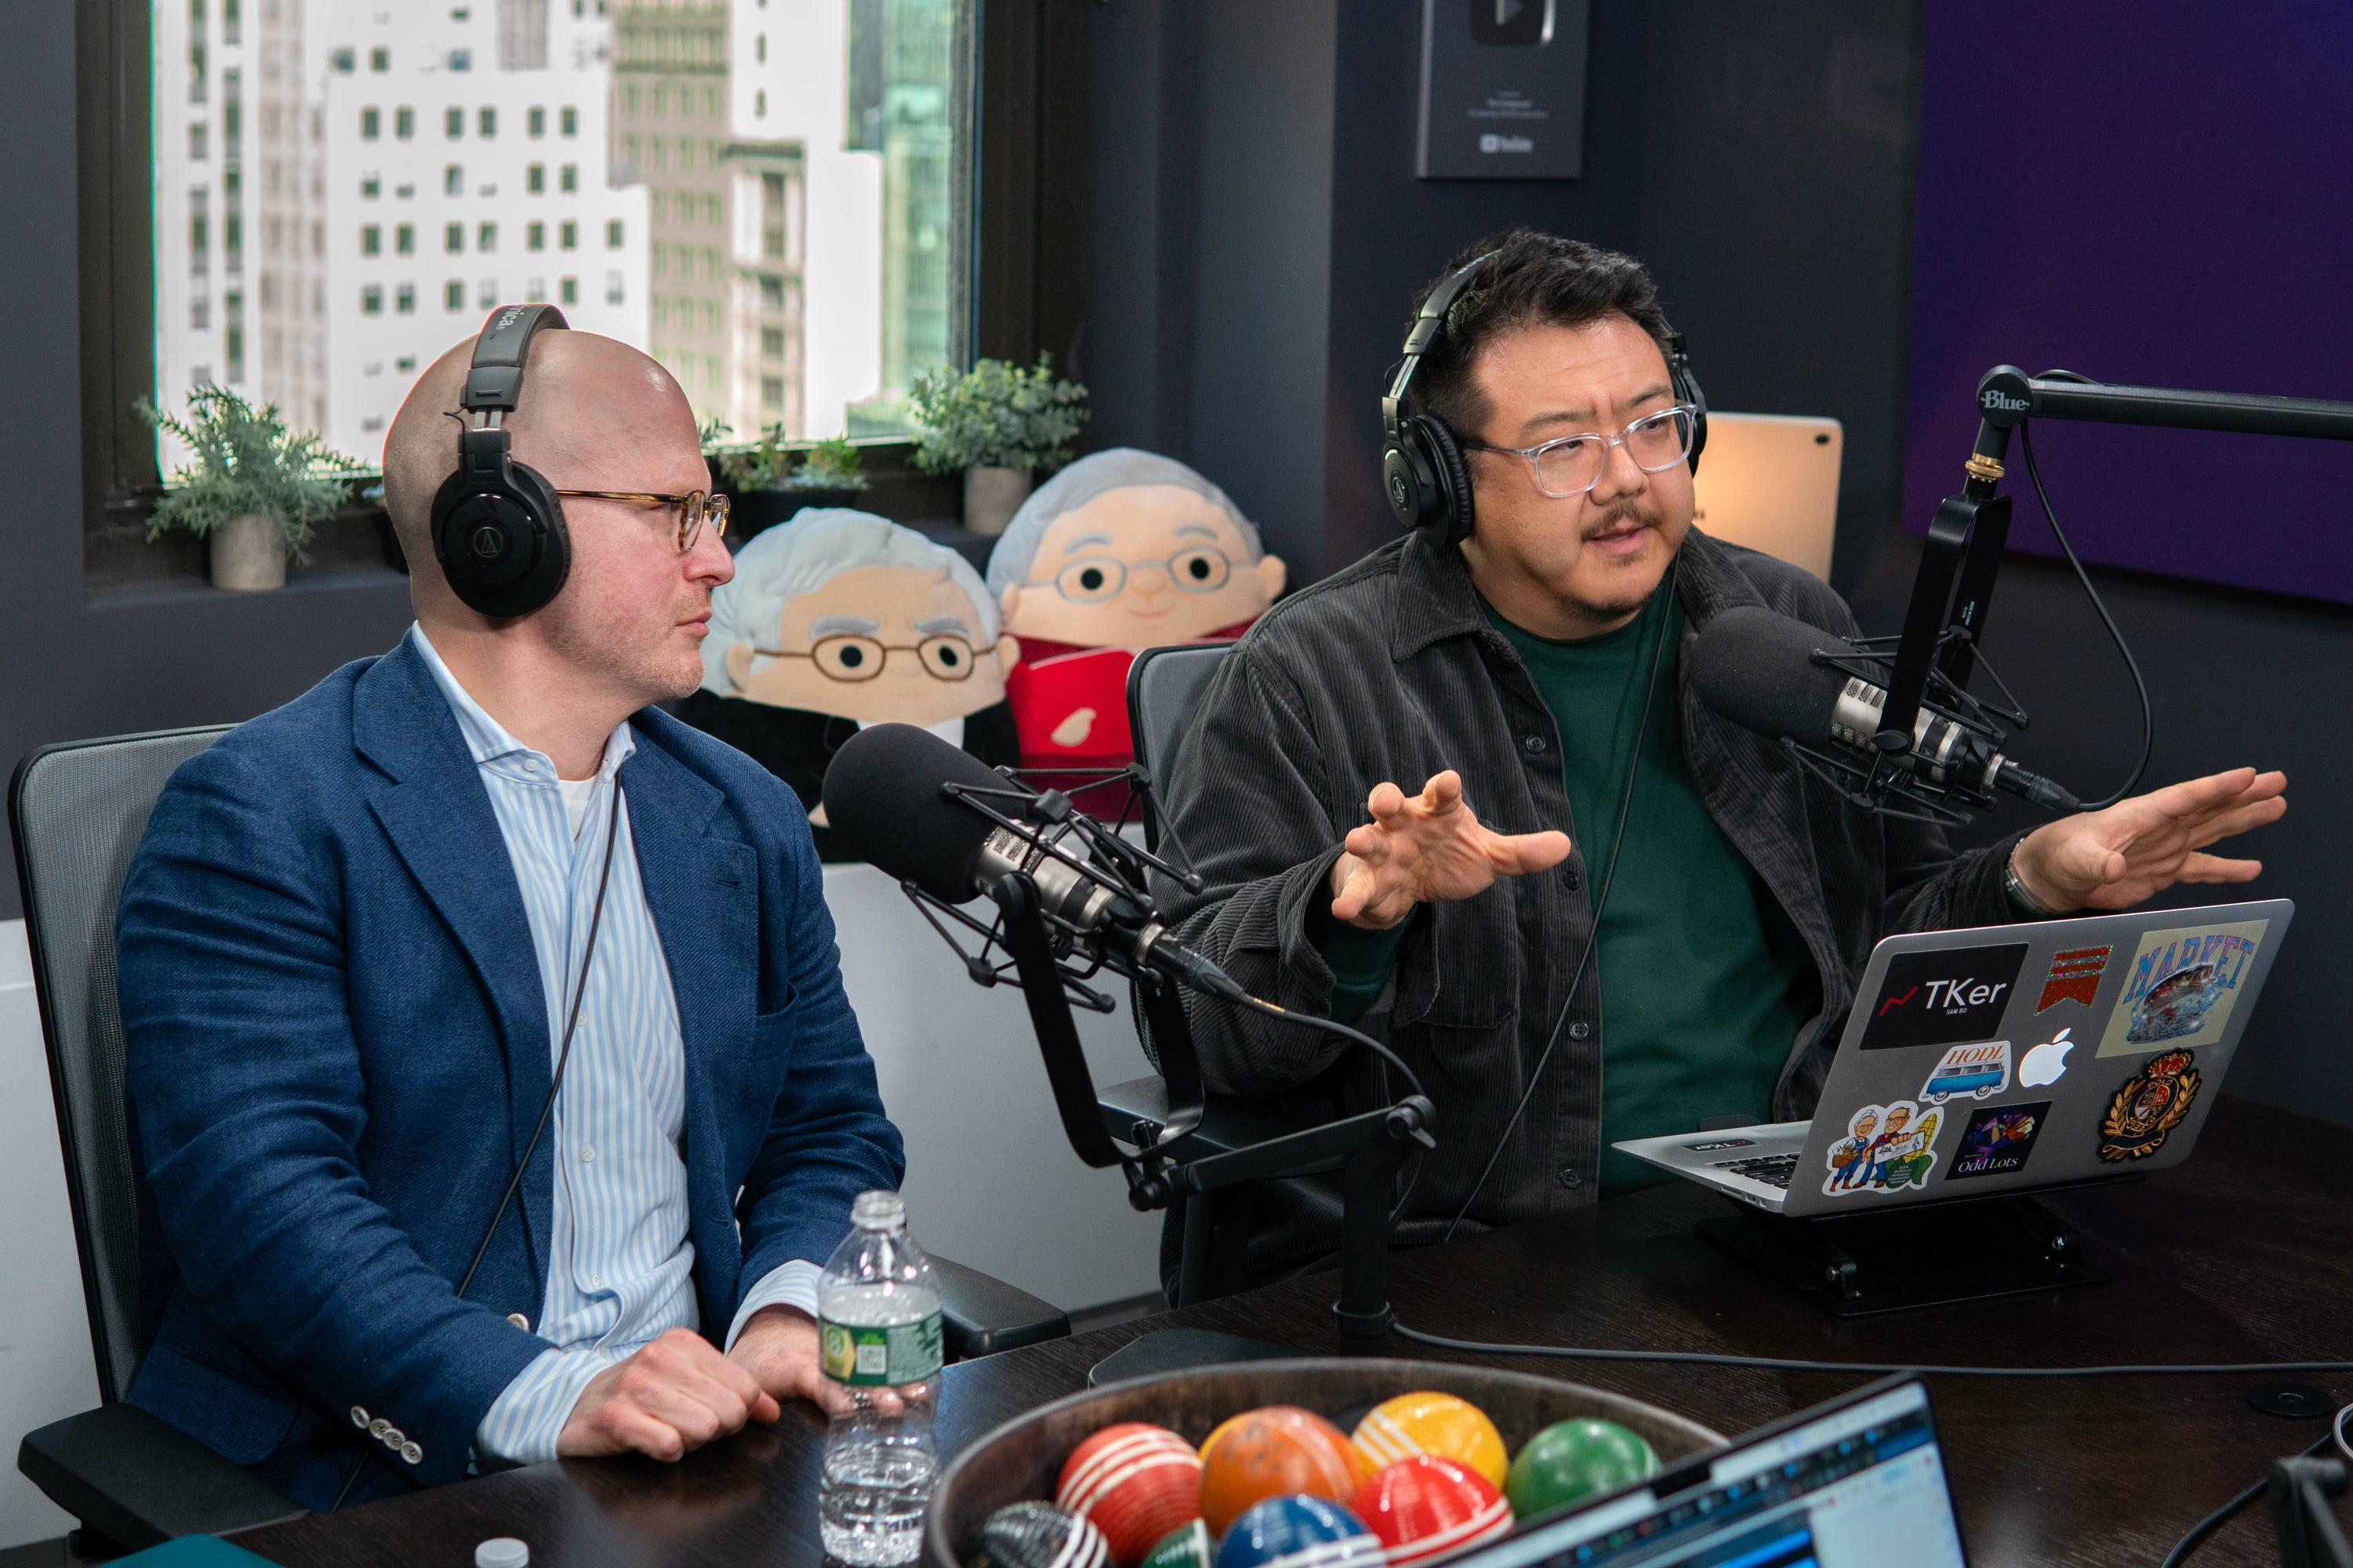
I was on The Compound & Friends podcast on Thursday with Andrew Beer of Dynamic Beta Investments, the legendary Josh Brown, and the brilliant Michael Batnick. We covered a lot. Trump trade policy, stock market sentiment, credit, hedge funds, diversification, and more! Listen on Apple Podcasts, Spotify, YouTube, and beyond!
Review of the macro crosscurrents 🔀
There were several notable data points and macroeconomic developments since our last review:
🛍️ Consumer spending ticks up. According to BEA data, personal consumption expenditures increased 0.4% month over month in February to an annual rate of $20.4 trillion.

Adjusted for inflation, real personal consumption expenditures increased by 0.1%.

For more on consumer spending, read: Americans have money, and they're spending it 🛍️ and 9 once-hot economic charts that cooled 📉
🎈 Inflation heats up. The personal consumption expenditures (PCE) price index in February was up 2.5% from a year ago. The core PCE price index — the Federal Reserve’s preferred measure of inflation — was up 2.8% during the month, up from January’s 2.7% rate. While it’s above the Fed’s 2% target, it remains near its lowest level since March 2021.

On a month over month basis, the core PCE price index was up 0.38%. If you annualized the rolling three-month and six-month figures, the core PCE price index was up 3.5% and 3.1%, respectively.

The recent uptick in inflation rates is an unwelcome development, especially as other economic trend cool.
For more on inflation and the outlook for monetary policy, read: The Fed closes a chapter with a rate cut ✂️ and The other side of the Fed's inflation 'mistake' 🧐
💼 Unemployment claims tick lower. Initial claims for unemployment benefits declined to 224,000 during the week ending March 22, down from 225,000 the week prior. This metric continues to be at levels historically associated with economic growth.

For more context, read: A note about federal layoffs 🏛️ and The labor market is cooling 💼
👎 Consumer vibes deteriorate. From the University of Michigan’s March Surveys of Consumers: “Consumer sentiment confirmed its early month reading and fell for the third straight month, plummeting 12% from February. The expectations index plunged a precipitous 18% and has now lost more than 30% since November 2024. This month’s decline reflects a clear consensus across all demographic and political affiliations; Republicans joined independents and Democrats in expressing worsening expectations since February for their personal finances, business conditions, unemployment, and inflation. Consumers continue to worry about the potential for pain amid ongoing economic policy developments. Notably, two-thirds of consumers expect unemployment to rise in the year ahead, the highest reading since 2009. This trend reveals a key vulnerability for consumers, given that strong labor markets and incomes have been the primary source of strength supporting consumer spending in recent years.“

The Conference Board’s Consumer Confidence Index ticked lower in March. From the firm’s Stephanie Guichard: “Of the Index’s five components, only consumers’ assessment of present labor market conditions improved, albeit slightly. Views of current business conditions weakened to close to neutral. Consumers’ expectations were especially gloomy, with pessimism about future business conditions deepening and confidence about future employment prospects falling to a 12-year low. Meanwhile, consumers’ optimism about future income—which had held up quite strongly in the past few months—largely vanished, suggesting worries about the economy and labor market have started to spread into consumers’ assessments of their personal situations.”

Relatively weak consumer sentiment readings appear to contradict resilient consumer spending data. For more on this contradiction, read: What consumers do > what consumers say 🙊 and We're taking that vacation whether we like it or not 🛫
👍 Consumers feel a little better about the labor market. From The Conference Board’s March Consumer Confidence survey: “Consumers’ views of the labor market improved slightly in March. 33.6% of consumers said jobs were ‘plentiful,’ unchanged from February. 15.7% of consumers said jobs were ‘hard to get,’ down from 16.0%.”
Many economists monitor the spread between these two percentages (a.k.a., the labor market differential), and it’s generally been reflecting a cooling labor market.

For more on the labor market, read: The labor market is cooling 💼
💳 Card spending data is holding up. From JPMorgan: “As of 18 Mar 2025, our Chase Consumer Card spending data (unadjusted) was 1.8% above the same day last year. Based on the Chase Consumer Card data through 18 Mar 2025, our estimate of the US Census March control measure of retail sales m/m is 0.46%.”
From BofA: “Total card spending per HH was up 1.5% y/y in the week ending Mar 22, according to BAC aggregated credit & debit card data. Entertainment spending growth has been weak since late Feb. The recent partial recovery has been led by the Midwest & South. Total card spending growth in the DC area remains weaker than the rest of the country, likely due to the impact of DOGE cuts.“
For more on the consumer, read: Americans have money, and they're spending it 🛍️
⛽️ Gas prices tick higher. From AAA: “With Spring Break in full swing, drivers are paying more at the pump compared to last week. The national average for a gallon of gas went up 3 cents since last Thursday to $3.15. Gas prices typically start going up this time of year and peak during summer. But the national average is still about 40 cents lower than last year, due to tepid gasoline demand and weak crude oil prices. ”

For more on energy prices, read: Higher oil prices meant something different in the past 🛢️
🏠 Mortgage rates tick lower. According to Freddie Mac, the average 30-year fixed-rate mortgage declined to 6.65% from 6.67% last week. From Freddie Mac: “The 30-year fixed-rate mortgage ticked down by two basis points this week. Recent mortgage rate stability continues to benefit potential buyers this spring, as reflected in the uptick in purchase applications.”

There are 147 million housing units in the U.S., of which 86.6 million are owner-occupied and 34 million (or nearly 40%) of which are mortgage-free. Of those carrying mortgage debt, almost all have fixed-rate mortgages, and most of those mortgages have rates that were locked in before rates surged from 2021 lows. All of this is to say: Most homeowners are not particularly sensitive to movements in home prices or mortgage rates.
For more on mortgages and home prices, read: Why home prices and rents are creating all sorts of confusion about inflation 😖
🏠 Home prices rise. According to the S&P CoreLogic Case-Shiller index, home prices rose 0.6% month-over-month in January. From S&P Dow Jones Indices’ Nicholas Godec: “Rising mortgage rates throughout the year elevated monthly payment burdens, which, combined with already high home prices, pushed affordability to multi-decade lows in many regions. This likely contributed to subdued activity in the back half of the year, with both buyers and sellers exercising caution. Inventory constraints also remain a challenge, particularly in legacy metro areas, where limited new construction continues to restrict supply.”

🏘️ New home sales rise. Sales of newly built homes increased 1.8% in February to an annualized rate of 676,000 units.

🏢 Offices remain relatively empty. From Kastle Systems: “Peak day office occupancy was 63.1% on Tuesday last week, up two tenths of a point from the previous week. In Austin, the South by Southwest conference and festival led to lower daily occupancy nearly every day. And in Houston, CERAWeek 2025 resulted in significantly lower occupancy last Thursday and Friday before rebounding after the conference, peaking at 71.2% on Tuesday. The 10-city average low was on Friday at 34.3%, down 2.1 points from last week.”

For more on office occupancy, read: This stat about offices reminds us things are far from normal 🏢
🏭 Business investment activity ticks lower. Orders for nondefense capital goods excluding aircraft — a.k.a. core capex or business investment — declined 0.3% to $74.99 billion in February.

Core capex orders are a leading indicator, meaning they foretell economic activity down the road. The growth rate had leveled off a bit, but they’ve perked up in recent months.
For more on core capex, read: 'Check yourself' as the data zig zags ↯ and 9 once-hot economic charts that cooled 📉
👍 Activity survey signals growth. From S&P Global’s March Flash U.S. PMI: “A welcome upturn in service sector activity in March has helped propel stronger economic growth at the end of the first quarter. However, the survey data are indicative of the economy growing at an annualized 1.9% rate in March and just 1.5% over the quarter as a whole, pointing to a slowing of GDP growth compared to the end of 2024. Near-term risks also seem tilted to the downside. Growth is concentrated in the service sector as manufacturing fell back into decline after the frontrunning of tariffs had temporarily boosted factory output in the first two months of the year. Similarly, some of the March upturn in services was reportedly due to business picking up after adverse weather conditions had dampened activity across many states in January and February, which could prove a temporary bounce.“

At the same time inflationary pressures appear to be building. From the report: “A key concern over tariffs is the impact on inflation, with the March survey indicating a further sharp rise in costs as suppliers pass tariff-related price hikes on to US companies. Firms' costs are now rising at the steepest rate for nearly two years, with factories increasingly passing these higher costs onto customers. Thankfully, from the Federal Reserve’s perspective, services inflation remains relatively subdued, but this reflects the need to keep prices low amid weak demand, which will harm profits.“

Keep in mind that during times of perceived stress, soft survey data tends to be more exaggerated than actual hard data.
For more on this, read: What businesses do > what businesses say 🙊
📉 Near-term GDP growth estimates are tracking negative. The Atlanta Fed’s GDPNow model sees real GDP growth declining at a 2.8% rate in Q1. Adjusted for the impact of gold imports and exports, they see GDP falling at a 0.5% rate.

For more on the economy, read: 9 once-hot economic charts that cooled 📉
Putting it all together 🤔
Earnings look bullish: The long-term outlook for the stock market remains favorable, bolstered by expectations for years of earnings growth. And earnings are the most important driver of stock prices.
Demand is positive: Demand for goods and services remains positive, supported by strong consumer and business balance sheets. Job creation, while cooling, also remains positive, and the Federal Reserve — having resolved the inflation crisis — has shifted its focus toward supporting the labor market.
But growth is cooling: While the economy remains healthy, growth has normalized from much hotter levels earlier in the cycle. The economy is less “coiled” these days as major tailwinds like excess job openings have faded. It has become harder to argue that growth is destiny.
Actions speak louder than words: We are in an odd period given that the hard economic data has decoupled from the soft sentiment-oriented data. Consumer and business sentiment has been relatively poor, even as tangible consumer and business activity continue to grow and trend at record levels. From an investor’s perspective, what matters is that the hard economic data continues to hold up.
Stocks look better than the economy: Analysts expect the U.S. stock market could outperform the U.S. economy, thanks largely due to positive operating leverage. Since the pandemic, companies have adjusted their cost structures aggressively. This has come with strategic layoffs and investment in new equipment, including hardware powered by AI. These moves are resulting in positive operating leverage, which means a modest amount of sales growth — in the cooling economy — is translating to robust earnings growth.
Mind the ever-present risks: Of course, this does not mean we should get complacent. There will always be risks to worry about — such as U.S. political uncertainty, geopolitical turmoil, energy price volatility, cyber attacks, etc. There are also the dreaded unknowns. Any of these risks can flare up and spark short-term volatility in the markets.
Investing is never a smooth ride: There’s also the harsh reality that economic recessions and bear markets are developments that all long-term investors should expect to experience as they build wealth in the markets. Always keep your stock market seat belts fastened.
Think long term: For now, there’s no reason to believe there’ll be a challenge that the economy and the markets won’t be able to overcome over time. The long game remains undefeated, and it’s a streak long-term investors can expect to continue.
For more on how the macro story is evolving, check out the previous review of the macro crosscurrents »
Key insights about the stock market 📈
Here’s a roundup of some of TKer’s most talked-about paid and free newsletters about the stock market. All of the headlines are hyperlinked to the archived pieces.
10 truths about the stock market 📈
The stock market can be an intimidating place: It’s real money on the line, there’s an overwhelming amount of information, and people have lost fortunes in it very quickly. But it’s also a place where thoughtful investors have long accumulated a lot of wealth. The primary difference between those two outlooks is related to misconceptions about the stock market that can lead people to make poor investment decisions.
The makeup of the S&P 500 is constantly changing 🔀
Passive investing is a concept usually associated with buying and holding a fund that tracks an index. And no passive investment strategy has attracted as much attention as buying an S&P 500 index fund. However, the S&P 500 — an index of 500 of the largest U.S. companies — is anything but a static set of 500 stocks.

The key driver of stock prices: Earnings💰
For investors, anything you can ever learn about a company matters only if it also tells you something about earnings. That’s because long-term moves in a stock can ultimately be explained by the underlying company’s earnings, expectations for earnings, and uncertainty about those expectations for earnings. Over time, the relationship between stock prices and earnings have a very tight statistical relationship.

Stomach-churning stock market sell-offs are normal🎢
Investors should always be mentally prepared for some big sell-offs in the stock market. It’s part of the deal when you invest in an asset class that is sensitive to the constant flow of good and bad news. Since 1950, the S&P 500 has seen an average annual max drawdown (i.e., the biggest intra-year sell-off) of 14%.
How the stock market performed around recessions 📉📈
Every recession in history was different. And the range of stock performance around them varied greatly. There are two things worth noting. First, recessions have always been accompanied by a significant drawdown in stock prices. Second, the stock market bottomed and inflected upward long before recessions ended.

In the stock market, time pays ⏳
Since 1928, the S&P 500 generated a positive total return more than 89% of the time over all five-year periods. Those are pretty good odds. When you extend the timeframe to 20 years, you’ll see that there’s never been a period where the S&P 500 didn’t generate a positive return.

What a strong dollar means for stocks 👑
While a strong dollar may be great news for Americans vacationing abroad and U.S. businesses importing goods from overseas, it’s a headwind for multinational U.S.-based corporations doing business in non-U.S. markets.

Economy ≠ Stock Market 🤷♂️
The stock market sorta reflects the economy. But also, not really. The S&P 500 is more about the manufacture and sale of goods. U.S. GDP is more about providing services.

Stanley Druckenmiller's No. 1 piece of advice for novice investors 🧐
…you don't want to buy them when earnings are great, because what are they doing when their earnings are great? They go out and expand capacity. Three or four years later, there's overcapacity and they're losing money. What about when they're losing money? Well, then they’ve stopped building capacity. So three or four years later, capacity will have shrunk and their profit margins will be way up. So, you always have to sort of imagine the world the way it's going to be in 18 to 24 months as opposed to now. If you buy it now, you're buying into every single fad every single moment. Whereas if you envision the future, you're trying to imagine how that might be reflected differently in security prices.
Peter Lynch made a remarkably prescient market observation in 1994 🎯
Some event will come out of left field, and the market will go down, or the market will go up. Volatility will occur. Markets will continue to have these ups and downs. … Basic corporate profits have grown about 8% a year historically. So, corporate profits double about every nine years. The stock market ought to double about every nine years… The next 500 points, the next 600 points — I don’t know which way they’ll go… They’ll double again in eight or nine years after that. Because profits go up 8% a year, and stocks will follow. That's all there is to it.
Warren Buffett's 'fourth law of motion' 📉
Long ago, Sir Isaac Newton gave us three laws of motion, which were the work of genius. But Sir Isaac’s talents didn’t extend to investing: He lost a bundle in the South Sea Bubble, explaining later, “I can calculate the movement of the stars, but not the madness of men.” If he had not been traumatized by this loss, Sir Isaac might well have gone on to discover the Fourth Law of Motion: For investors as a whole, returns decrease as motion increases.
Most pros can’t beat the market 🥊
According to S&P Dow Jones Indices (SPDJI), 65% of U.S. large-cap equity fund managers underperformed the S&P 500 in 2024. As you stretch the time horizon, the numbers get even more dismal. Over a three-year period, 85% underperformed. Over a 10-year period, 90% underperformed. And over a 20-year period, 92% underperformed. This 2023 performance follows 14 consecutive years in which the majority of fund managers in this category have lagged the index.

Proof that 'past performance is no guarantee of future results' 📊
S&P Dow Jones Indices found that funds beat their benchmark in a given year are rarely able to continue outperforming in subsequent years. For example, 334 large-cap equity funds were in the top half of performance in 2021. Of those funds, 58.7% came in the top half again in 2022. But just 6.9% were able to extend that streak through 2023. If you set the bar even higher and consider those in the top quartile of performance, just 20.1% of 164 large-cap funds remained in the top quartile in 2022. No large-cap funds were able to stay in the top quartile for the three consecutive years ending in 2023.

The odds are stacked against stock pickers 🎲
Picking stocks in an attempt to beat market averages is an incredibly challenging and sometimes money-losing effort. In fact, most professional stock pickers aren’t able to do this on a consistent basis. One of the reasons for this is that most stocks don’t deliver above-average returns. According to S&P Dow Jones Indices, only 24% of the stocks in the S&P 500 outperformed the average stock’s return from 2000 to 2022. Over this period, the average return on an S&P 500 stock was 390%, while the median stock rose by just 93%.
