

The stock market will often fall on its way up 🛗
The stock market will often fall on its way up 🛗
Plus a charted review of the macro crosscurrents 🔀

Stocks fell to kick off 2024, with the S&P 500 shedding 1.5% to close the week at 4,697.24. The index is now up 31.3% from its October 12, 2022 closing low of 3,577.03 and down 2% from its January 3, 2022 record closing high of 4,796.56.
Nothing triggers investor anxiety like a weak week for stocks.
“Rollercoaster rides are unnerving on the way up and then thrilling on the way down,” veteran Wall Street strategist Ed Yardeni wrote on Thursday. “Stock markets are thrilling on the way up and unnerving on the way down.“
After an impressive streak of gains — like the nine consecutive weeks of positive returns we had to end 2023 — a negative week can be a valuable reminder that while stocks usually go up, they don’t always go up.

Let’s review some market history.
The chart below from Carson Group’s Ryan Detrick shows that in an average year, the S&P sees at least seven separate dips of at least 3%, three separate pullbacks of at least 5%, and one correction of at least 10%.

“Volatility is the toll we pay to invest,” Detrick said. Indeed.
In the moment, a big intra-year selloff can be understandably unsettling. But they happen all the time.
Check out the chart below from JPMorgan’s Guide To The Markets, which is my favorite visualization of short-term stock market performance.
Going back to 1980, the chart shows each year’s annual return for the S&P 500 in gray and its intra-year max drawdown (i.e., the biggest sell-off from its high of the year) in red. During this period, the S&P has seen an average annual max drawdown of 14% while ending positive in 33 of the 44 years measured. This means that in most years, the market has more than recovered the losses experienced in the max drawdown.

The bottom line: Stomach-churning sell-offs are normal.
‘Good years tend to follow great years’
Considering 2023’s above-average 24% surge in the S&P 500, it may be tempting to think “we’re due” for a bad year.
Sure, there have been a number of instances when bad years followed unusually strong years. Ritholtz Wealth Management’s Ben Carlson reviewed the history and found 16 instances when a year with double-digit gain was followed by a negative year.

At the same time, Carlson found that it’s far more common for double-digit gains to be followed by further gains.

So while we shouldn’t be too surprised if we get a weak year, history suggests we’re more likely to get positive returns.
“Since 1946, the S&P 500 has posted a positive annual price return 71% of the time,” CFRA’s Sam Stovall observed on Tuesday. “Each of these positive performances was then followed by an average increase of 6.9% and a 69% frequency of gain. However, after an annual surge of 20% or more, the S&P 500 rose an average 10.0% in the subsequent year and advanced 80% of the time, showing that good years tend to follow great years with an above-average return and frequency of gain.”
For more on how history bodes well for 2024, read: Stock market: Will it do what it usually does? 🛗
Sometimes we’ll get news that materially changes the big stories driving the fundamental outlook for the stock market. But more often than not, volatility-triggering news represents noise, not a major inflection point.
Zooming out 🔭
It continues to be the case that the stock market usually goes up. But it will also continue to be true that it won’t always go up.
So I think it can be helpful to keep stats like the ones above in mind.
While it’s fine to enjoy the many rallies, it’s good to stay grounded so that you don’t get swept up in so much exuberance that you start forming unreasonable expectations for the market. The last thing you want to do is panic at the first sign of volatility when history says volatility is normal.
-
Related from TKer:
My favorite visualization of short-term stock market performance 📊
The summer stock market slump and what Wall Street pros are saying about it 📉
Some unnerving stock market charts that may help you stay grounded 🧘🏻
A very long-term chart of U.S. stock prices usually going up 📈
Smart people agree that the best investing wisdom shares a common theme 🧐
Reviewing the macro crosscurrents 🔀
There were a few notable data points and macroeconomic developments from last week to consider:
👍 The labor market continues to add jobs. According to the BLS’s Employment Situation report released Friday, U.S. employers added 216,000 jobs in December. While the pace of job growth has generally been cooler, a 36th straight month of gains reaffirms an economy with robust demand for labor.

Employers added a whopping 2.7 million jobs in 2023. Total payroll employment is at a record 157.2 million jobs.

The unemployment rate — that is, the number of workers who identify as unemployed as a percentage of the civilian labor force — stood at 3.7% during the month. While it’s above its cycle low of 3.4%, it continues to hover near 50-year lows.

For more on the labor market, read: The hot but cooling labor market in 16 charts 📊🔥🧊
📉 Wage growth is cooling. Average hourly earnings rose by 0.44% month-over-month in December, up slightly from the 0.35% pace in November. On a year-over-year basis, this metric is up 4.1%, a rate that’s been cooling but remains elevated.

📈 Job switchers still get better pay. According to ADP, which tracks private payrolls and employs a different methodology than the BLS, annual pay growth in December for people who changed jobs was up 8% from a year ago. For those who stayed at their job, pay growth was 5.4%.

For more on the implications of cooling inflation, read: The bullish 'goldilocks' soft landing scenario that everyone wants 😀
💼 Job openings tick down. According to the BLS’s Job Openings and Labor Turnover Survey, employers had 8.79 million job openings in November. While this remains elevated above prepandemic levels, it’s down from the March 2022 high of 12.03 million.

During the period, there were 6.29 million unemployed people — meaning there were 1.4 job openings per unemployed person. This continues to be one of the most obvious signs of excess demand for labor.

For more on job openings, read: Were there really twice as many job openings as unemployed people? 🤨
👍 Layoffs remain depressed, hiring remains firm. Employers laid off 1.53 million people in November. While challenging for all those affected, this figure represents just 1.0% of total employment. This metric continues to trend below pre-pandemic levels.

Hiring activity continues to be much higher than layoff activity. During the month, employers hired 5.47 million people.

For more on why this metric matters, read: Watch hiring activity 👀
💼 Unemployment claims fall. Initial claims for unemployment benefits fell to 202,000 during the week ending December 30, down from 220,000 the week prior. While this is up from a September 2022 low of 182,000, it continues to trend at levels associated with economic growth.

For more on the labor market, read: The hot but cooling labor market in 16 charts 📊🔥🧊
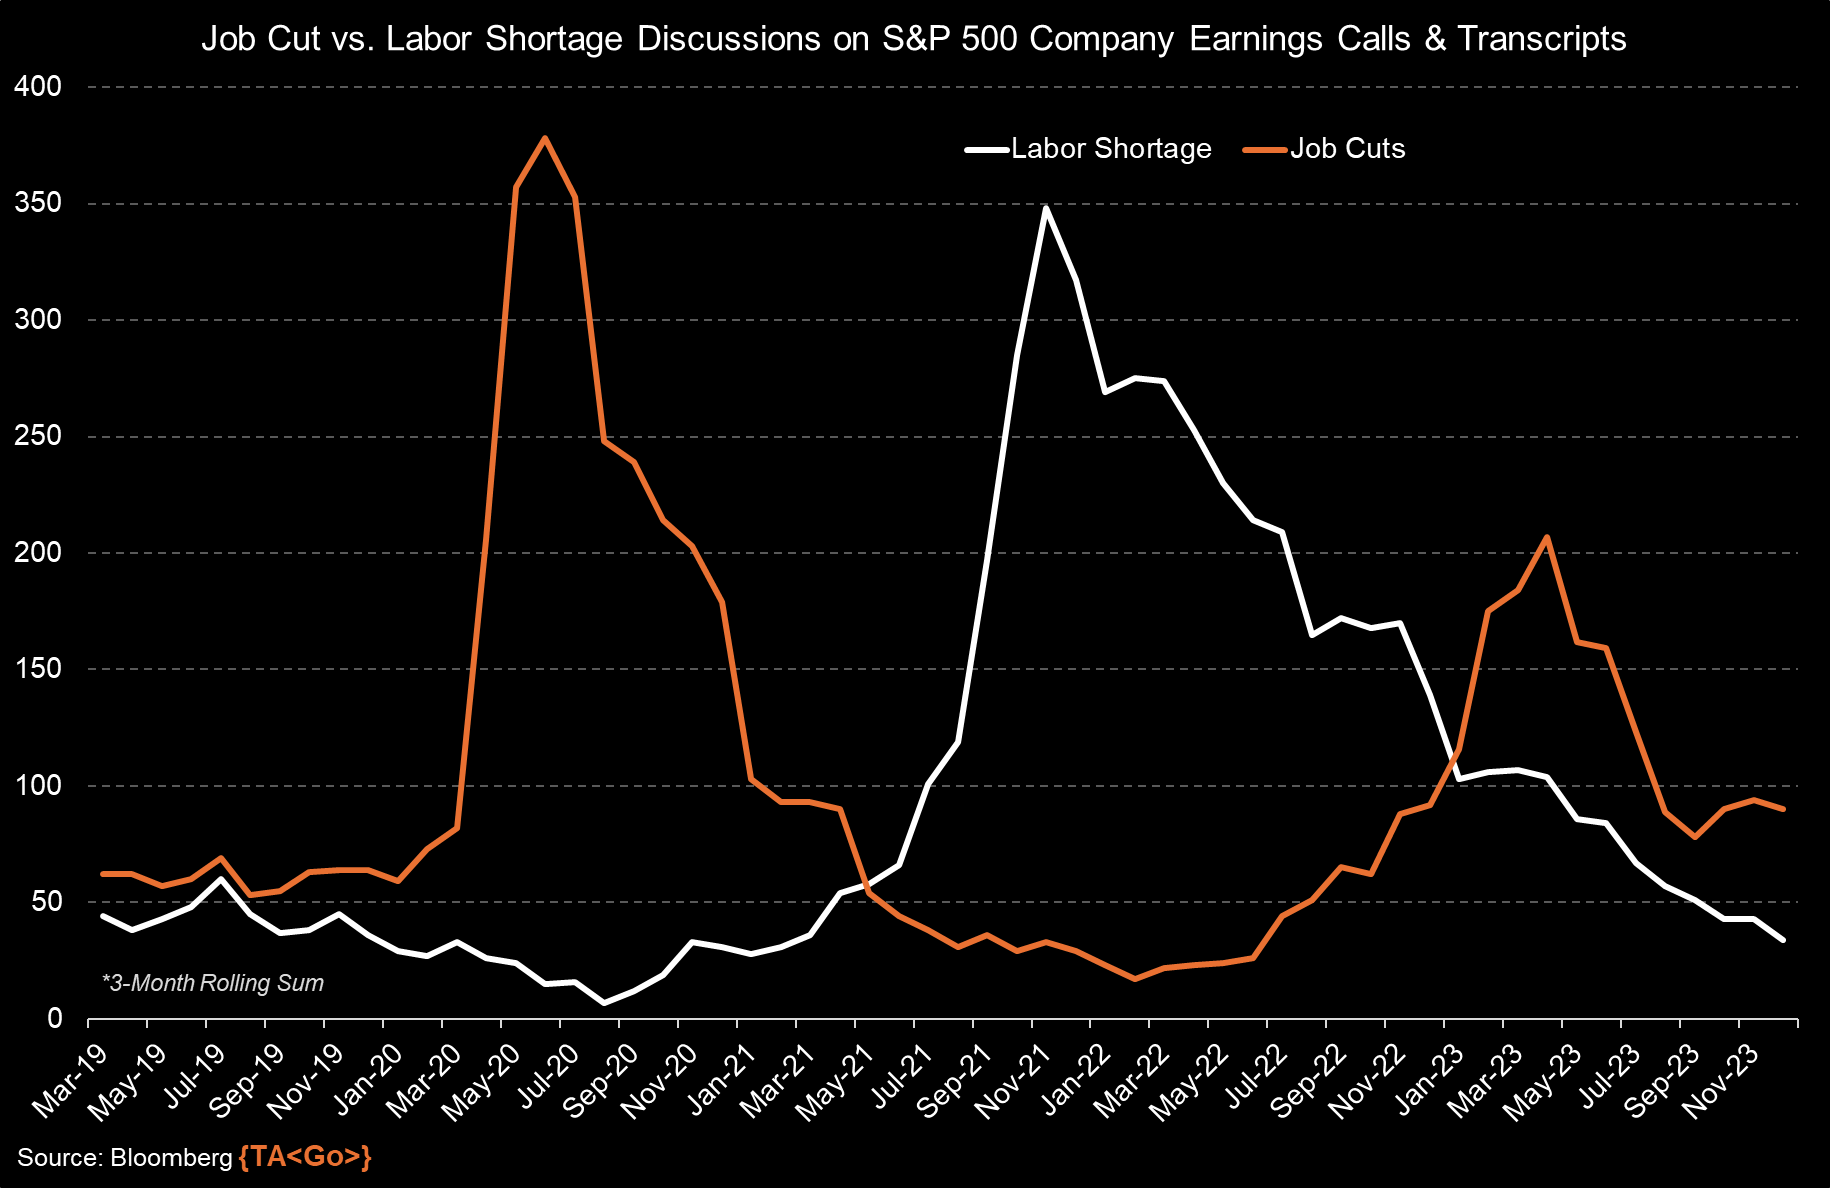
📉 Corporations are speaking less about labor shortages. From Bloomberg’s Michael McDonough: “Labor shortages seem to be receding into the rearview mirror, as evidenced by related mentions on S&P 500 earnings calls. Meanwhile, conversations around job cuts are still prominent, though they haven't reached the heights observed last spring.“
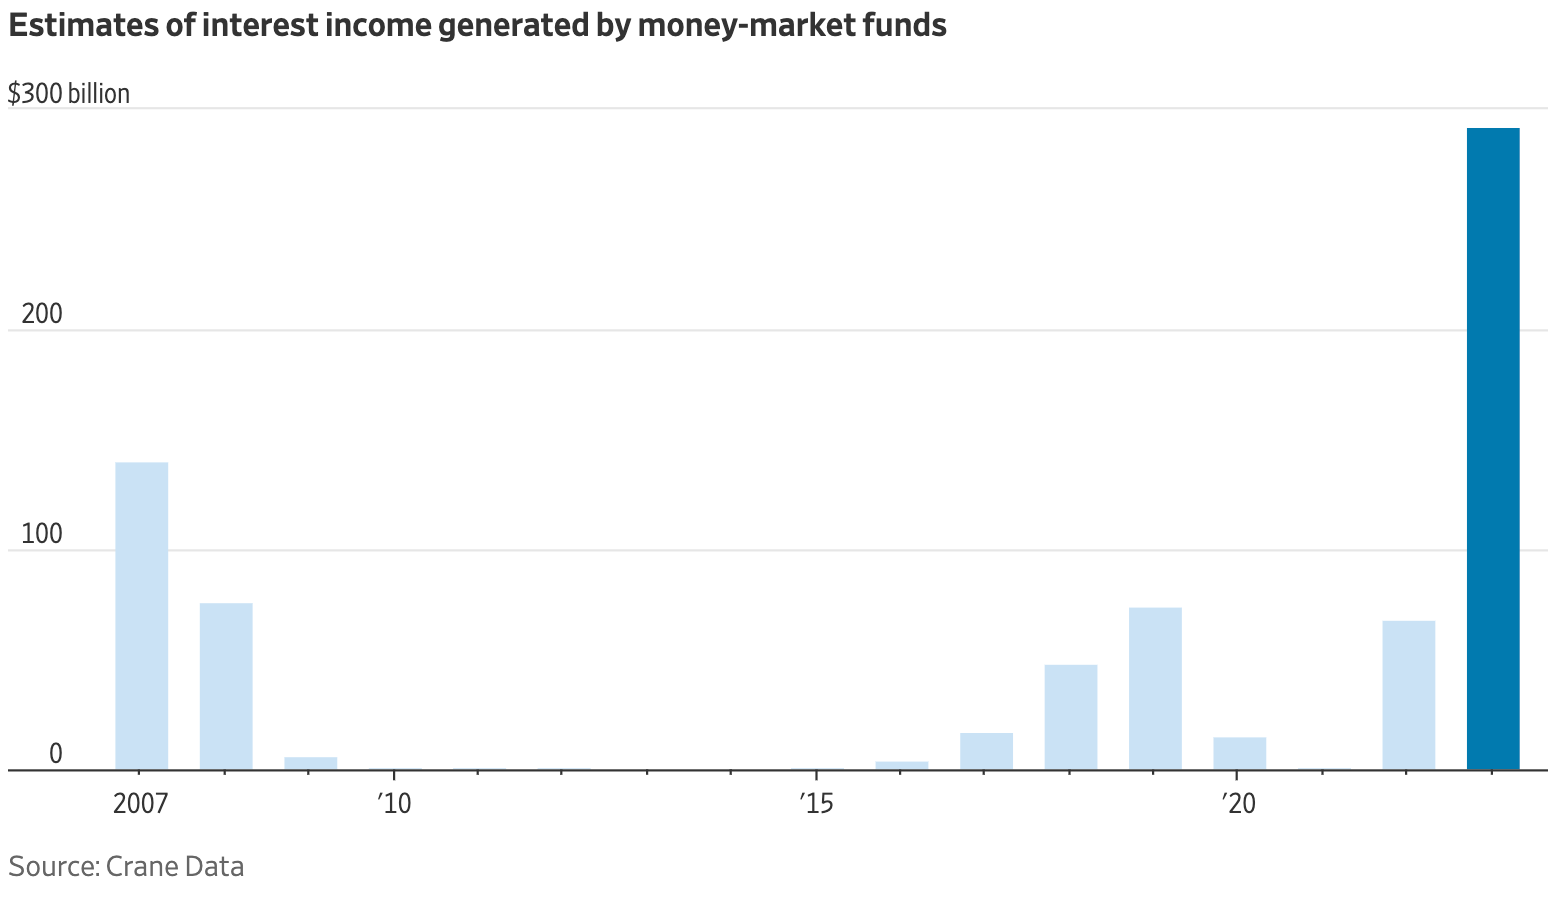
💰 Consumers have been earning interest. From WSJ’s Gunjan Banerji: “Americans generated ~$300 billion in interest income from money-market funds in 2023, according to estimates from Crane Data.“
👍 Card data suggest consumer spending is holding up. From BofA: “Total card spending per HH was up 1.0% y/y in the week ending Dec 30, according to BAC aggregated credit and debit card data. Spending on holiday items fell 1.3% y/y in the week ending Dec 30. ... However, in the five weeks since Thanksgiving, spending on holiday items was up 0.3% compared to the same period last year.”

For more on what’s driving spending, read: People have money 💵
🚗 Vehicle sales rise. From Wards Auto via Calculated Risk: “December U.S. Light-Vehicle Sales Hit 5-Month High; Entire 2023 Totals 4-Year Best 15.5 Million… Labor-related plant shutdowns in the U.S. that covered the latter half of September and most of October negatively impacted deliveries in November. Combined sales of the vehicles impacted by shutdowns fell 15% year-over-year in November. If those vehicles had matched year-ago results, sales would have totaled a 15.9 million-unit SAAR.”

⛽️ Gas prices continue to fall. From AAA: “The national average for a gallon of gas dipped slightly by three cents since last week to $3.09. One reason could be lower demand, as fewer people are fueling up after the peak of holiday road travel… According to new data from the Energy Information Administration (EIA), gas demand nosedived from 9.17 to 7.95 million b/d last week. Meanwhile, total domestic gasoline stocks increased substantially by 10.9 million bbl to 237 million bbl. Weak gas demand, alongside increased supply, has pushed pump prices lower. However, rising oil prices have limited price decreases.”

For more on energy prices, read: The other side of the surging oil price story 🛢
🏠 Mortgage rates tick up. According to Freddie Mac, the average 30-year fixed-rate mortgage rose to 6.62% from 6.61% the week prior. From Freddie Mac: “Between late October and mid-December, the 30-year fixed-rate mortgage plummeted more than a percentage point. However, since then rates have moved sideways as the market digests incoming economic data. Given the expectation of rate cuts this year from the Federal Reserve, as well as receding inflationary pressures, mortgage rates will likely continue to drift downward as the year unfolds. While lower mortgage rates are welcome news, potential homebuyers are still dealing with the dual challenges of low inventory and high home prices that continue to rise.”

For more on home prices, read: Why home prices and rents are creating all sorts of confusion about inflation 😖
⛓️ Supply chain pressures loosen. The New York Fed’s Global Supply Chain Pressure Index — a composite of various supply chain indicators — ticked lower in December and remains below levels seen even before the pandemic. That's way down from its December 2021 supply chain crisis high.

For more on the supply chain, read: We can stop calling it a supply chain crisis ⛓
👎 Services survey signals slowing growth. The ISM’s December Services PMI reflected growth in the sector but at a decelerating pace.

The survey’s employment subindex reflected the sharpest contraction in hiring since May 2020.

🏭 Manufacturing survey signal contraction. S&P Global’s December Manufacturing PMI signaled deterioration in the sector. From the report: “Output fell at the fastest rate for six months as the recent order book decline intensified. Manufacturing will therefore likely have acted as a drag on the economy in the fourth quarter.“

The ISM’s December Manufacturing PMI improved slightly for the month, but still signaled contraction for the 14th consecutive month.

It’s worth remembering that soft data like the PMI surveys don’t necessarily reflect what’s actually going on in the economy.
For more on this, read: What businesses do > what businesses say 🙊
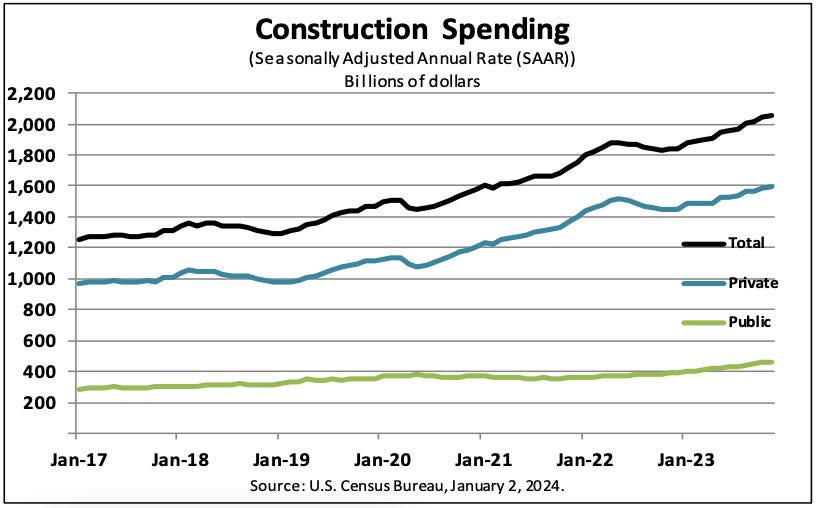
🔨 Construction spending rises. Construction spending rose 0.4% to an annual rate of $2.05 trillion in November.
For more on broad measures of the U.S. economy, read: Still waiting for that recession people have been worried about 🕰️
👀 Business investment picks up. Orders for nondefense capital goods excluding aircraft — a.k.a. core capex or business investment — rose 0.8% to a record $73.97 billion in November.

📈 Near-term GDP growth estimates improve. The Atlanta Fed’s GDPNow model sees real GDP growth climbing at a 2.5% rate in Q4.

For more on the forces bolstering economic growth, read: 9 reasons to be optimistic about the economy and markets 💪
Putting it all together 🤔
We continue to get evidence that we are experiencing a bullish “Goldilocks” soft landing scenario where inflation cools to manageable levels without the economy having to sink into recession.
This comes as the Federal Reserve continues to employ very tight monetary policy in its ongoing effort to bring inflation down. While it’s true that the Fed has taken a less hawkish tone in 2023 than in 2022, and that most economists agree that the final interest rate hike of the cycle has either already happened or is near, inflation still has to cool more and stay cool for a little while before the central bank is comfortable with price stability.
So we should expect the central bank to keep monetary policy tight, which means we should be prepared for tight financial conditions (e.g., higher interest rates, tighter lending standards, and lower stock valuations) to linger. All this means monetary policy will be unfriendly to markets for the time being, and the risk the economy slips into a recession will be relatively elevated.
At the same time, we also know that stocks are discounting mechanisms — meaning that prices will have bottomed before the Fed signals a major dovish turn in monetary policy.
Also, it’s important to remember that while recession risks may be elevated, consumers are coming from a very strong financial position. Unemployed people are getting jobs, and those with jobs are getting raises.
Similarly, business finances are healthy as many corporations locked in low interest rates on their debt in recent years. Even as the threat of higher debt servicing costs looms, elevated profit margins give corporations room to absorb higher costs.
At this point, any downturn is unlikely to turn into economic calamity given that the financial health of consumers and businesses remains very strong.
And as always, long-term investors should remember that recessions and bear markets are just part of the deal when you enter the stock market with the aim of generating long-term returns. While markets have had a pretty rough couple of years, the long-run outlook for stocks remains positive.
For more on how the macro story is evolving, check out the the previous TKer macro crosscurrents »
TKer’s best insights about the stock market 📈
Here’s a roundup of some of TKer’s most talked-about paid and free newsletters about the stock market. All of the headlines are hyperlinked to the archived pieces.
10 truths about the stock market 📈
The stock market can be an intimidating place: It’s real money on the line, there’s an overwhelming amount of information, and people have lost fortunes in it very quickly. But it’s also a place where thoughtful investors have long accumulated a lot of wealth. The primary difference between those two outlooks is related to misconceptions about the stock market that can lead people to make poor investment decisions.
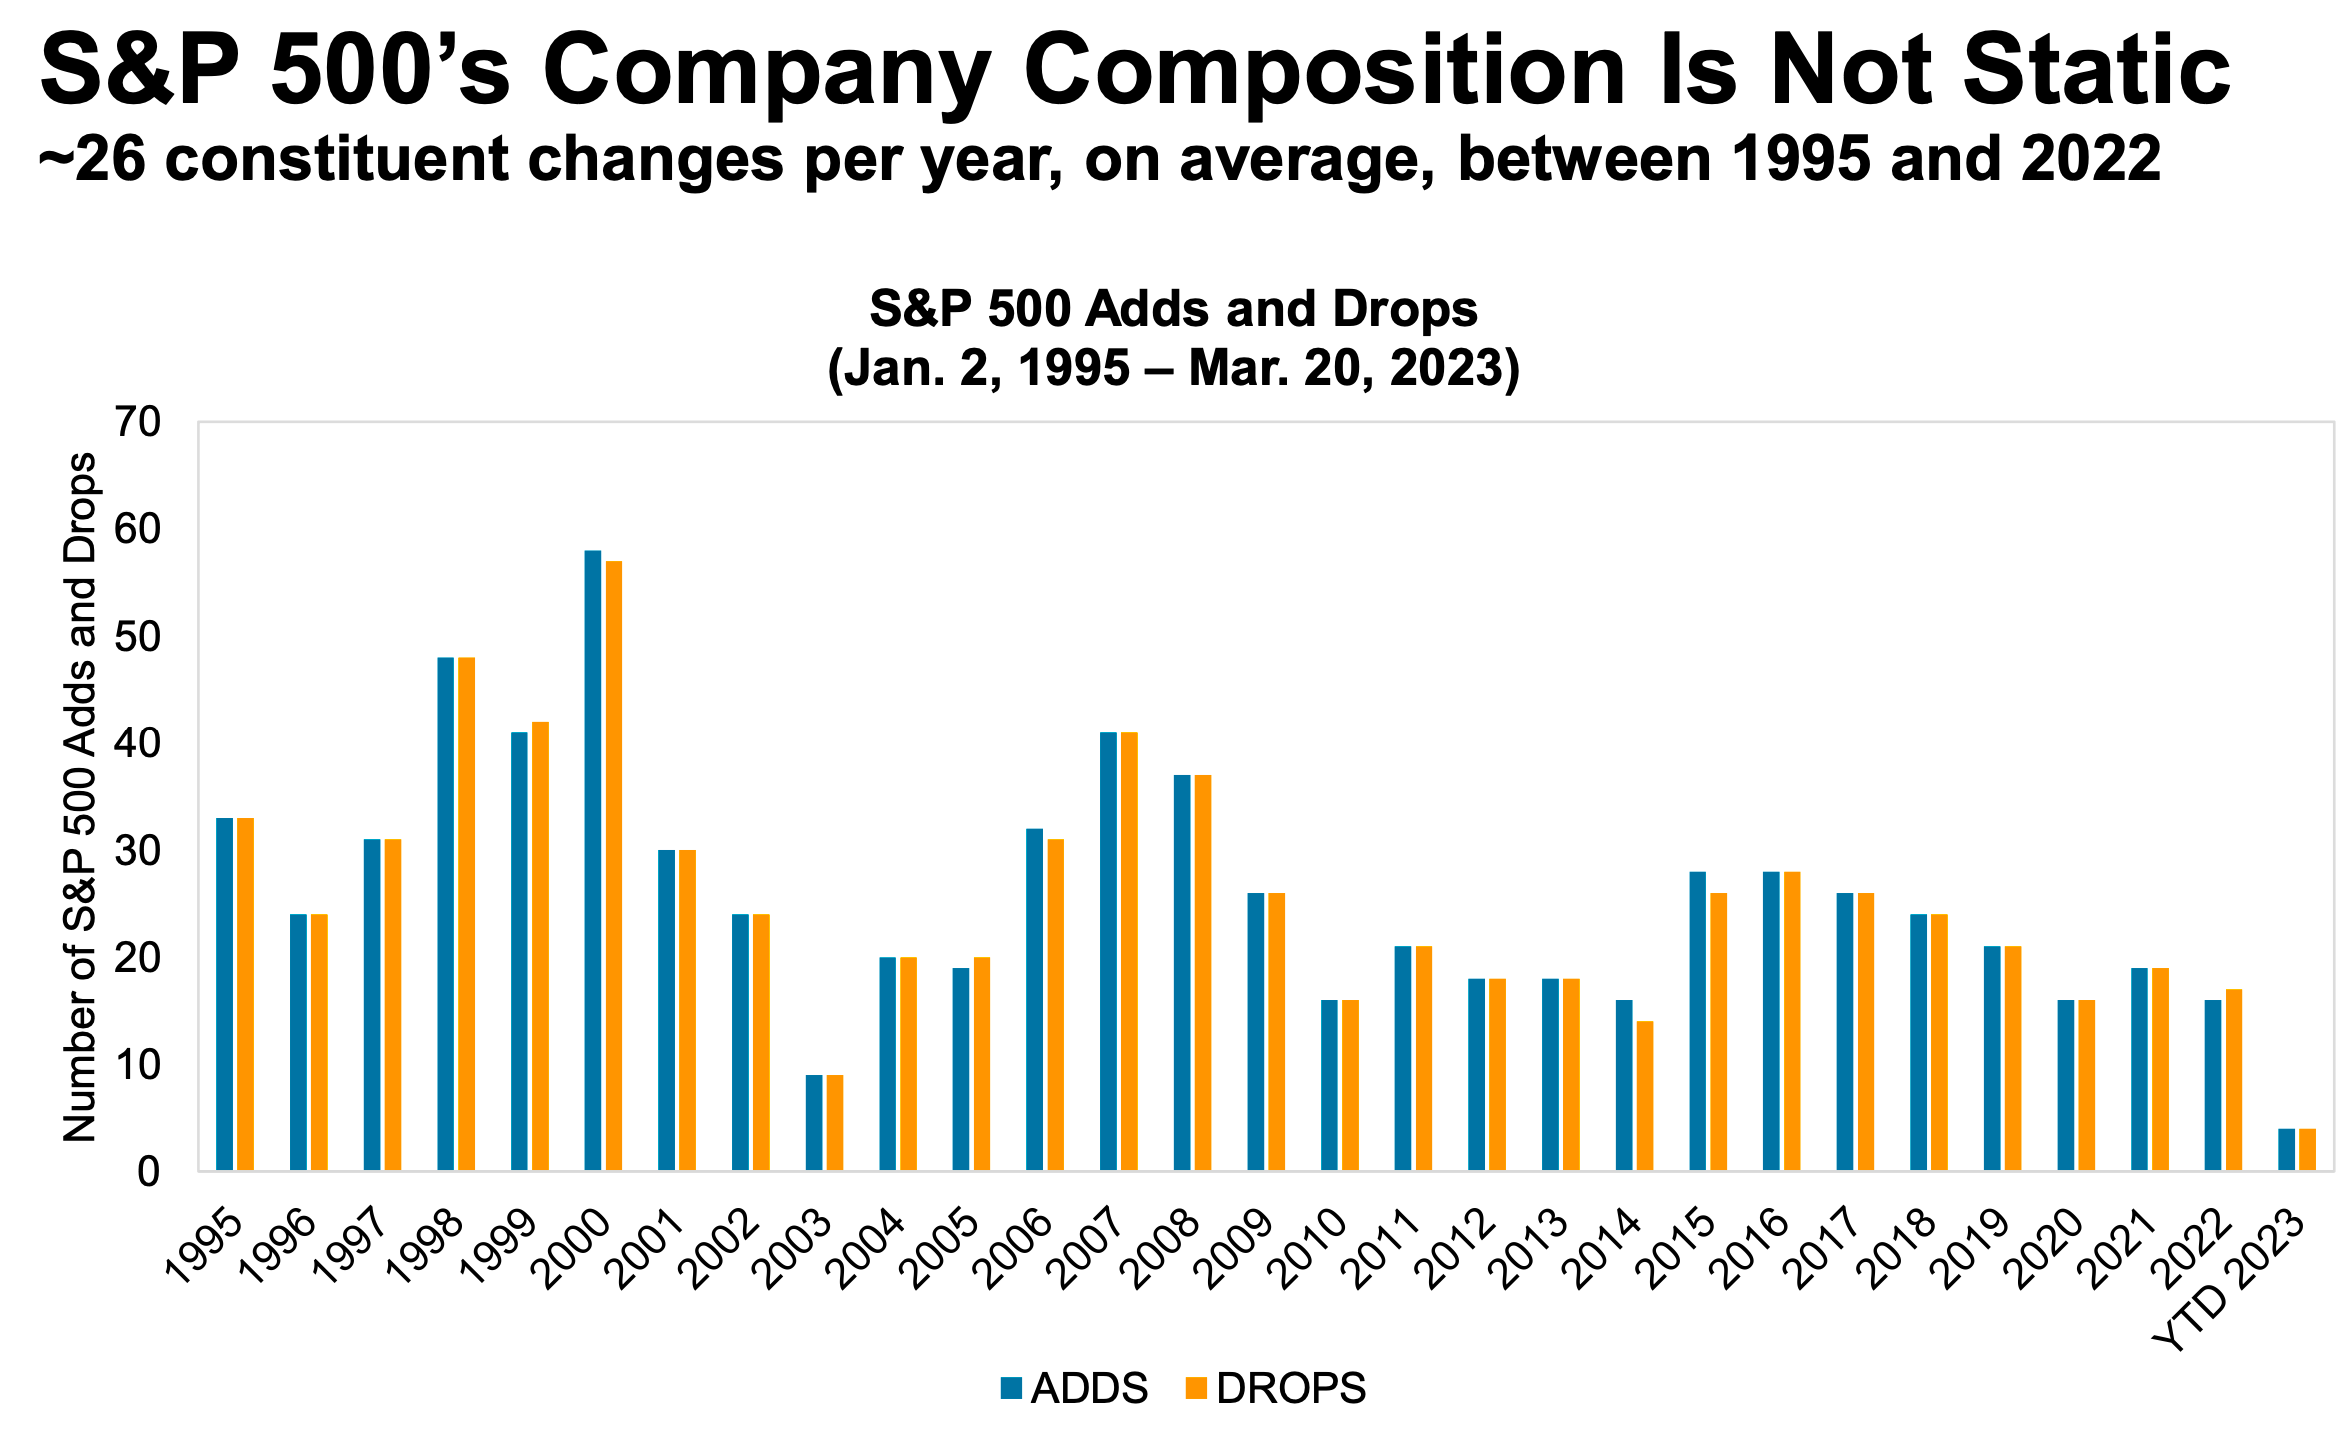
The makeup of the S&P 500 is constantly changing 🔀
Passive investing is a concept usually associated with buying and holding a fund that tracks an index. And no passive investment strategy has attracted as much attention as buying an S&P 500 index fund. However, the S&P 500 — an index of 500 of the largest U.S. companies — is anything but a static set of 500 stocks.
The key driver of stock prices: Earnings💰
For investors, anything you can ever learn about a company matters only if it also tells you something about earnings. That’s because long-term moves in a stock can ultimately be explained by the underlying company’s earnings, expectations for earnings, and uncertainty about those expectations for earnings. Over time, the relationship between stock prices and earnings have a very tight statistical relationship.

Stomach-churning stock market sell-offs are normal🎢
Investors should always be mentally prepared for some big sell-offs in the stock market. It’s part of the deal when you invest in an asset class that is sensitive to the constant flow of good and bad news. Since 1950, the S&P 500 has seen an average annual max drawdown (i.e., the biggest intra-year sell-off) of 14%.

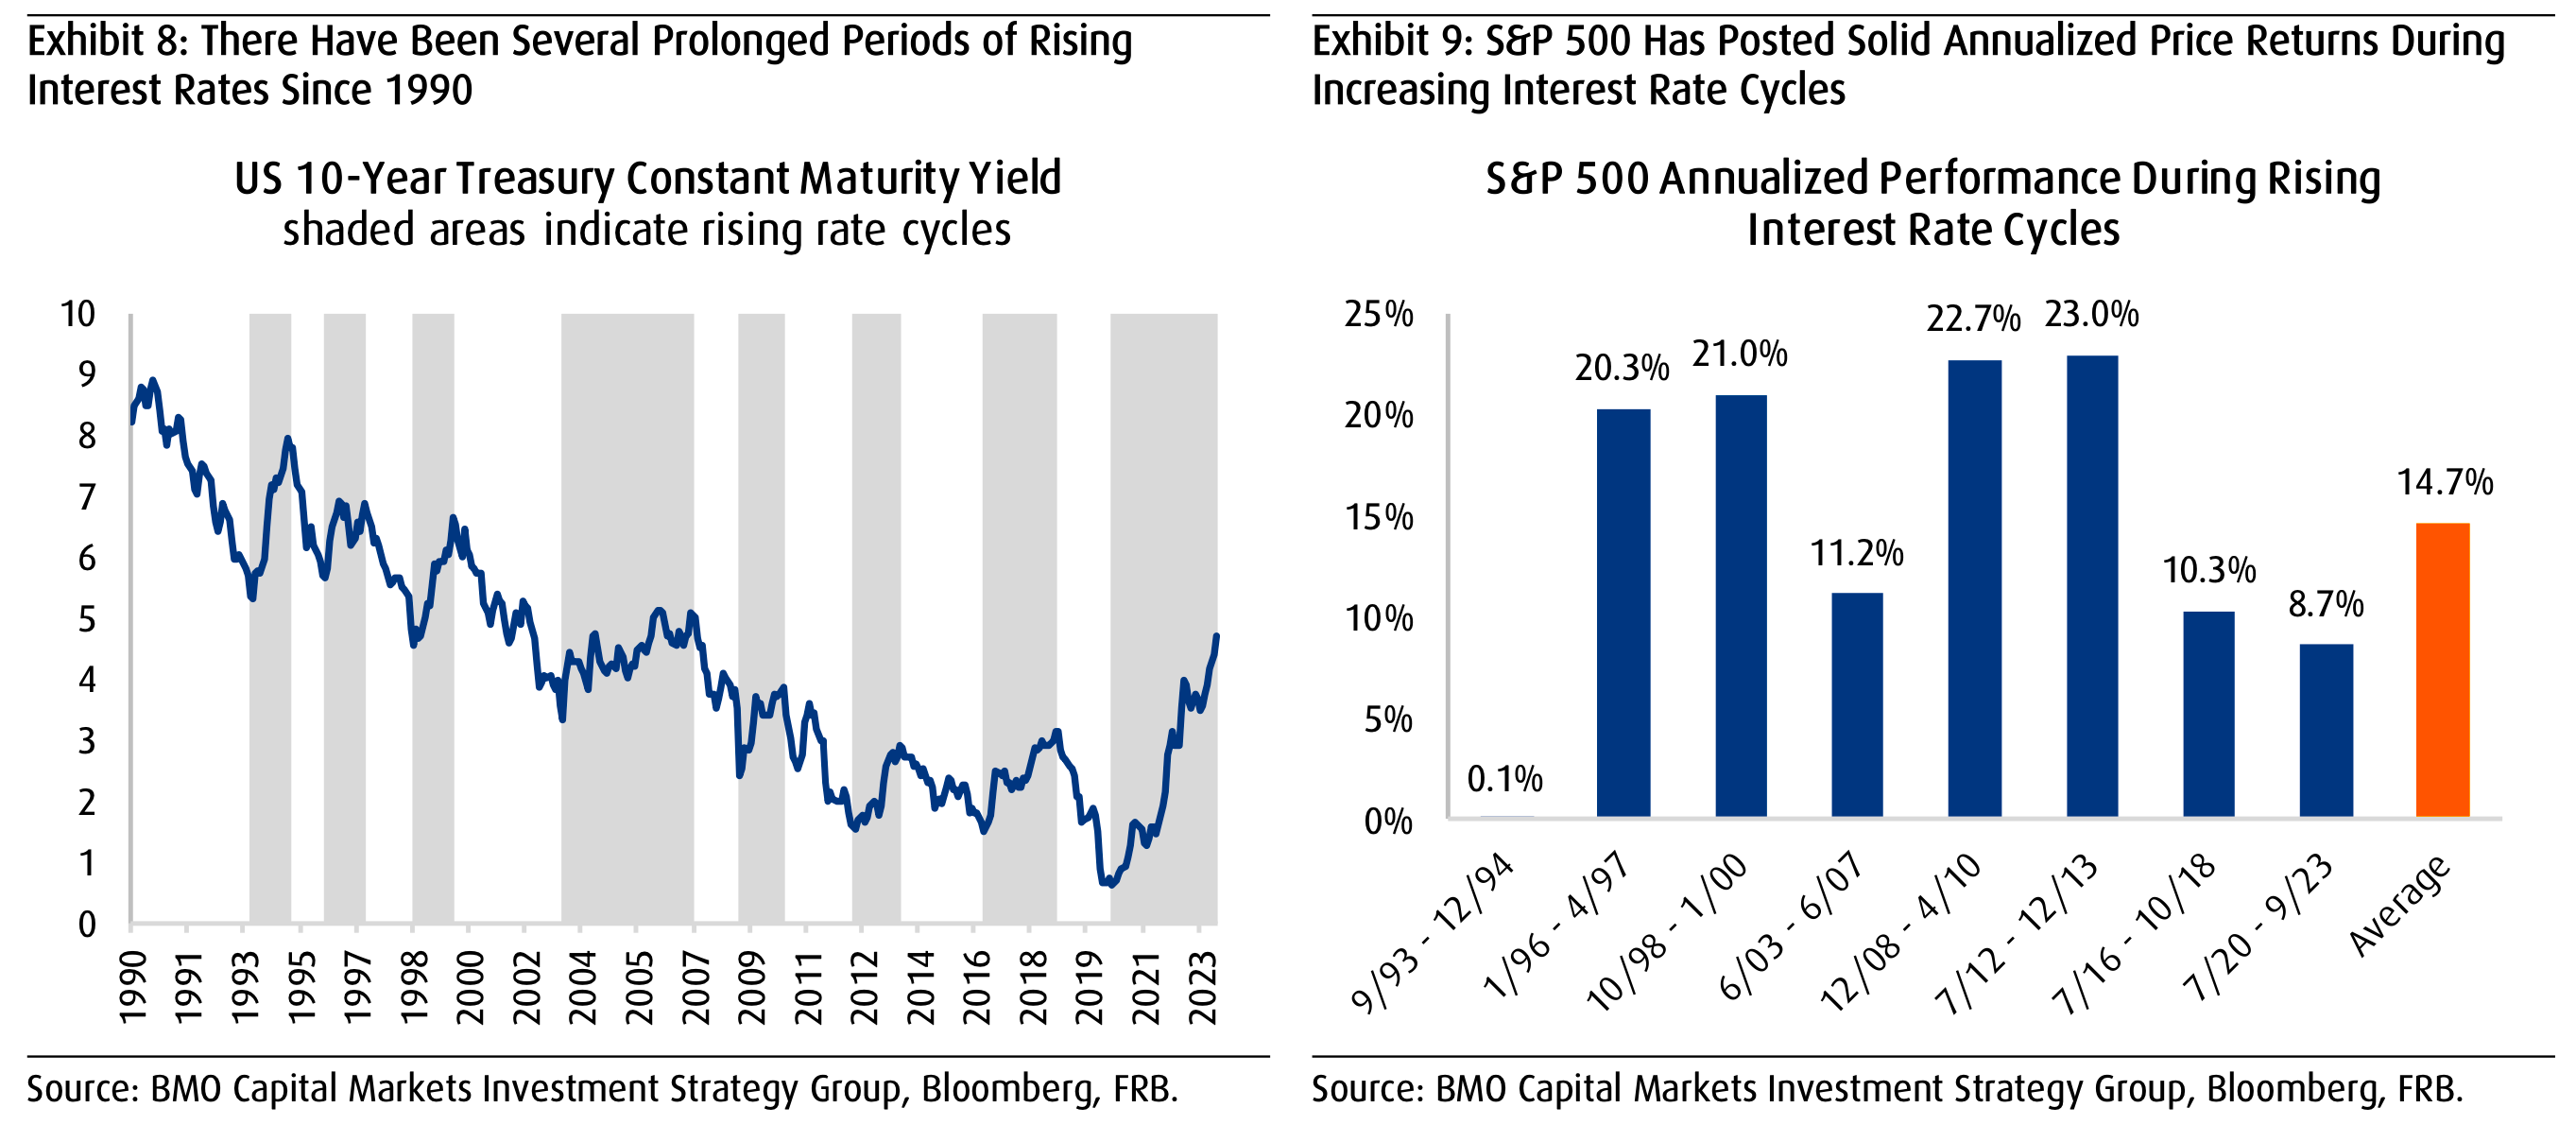
High and rising interest rates don't spell doom for stocks👍
Generally speaking, rising interest rates are not welcome news for the economy and the stock market. They represent higher financing costs for businesses and consumers. All other things being equal, rising rates represent a hindrance to growth. However, the world is complicated, and this narrative comes with a lot of nuance. One big counterintuitive piece to this narrative is that historically, stocks have actually performed well during periods of rising interest rates.
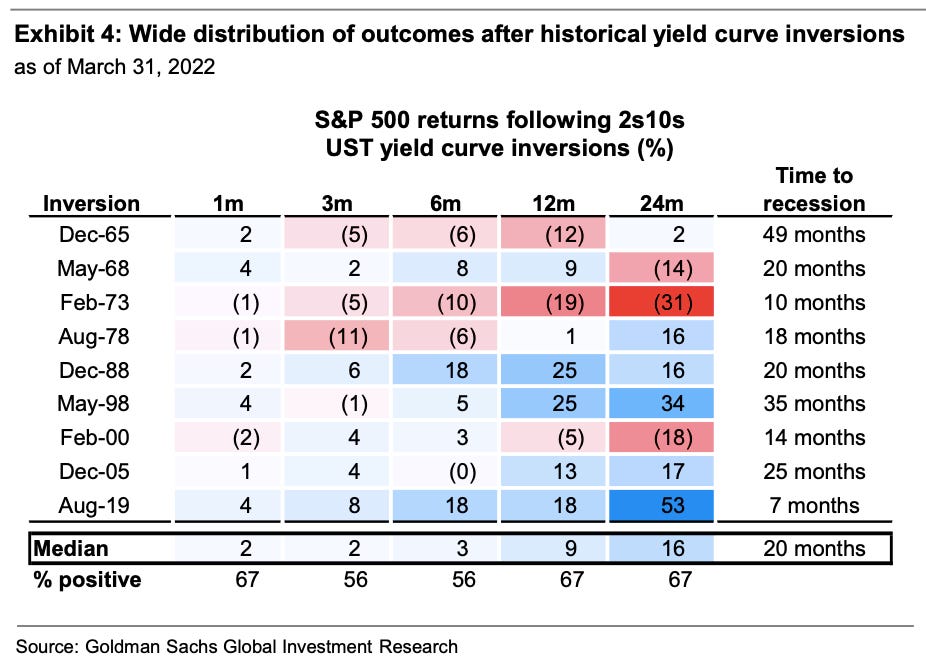
How stocks performed when the yield curve inverted ⚠️
There’ve been lots of talk about the “yield curve inversion,” with media outlets playing up that this bond market phenomenon may be signaling a recession. Admittedly, yield curve inversions have a pretty good track record of being followed by recessions, and recessions usually come with significant market sell-offs. But experts also caution against concluding that inverted yield curves are bulletproof leading indicators.
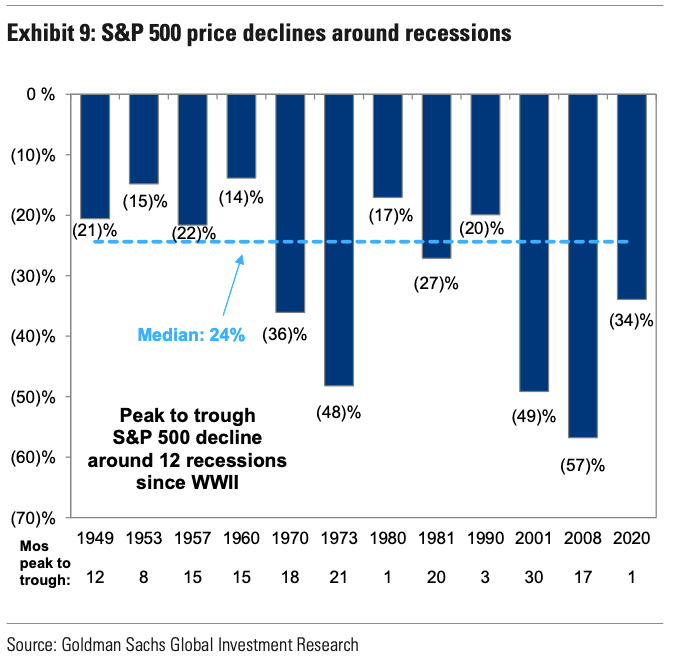
How the stock market performed around recessions 📉📈
Every recession in history was different. And the range of stock performance around them varied greatly. There are two things worth noting. First, recessions have always been accompanied by a significant drawdown in stock prices. Second, the stock market bottomed and inflected upward long before recessions ended.
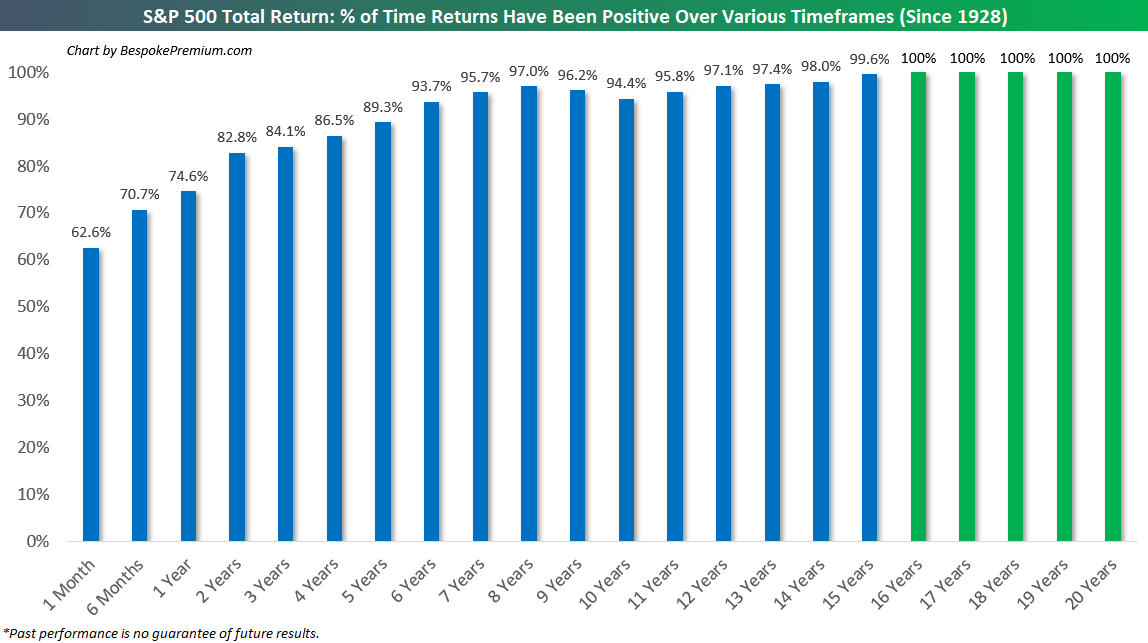
In the stock market, time pays ⏳
Since 1928, the S&P 500 generated a positive total return more than 89% of the time over all five-year periods. Those are pretty good odds. When you extend the timeframe to 20 years, you’ll see that there’s never been a period where the S&P 500 didn’t generate a positive return.
What a strong dollar means for stocks 👑
While a strong dollar may be great news for Americans vacationing abroad and U.S. businesses importing goods from overseas, it’s a headwind for multinational U.S.-based corporations doing business in non-U.S. markets.
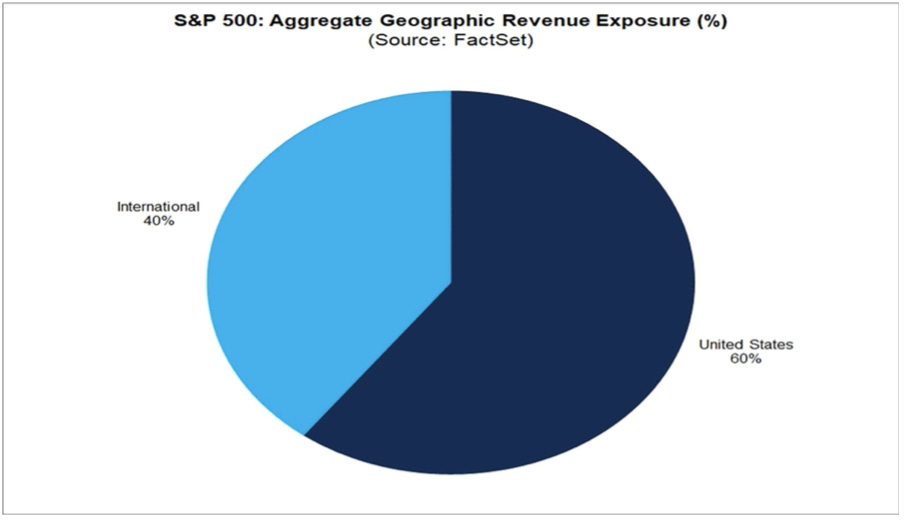
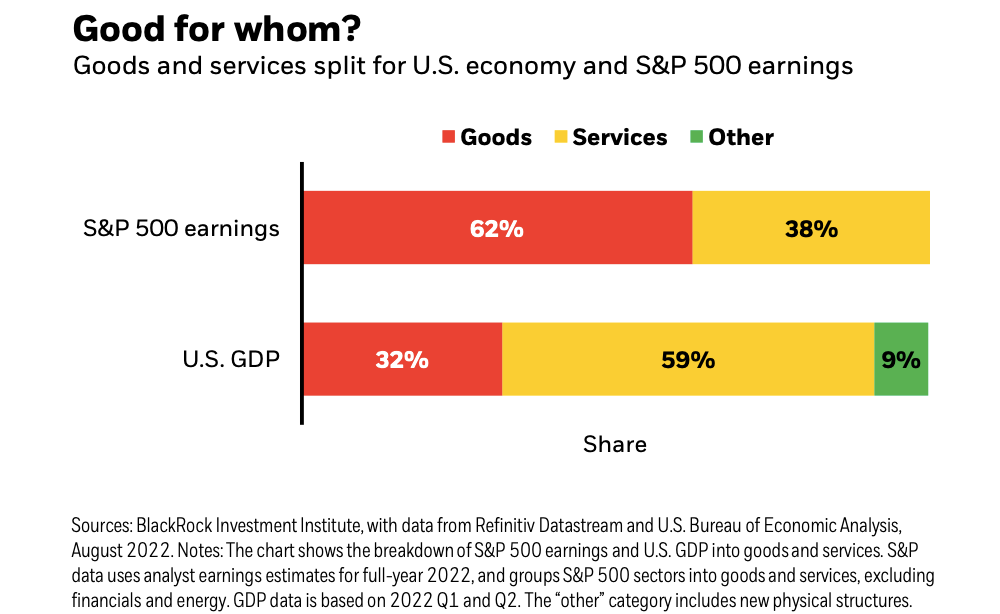
Economy ≠ Stock Market 🤷♂️
The stock market sorta reflects the economy. But also, not really. The S&P 500 is more about the manufacture and sale of goods. U.S. GDP is more about providing services.
Stanley Druckenmiller's No. 1 piece of advice for novice investors 🧐
…you don't want to buy them when earnings are great, because what are they doing when their earnings are great? They go out and expand capacity. Three or four years later, there's overcapacity and they're losing money. What about when they're losing money? Well, then they’ve stopped building capacity. So three or four years later, capacity will have shrunk and their profit margins will be way up. So, you always have to sort of imagine the world the way it's going to be in 18 to 24 months as opposed to now. If you buy it now, you're buying into every single fad every single moment. Whereas if you envision the future, you're trying to imagine how that might be reflected differently in security prices.
Peter Lynch made a remarkably prescient market observation in 1994 🎯
Some event will come out of left field, and the market will go down, or the market will go up. Volatility will occur. Markets will continue to have these ups and downs. … Basic corporate profits have grown about 8% a year historically. So, corporate profits double about every nine years. The stock market ought to double about every nine years… The next 500 points, the next 600 points — I don’t know which way they’ll go… They’ll double again in eight or nine years after that. Because profits go up 8% a year, and stocks will follow. That's all there is to it.
Warren Buffett's 'fourth law of motion' 📉
Long ago, Sir Isaac Newton gave us three laws of motion, which were the work of genius. But Sir Isaac’s talents didn’t extend to investing: He lost a bundle in the South Sea Bubble, explaining later, “I can calculate the movement of the stars, but not the madness of men.” If he had not been traumatized by this loss, Sir Isaac might well have gone on to discover the Fourth Law of Motion: For investors as a whole, returns decrease as motion increases.
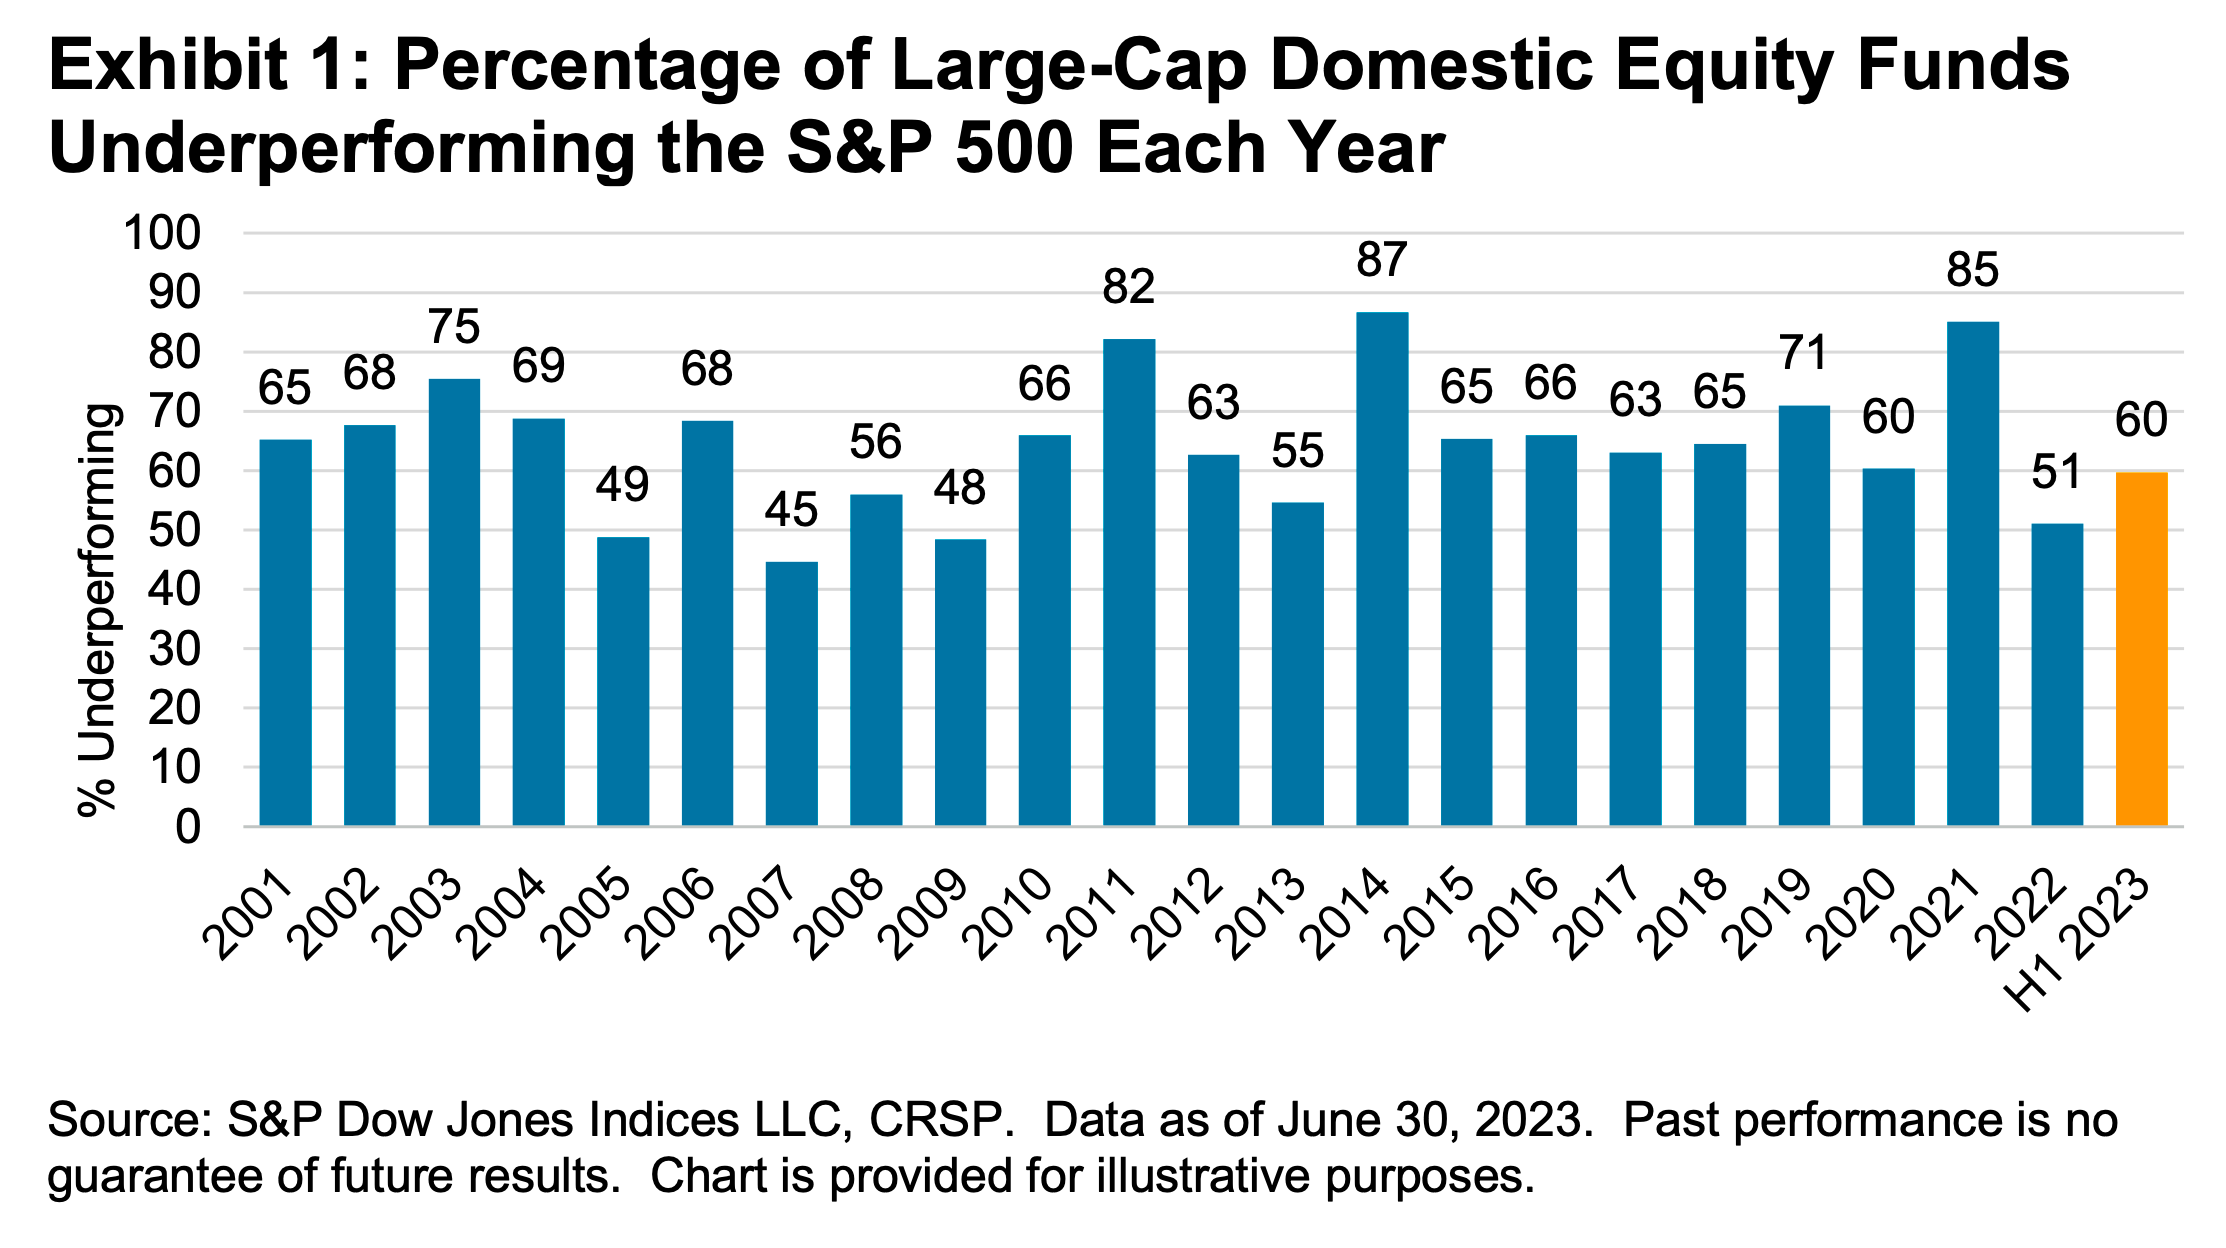
Most pros can’t beat the market 🥊
According to S&P Dow Jones Indices (SPDJI), 59.7% of U.S. large-cap equity fund managers underperformed the S&P 500 during the first half of 2023. As you stretch the time horizon, the numbers get more dismal. Over a three-year period, 79.8% underperformed. Over a 10-year period, 85.6% underperformed. And over a 20-year period, 93.6% underperformed.
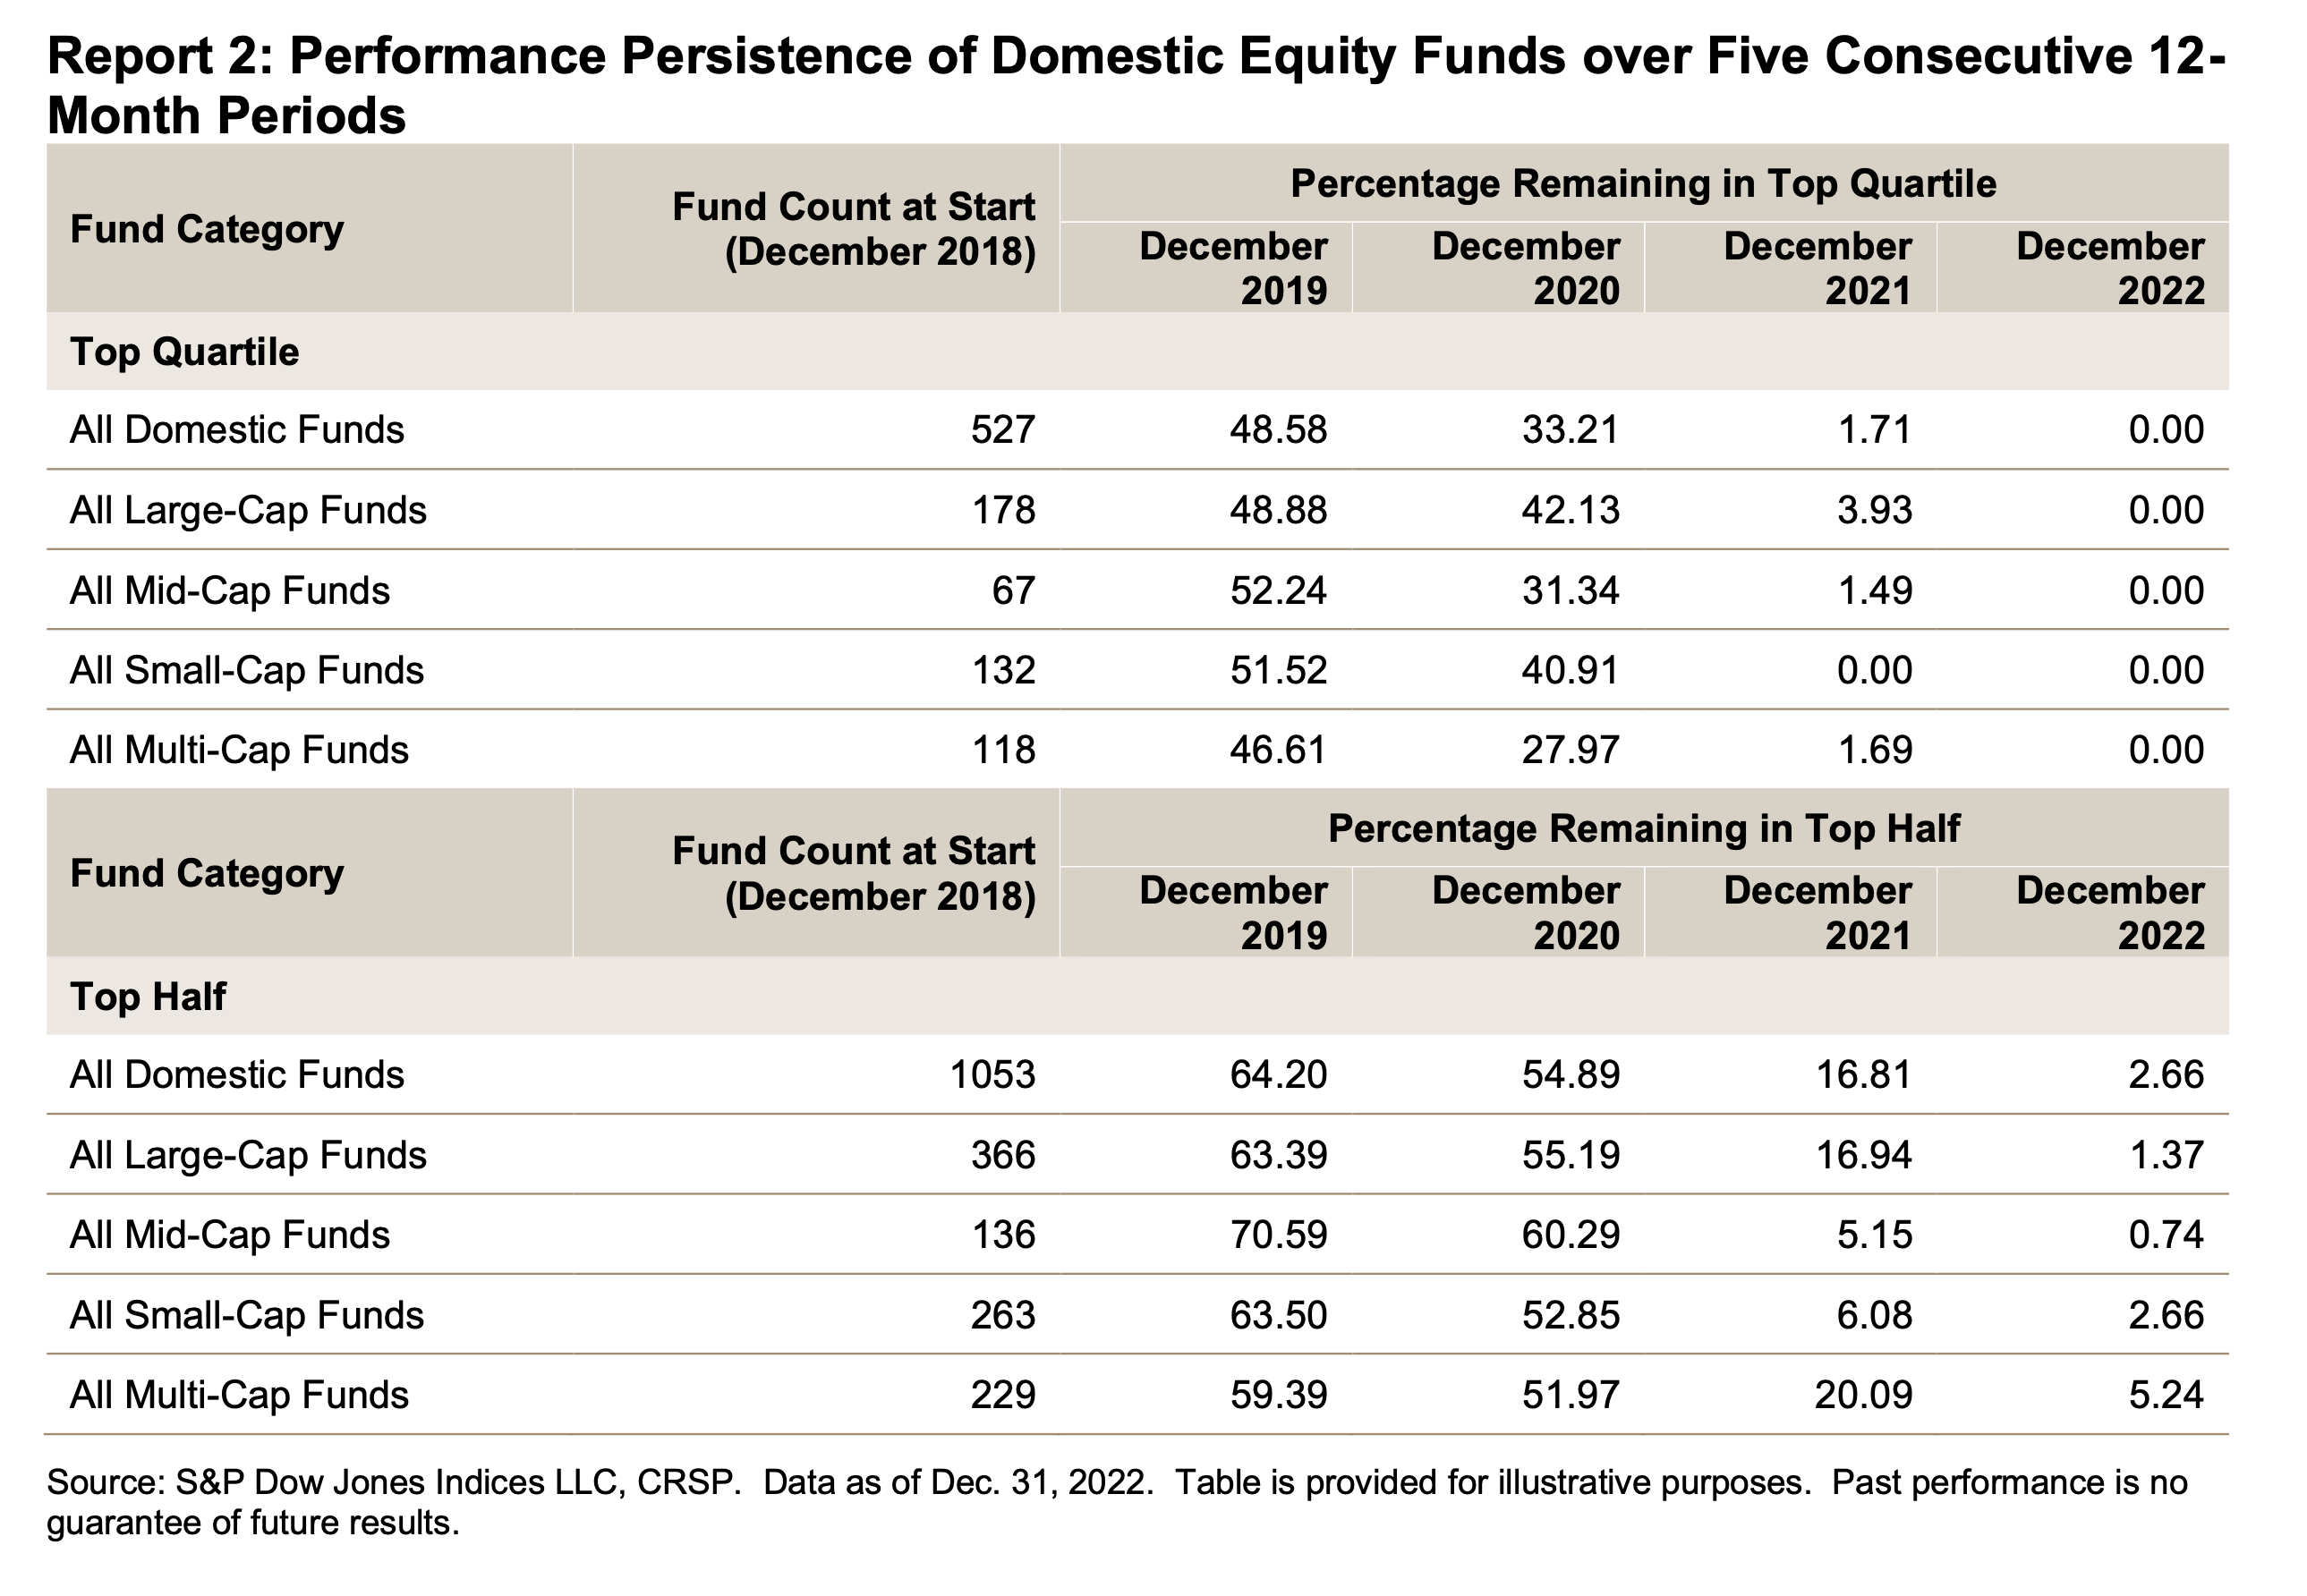
The sobering stats behind 'past performance is no guarantee of future results' 📊
S&P Dow Jones Indices found that funds beat their benchmark in a given year are rarely able to continue outperforming in subsequent years. For example, 318 large-cap equity funds were in the top half of performance in 2020. Of those funds, 39% came in the top half again in 2021, and just 5% were able to extend that streak through 2022. If you set the bar even higher and consider those in the top quartile of performance, just 7% of 156 large-cap funds remained in the top quartile in 2021. No large-cap funds were able to stay in the top quartile for the three consecutive years ending in 2022.
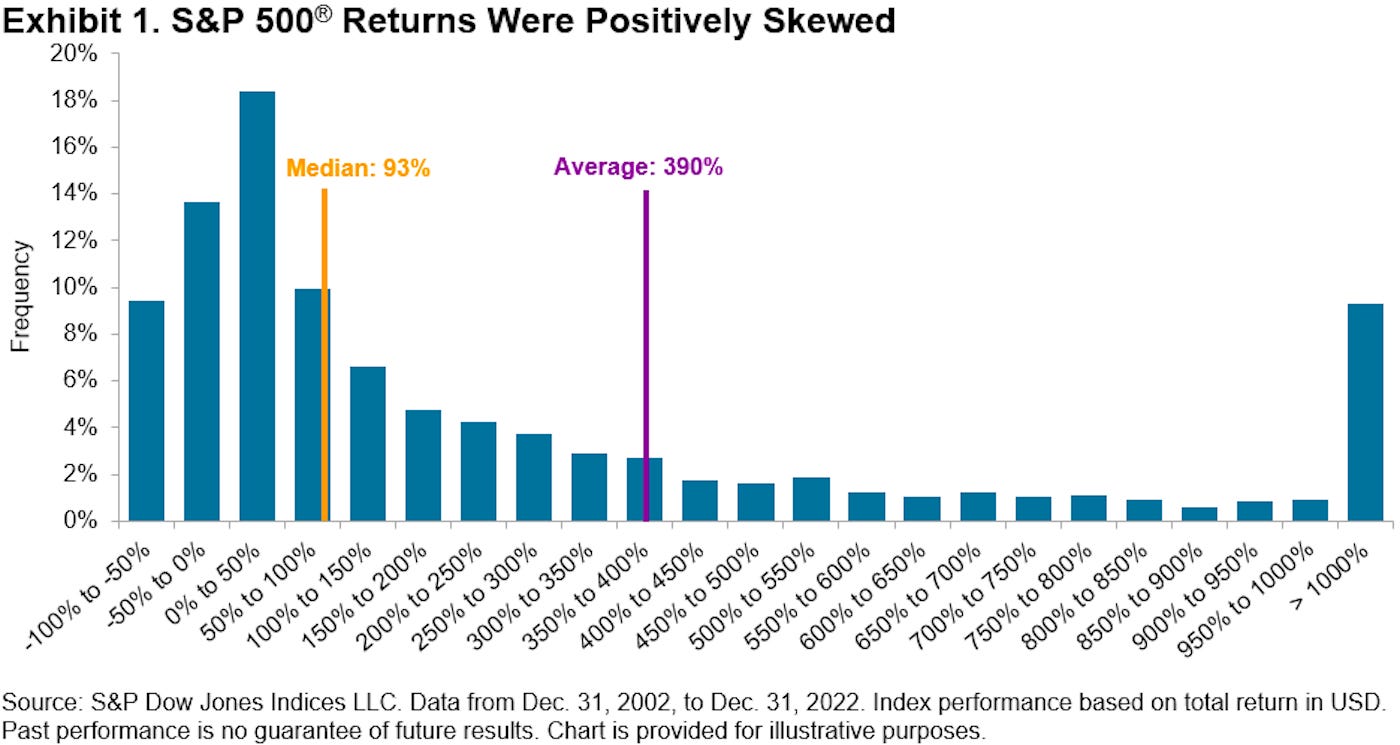
The odds are stacked against stock pickers 🎲
Picking stocks in an attempt to beat market averages is an incredibly challenging and sometimes money-losing effort. In fact, most professional stock pickers aren’t able to do this on a consistent basis. One of the reasons for this is that most stocks don’t deliver above-average returns. According to S&P Dow Jones Indices, only 24% of the stocks in the S&P 500 outperformed the average stock’s return from 2000 to 2022. Over this period, the average return on an S&P 500 stock was 390%, while the median stock rose by just 93%.
Thanks for the great article and stats Sam. As a very recent retiree I'll no longer dca into the market but based on these stats it seems like timing the market a little isn't such a bad idea. Ive always rebalanced yearly, but if the market falls 10% maybe rebalancing then is a better idea. I suppose I'm just changing from annual rebalancing to 10% tolerance bands on the downside. Based on the stats it seems like a decent thing to consider.