


Does it always make sense to think of a 20% decline in your portfolio as a loss? 🤨
Plus a charted review of the macro crosscurrents 🔀

📉 The stock market declined last week, with the S&P 500 shedding 0.02% to close at 5,967.84. It’s now down 2.9% from its February 19 closing high of 6,144.15 and up 66.8% from its October 12, 2022, closing low of 3,577.03. For more on how the market moves, read: Stocks usually look past geopolitical events, but they shouldn't be ignored 🫣
-
For us long-term investors, we may find ourselves having to sell some stocks during a market drawdown.
It’s an unpleasant thought I’ve had since early April, when the S&P 500 fell by around 20% from its Feb. 19 all-time high.
But does it always make sense to think of a 20% decline in your stock portfolio as a loss?

A common answer is that it’s not a loss until you sell. This is the distinction between a realized loss and an unrealized loss.
But even if you sell during a bear market, do you really lose 20%?
For many long-term investors, there’s a case to be made that the answer is no.
Reframing how we think about market drawdowns 🤔
At its April 7 intraday bottom, the S&P 500 reached a low of 4,835.04. This was the lowest level since Jan. 19, 2024.
In the context of my personal stock portfolio, which almost totally consists of purchases of S&P 500 index funds, I made three observations at the time:
All of my trades since January 2024 were in the red.
All of my trades from 2005, when I opened my first 401(k) account, through 2023 were profitable.
I put much more money to work from 2005 to 2023 than I did from 2024 to 2025.
To help understand this, see the chart below of the S&P 500 since 2005. The dotted line demarcates the S&P’s April low of 4,835.

Over 95% of the contributions I’ve made to my retirement accounts occurred when the stock market was much lower than the April 2025 low.
This means I still earned a substantial positive return investing in the stock market throughout my adult life. Even the purchases I made near market peaks before the global financial crisis and the COVID-19 pandemic were significantly profitable trades.
This is a roundabout way of saying that I’m thinking more about my cost basis. Since I made most of my purchases when the stock market was much lower than where it’s trading today, my average cost basis is very low.
This doesn’t actually change anything, Sam 🤨
To be clear, reframing how you think about the performance of your investments does not change the actual performance of your investments.
Sure, I’m still very much in the money. But there’s also no denying that at the April 7 low, the value of my portfolio was still down about 20% from its peak.
If you are a stone-cold, totally rational investor, then this discussion was perhaps a waste of time. But I think most of us benefit from some perspective when faced with jarring drops in our portfolios.
For me, thinking about how much I’m up relative to my cost basis has been much more positive on my mental health than thinking about how much I’m down from the market’s peak.
Investing in the stock market is an unpleasant process. We do what we can to cope with the tougher times.
-
More from TKer:
Listen up! 🎧
I joined Ryan Detrick and Sonu Varghese on the Facts vs. Feelings podcast! We discussed economic signals, market psychology, data quality, AI, how to find great pizza in NYC, and more!
Catch it on Spotify, Apple Podcasts, and YouTube!
Review of the macro crosscurrents 🔀
There were several notable data points and macroeconomic developments since our last review:
🏛️ Fed holds rates, says uncertainty has diminished but remains elevated. In its monetary policy announcement on Wednesday, the Federal Reserve left its target for the federal funds rate unchanged at a range of 4.25% to 4.5%.

From the Fed’s policy statement: “Although swings in net exports have affected the data, recent indicators suggest that economic activity has continued to expand at a solid pace. The unemployment rate remains low, and labor market conditions remain solid. Inflation remains somewhat elevated. The Committee seeks to achieve maximum employment and inflation at the rate of 2% over the longer run. Uncertainty about the economic outlook has diminished but remains elevated. The Committee is attentive to the risks to both sides of its dual mandate.”

For more on Fed policy, read: 'How many times will the Fed cut rates?' is not the right question for stock market investors 🔪
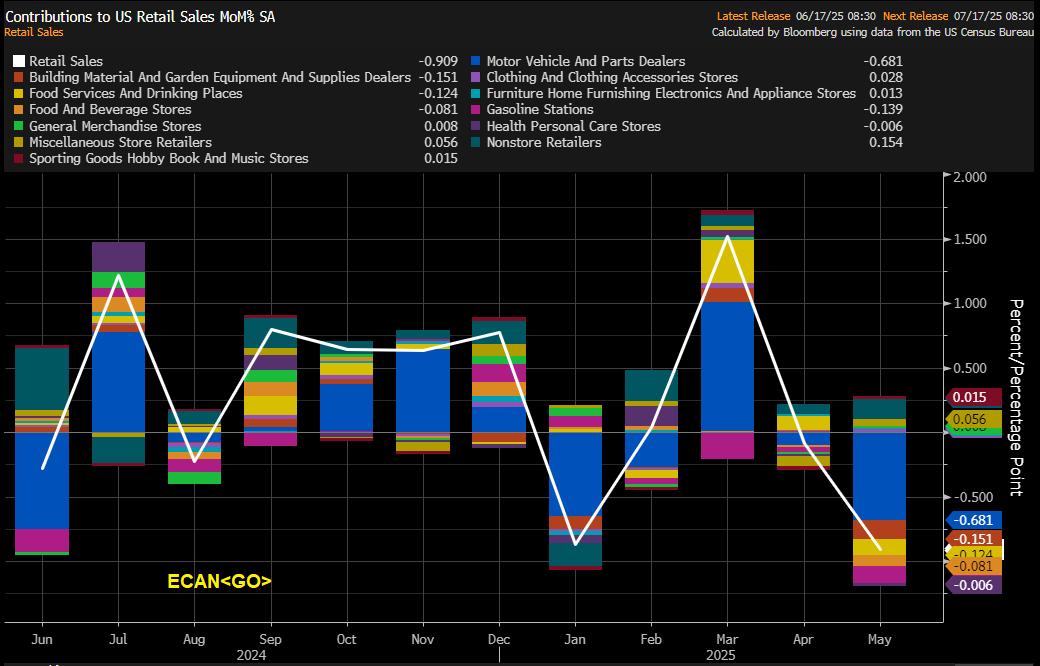
🛍️ Shopping ticks lower. Retail sales declined 0.9% in May to $715.4 billion.

The decline was led by a 3.5% drop in auto sales. This is largely due to “payback” following March’s jump in auto sales by consumers looking to front-run expected tariffs.
For more on how tariff rhetoric is affecting the economy, read: CHART: The confusing state of the economy 📊 and We're gonna get ambiguous signals in the economic data 😵💫
💳 Card spending data is holding up. From JPMorgan: “As of 13 Jun 2025, our Chase Consumer Card spending data (unadjusted) was 1.8% above the same day last year. Based on the Chase Consumer Card data through 13 Jun 2025, our estimate of the US Census June control measure of retail sales m/m is 0.50%.”

From BofA: “Total card spending per HH was up 0.1% y/y in the week ending Jun 14, according to BAC aggregated credit & debit card data. Relative to last week, entertainment, airlines & transit saw the biggest decline in y/y spending growth. Meanwhile, department stores, grocery and furniture saw the biggest increase relative to last week.“

For more on consumer spending, read: Americans have money, and they're spending it 🛍️
💼 New unemployment claims tick lower. Initial claims for unemployment benefits declined to 245,000 during the week ending June 14, down from 250,000 the week prior. This remains at a level historically associated with economic growth.

For more context, read: The labor market is cooling 💼
🛠️ Industrial activity declines. Industrial production activity in May declined 0.2% from prior month levels. Manufacturing ticked up by 0.1%, “driven by a gain of 4.9% in the index for motor vehicles and parts; the index for manufacturing excluding motor vehicles and parts fell 0.3%.“

For more on economic activity cooling, read: 9 once-hot economic charts that cooled 📉
🏠 Mortgage rates tick lower. According to Freddie Mac, the average 30-year fixed-rate mortgage declined to 6.81%, down from 6.84% last week. From Freddie Mac: “Mortgage rates moved lower, with the average 30-year fixed rate reaching a four-week low. More available inventory to choose from, coupled with this week’s decline in mortgage rates, could be the spark to get potential homebuyers off the sidelines.”

There are 147.8 million housing units in the U.S., of which 86.1 million are owner-occupied and about 34.1 million are mortgage-free. Of those carrying mortgage debt, almost all have fixed-rate mortgages, and most of those mortgages have rates that were locked in before rates surged from 2021 lows. All of this is to say: Most homeowners are not particularly sensitive to movements in home prices or mortgage rates.
For more on mortgages and home prices, read: Why home prices and rents are creating all sorts of confusion about inflation 😖
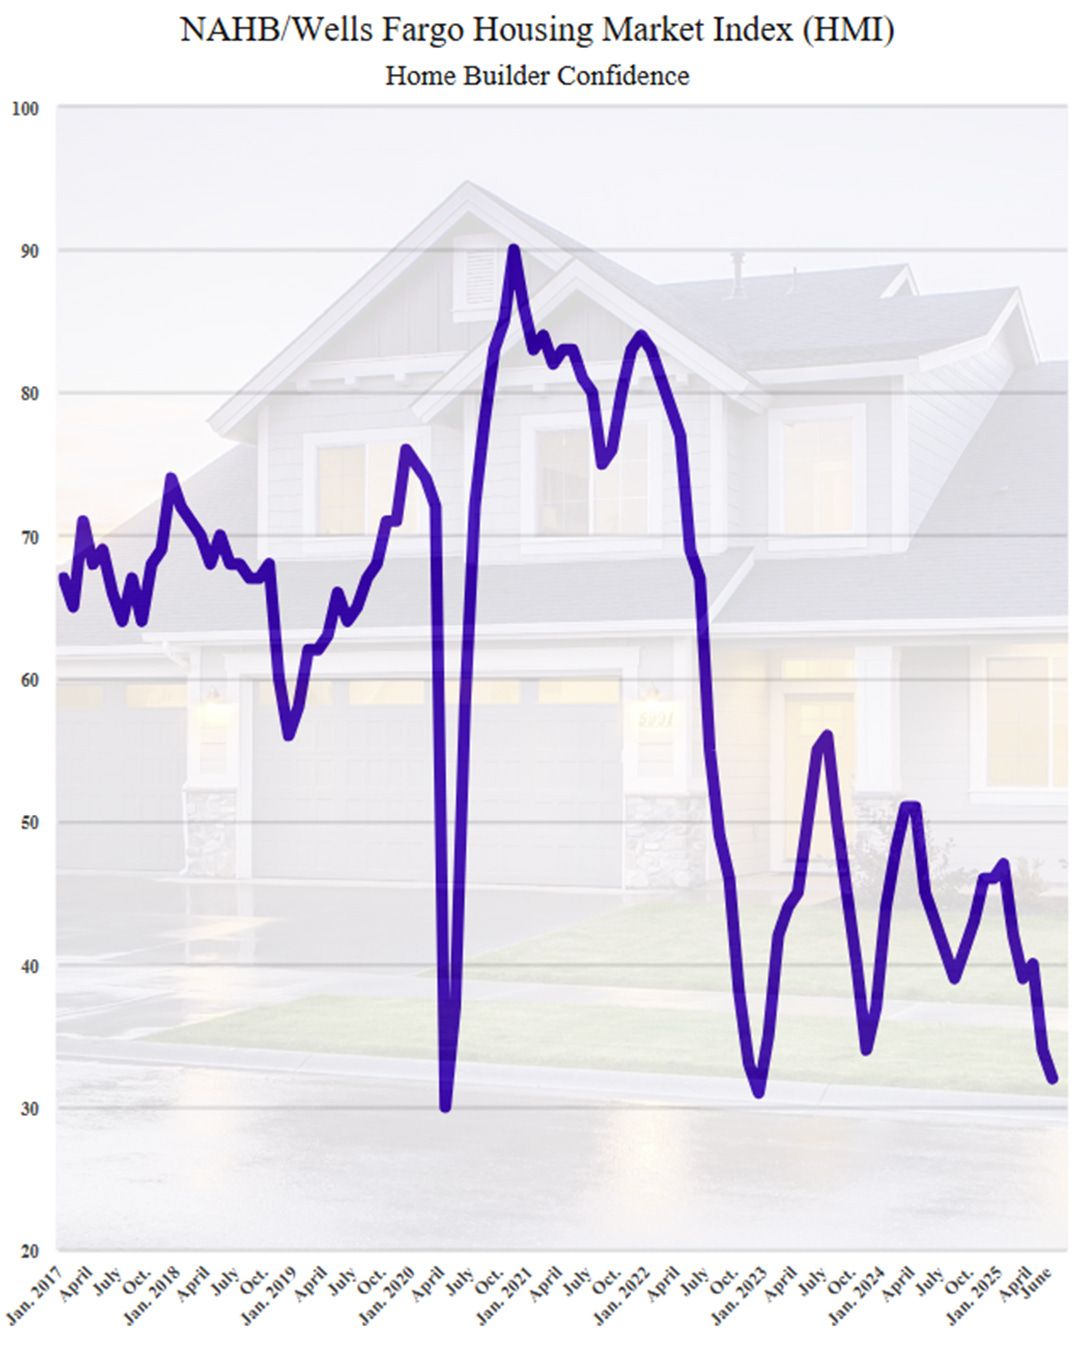
🏠 Homebuilder sentiment sinks. From the NAHB’s Robert Dietz: “Rising inventory levels and prospective home buyers who are on hold waiting for affordability conditions to improve are resulting in weakening price growth in most markets and generating price declines for resales in a growing number of markets. Given current market conditions, NAHB is forecasting a decline in single-family starts for 2025.”
🔨 New home construction starts cools. Housing starts fell 9.8% in May to an annualized rate of 1.26 million units, according to the Census Bureau. Building permits ticked down 2.0% to an annualized rate of 1.39 million units.

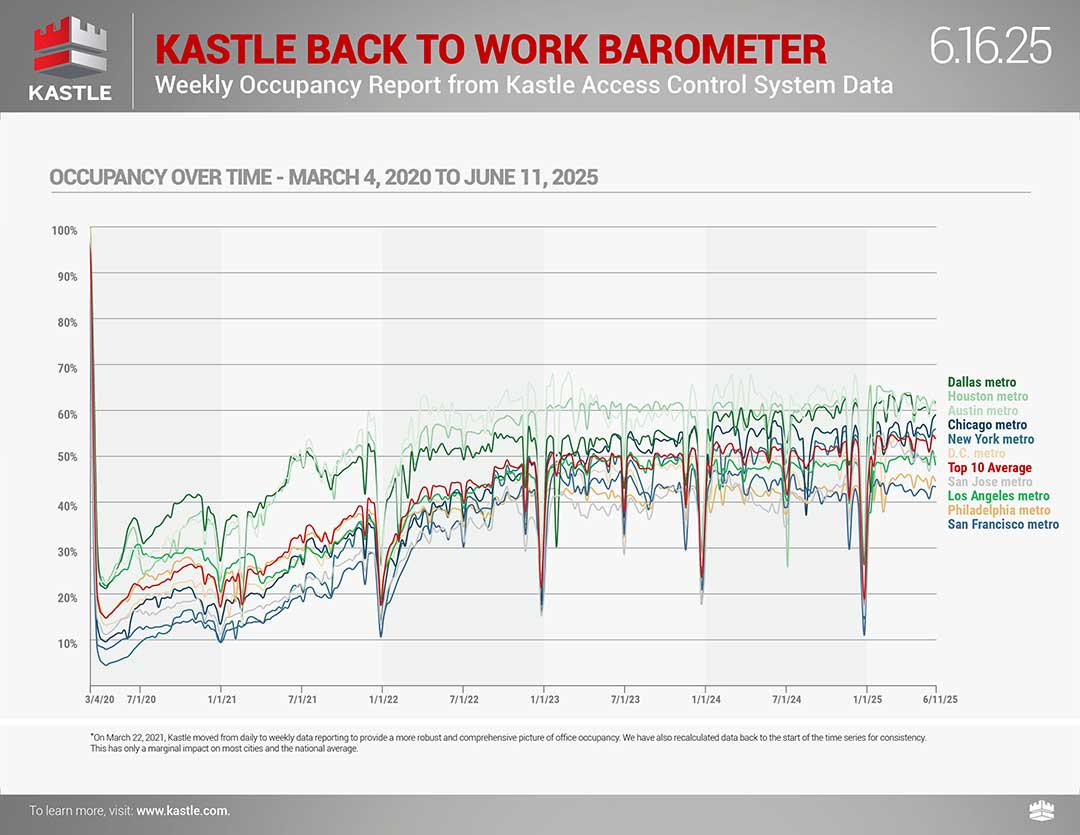
🏢 Offices remain relatively empty. From Kastle Systems: “Peak day office occupancy was 63.3% on Tuesday last week, down less than a point from the previous week. Peak day occupancy in Los Angeles fell 4.7 points to 53.5% as protests may have kept workers away from the office. Chicago hit 74% occupancy on Tuesday, its highest single day since the start of the pandemic, and Washington, D.C. matched its post-pandemic peak set the previous week, holding steady at 64.1% on Tuesday. The average low was on Friday at 35.2%.”
For more on office occupancy, read: This stat about offices reminds us things are far from normal 🏢
😬 This is the stuff pros are worried about. From BofA’s June Global Fund Manager Survey: “Trade war triggering a recession remains the biggest 'tail risk' according to 47% of FMS investors (vs 80% in April). Fed rate hikes continue to be seen as the 2nd biggest 'tail risk' (17%), while 16% say the biggest tail risk is a credit event caused by rising bond yields.”

For more on risks, read: When uncertainty becomes unambiguously high 🎢, Three observations about uncertainty in the markets 😟, and Two times when uncertainty seemed low and confidence was high 🌈
📈 Near-term GDP growth estimates are tracking positively. The Atlanta Fed’s GDPNow model sees real GDP growth rising at a 3.4% rate in Q2.

For more on GDP and the economy, read: 9 once-hot economic charts that cooled 📉 and You call this a recession? 🤨
Putting it all together 📋
🚨 The Trump administration’s pursuit of tariffs threatens to disrupt global trade, with significant implications for the U.S. economy, corporate earnings, and the stock market. Until we get more clarity, here’s where things stand:
Earnings look bullish: The long-term outlook for the stock market remains favorable, bolstered by expectations for years of earnings growth. And earnings are the most important driver of stock prices.
Demand is positive: Demand for goods and services remains positive, supported by healthy consumer and business balance sheets. Job creation, while cooling, also remains positive, and the Federal Reserve — having resolved the inflation crisis — shifted its focus toward supporting the labor market.
But growth is cooling: While the economy remains healthy, growth has normalized from much hotter levels earlier in the cycle. The economy is less “coiled” these days as major tailwinds like excess job openings and core capex orders have faded. It has become harder to argue that growth is destiny.
Actions speak louder than words: We are in an odd period, given that the hard economic data decoupled from the soft sentiment-oriented data. Consumer and business sentiment has been relatively poor, even as tangible consumer and business activity continues to grow and trend at record levels. From an investor’s perspective, what matters is that the hard economic data continues to hold up.
Stocks are not the economy: Analysts expect the U.S. stock market could outperform the U.S. economy, thanks largely to positive operating leverage. Since the pandemic, companies have aggressively adjusted their cost structures. This came with strategic layoffs and investment in new equipment, including hardware powered by AI. These moves are resulting in positive operating leverage, which means a modest amount of sales growth — in the cooling economy — is translating to robust earnings growth.
Mind the ever-present risks: Of course, we should not get complacent. There will always be risks to worry about, such as U.S. political uncertainty, geopolitical turmoil, energy price volatility, and cyber attacks. There are also the dreaded unknowns. Any of these risks can flare up and spark short-term volatility in the markets.
Investing is never a smooth ride: There’s also the harsh reality that economic recessions and bear markets are developments that all long-term investors should expect as they build wealth in the markets. Always keep your stock market seat belts fastened.
Think long-term: For now, there’s no reason to believe there’ll be a challenge that the economy and the markets won’t be able to overcome over time. The long game remains undefeated, and it’s a streak that long-term investors can expect to continue.
For more on how the macro story is evolving, check out the previous review of the macro crosscurrents. »
Key insights about the stock market 📈
Here’s a roundup of some of TKer’s most talked-about paid and free newsletters about the stock market. All of the headlines are hyperlinked to the archived pieces.
10 truths about the stock market 📈
The stock market can be an intimidating place: It’s real money on the line, there’s an overwhelming amount of information, and people have lost fortunes in it very quickly. But it’s also a place where thoughtful investors have long accumulated a lot of wealth. The primary difference between those two outlooks is related to misconceptions about the stock market that can lead people to make poor investment decisions.
The makeup of the S&P 500 is constantly changing 🔀
Passive investing is a concept usually associated with buying and holding a fund that tracks an index. And no passive investment strategy has attracted as much attention as buying an S&P 500 index fund. However, the S&P 500 — an index of 500 of the largest U.S. companies — is anything but a static set of 500 stocks.

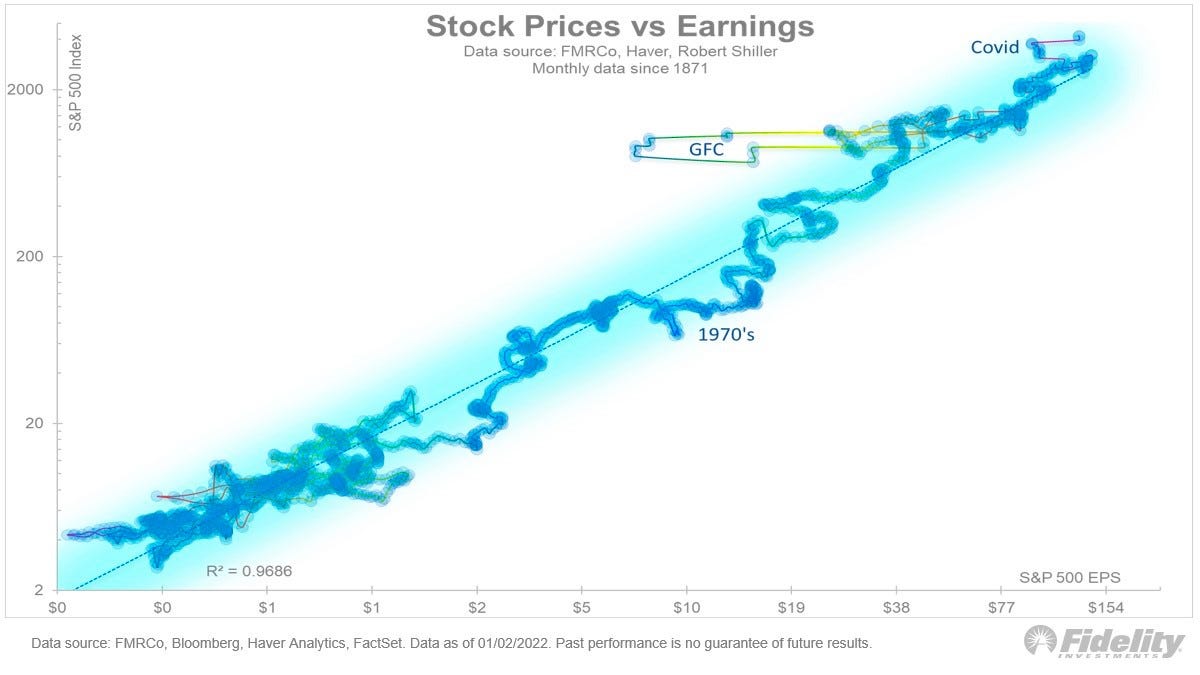
The key driver of stock prices: Earnings💰
For investors, anything you can ever learn about a company matters only if it also tells you something about earnings. That’s because long-term moves in a stock can ultimately be explained by the underlying company’s earnings, expectations for earnings, and uncertainty about those expectations for earnings. Over time, the relationship between stock prices and earnings has a very tight statistical relationship.
Stomach-churning stock market sell-offs are normal🎢
Investors should always be mentally prepared for some big sell-offs in the stock market. It’s part of the deal when you invest in an asset class that is sensitive to the constant flow of good and bad news. Since 1950, the S&P 500 has seen an average annual max drawdown (i.e., the biggest intra-year sell-off) of 14%.

How the stock market performed around recessions 📉📈
Every recession in history was different. And the range of stock performance around them varied greatly. There are two things worth noting. First, recessions have always been accompanied by a significant drawdown in stock prices. Second, the stock market bottomed and inflected upward long before recessions ended.

In the stock market, time pays ⏳
Since 1928, the S&P 500 generated a positive total return more than 89% of the time over all five-year periods. Those are pretty good odds. When you extend the timeframe to 20 years, you’ll see that there’s never been a period where the S&P 500 didn’t generate a positive return.

What a strong dollar means for stocks 👑
While a strong dollar may be great news for Americans vacationing abroad and U.S. businesses importing goods from overseas, it’s a headwind for multinational U.S.-based corporations doing business in non-U.S. markets.

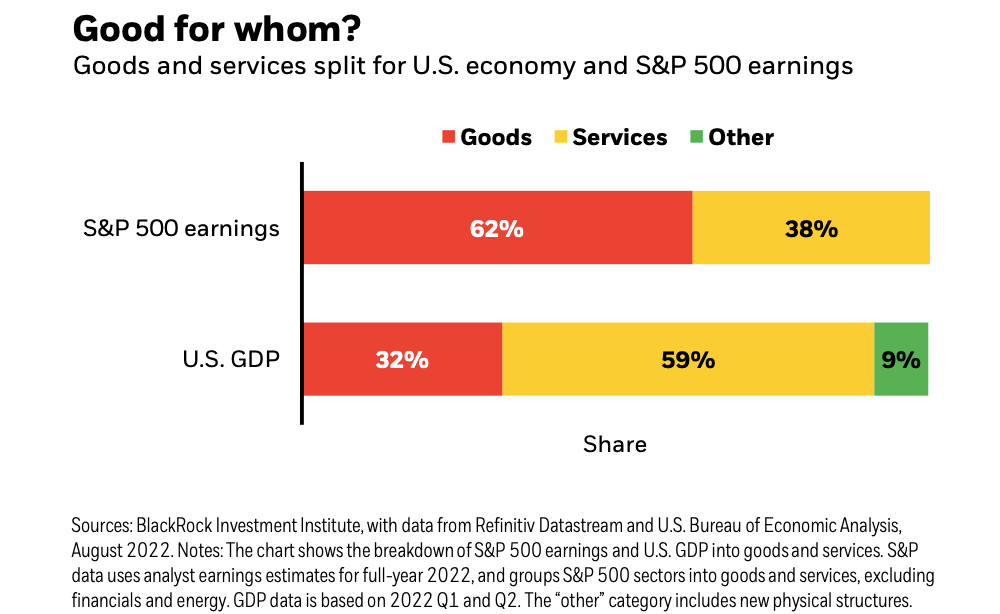
Economy ≠ Stock Market 🤷♂️
The stock market sorta reflects the economy. But also, not really. The S&P 500 is more about the manufacture and sale of goods. U.S. GDP is more about providing services.
Stanley Druckenmiller's No. 1 piece of advice for novice investors 🧐
…you don't want to buy them when earnings are great, because what are they doing when their earnings are great? They go out and expand capacity. Three or four years later, there's overcapacity and they're losing money. What about when they're losing money? Well, then they’ve stopped building capacity. So three or four years later, capacity will have shrunk and their profit margins will be way up. So, you always have to sort of imagine the world the way it's going to be in 18 to 24 months as opposed to now. If you buy it now, you're buying into every single fad every single moment. Whereas if you envision the future, you're trying to imagine how that might be reflected differently in security prices.
Peter Lynch made a remarkably prescient market observation in 1994 🎯
Some event will come out of left field, and the market will go down, or the market will go up. Volatility will occur. Markets will continue to have these ups and downs. … Basic corporate profits have grown about 8% a year historically. So, corporate profits double about every nine years. The stock market ought to double about every nine years… The next 500 points, the next 600 points — I don’t know which way they’ll go… They’ll double again in eight or nine years after that. Because profits go up 8% a year, and stocks will follow. That's all there is to it.
Warren Buffett's 'fourth law of motion' 📉
Long ago, Sir Isaac Newton gave us three laws of motion, which were the work of genius. But Sir Isaac’s talents didn’t extend to investing: He lost a bundle in the South Sea Bubble, explaining later, “I can calculate the movement of the stars, but not the madness of men.” If he had not been traumatized by this loss, Sir Isaac might well have gone on to discover the Fourth Law of Motion: For investors as a whole, returns decrease as motion increases.
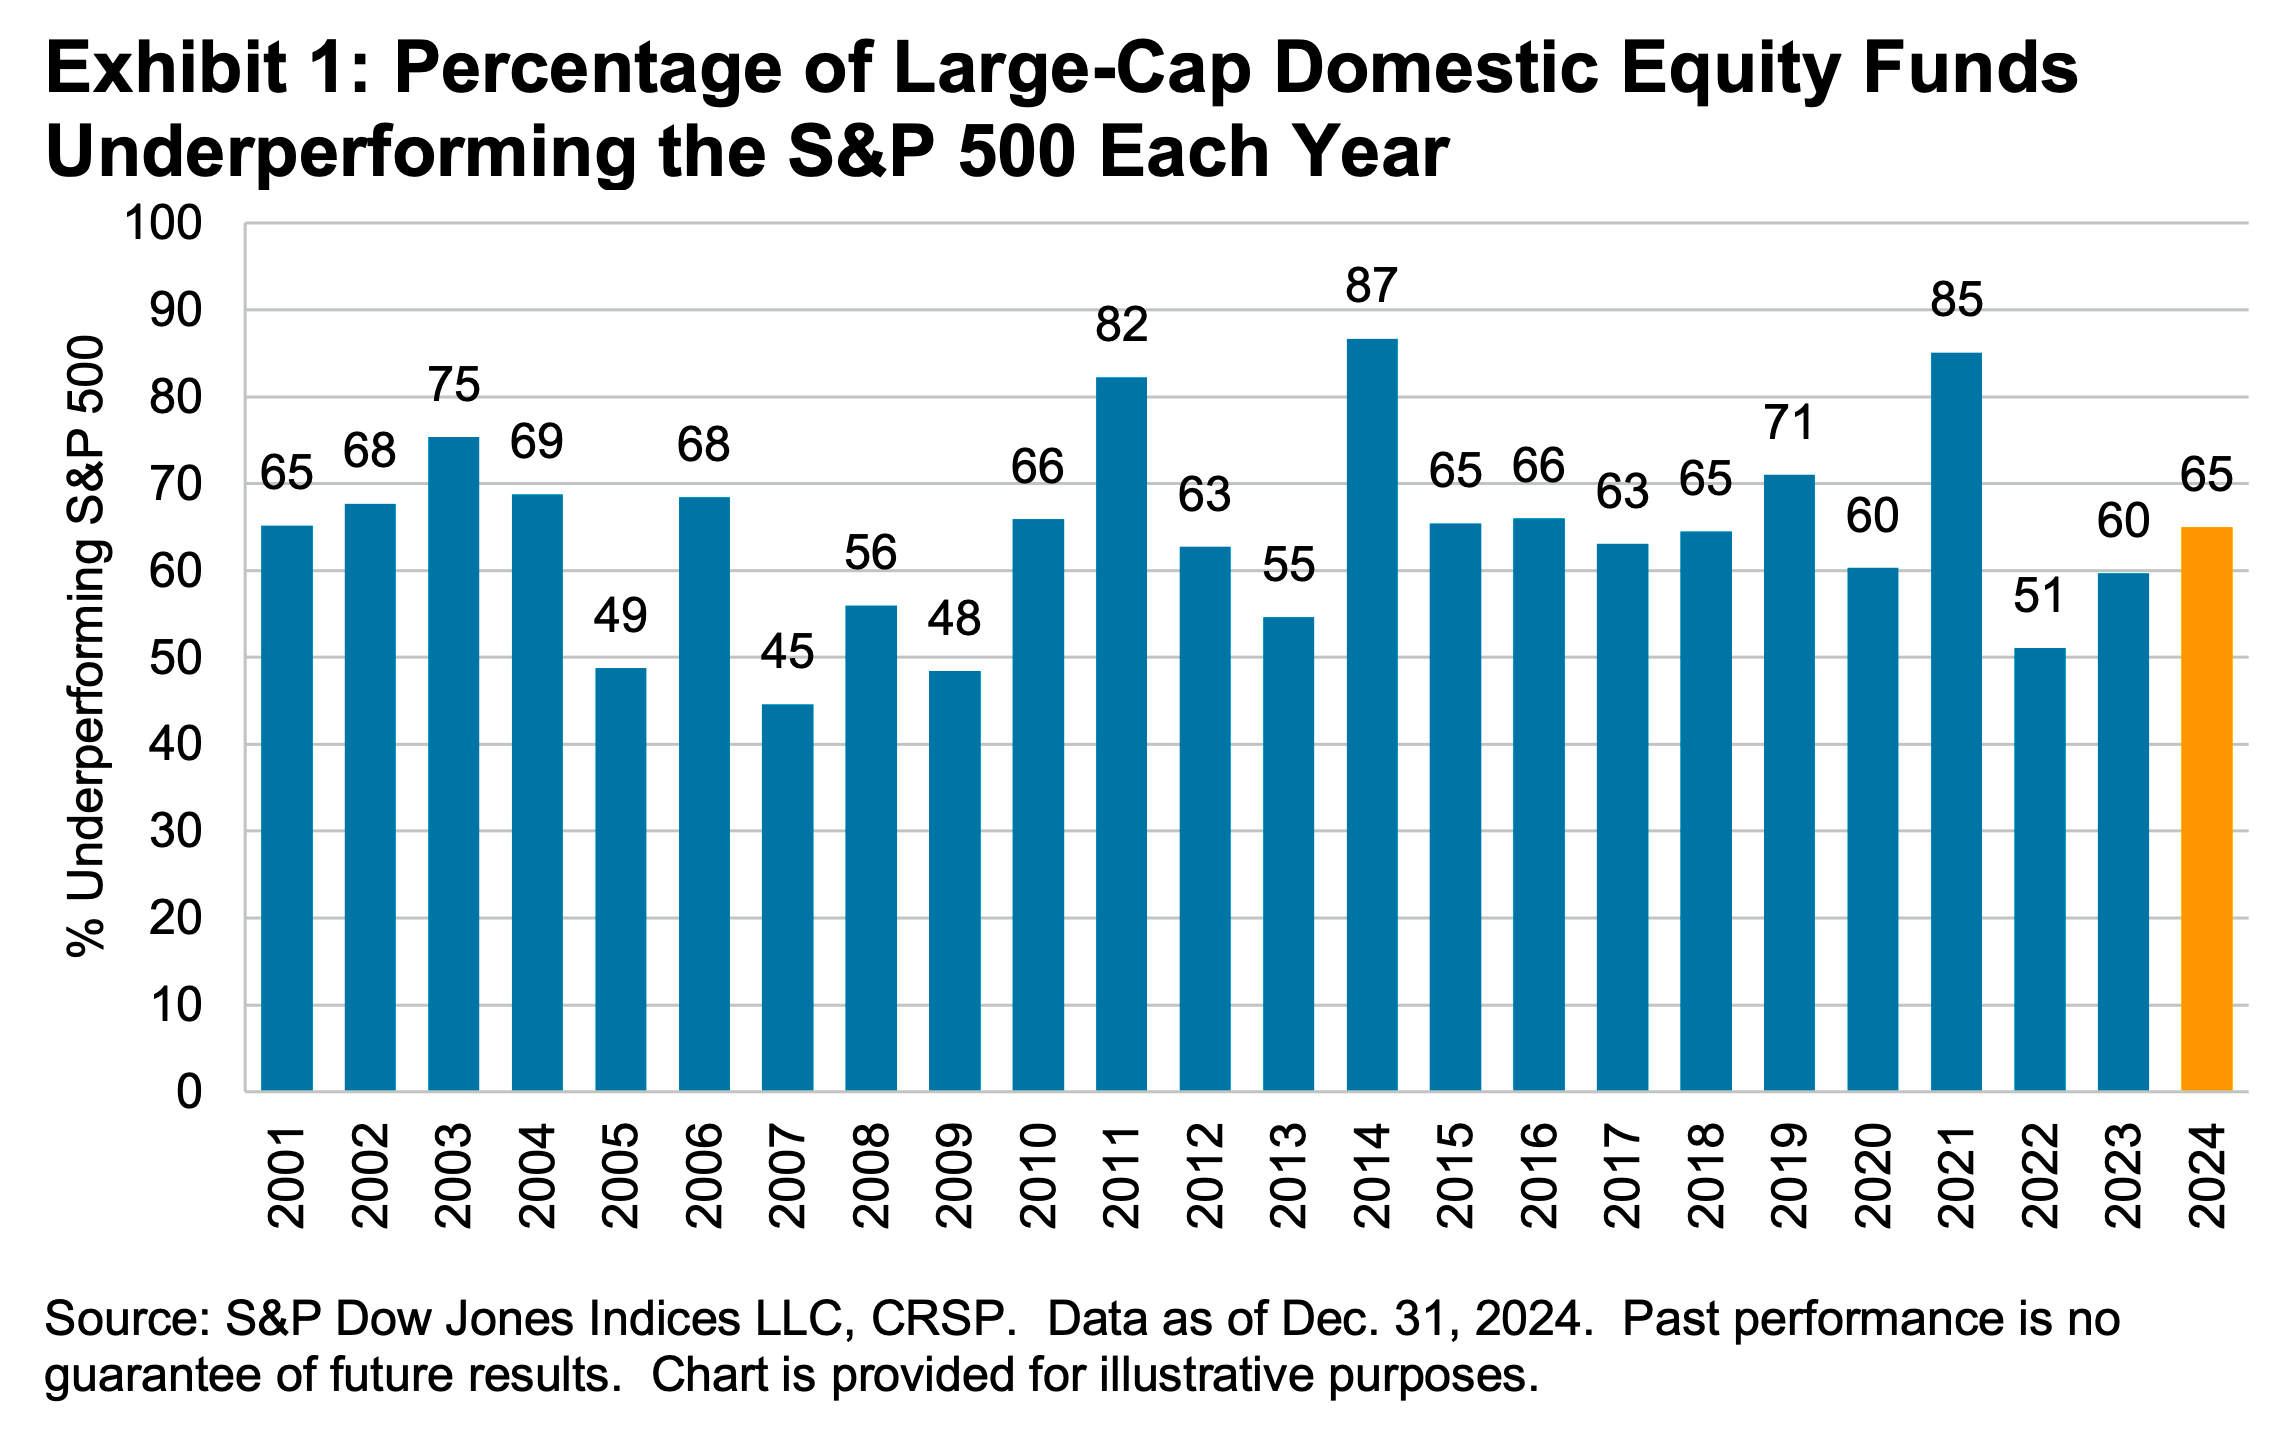
Most pros can’t beat the market 🥊
According to S&P Dow Jones Indices (SPDJI), 65% of U.S. large-cap equity fund managers underperformed the S&P 500 in 2024. As you stretch the time horizon, the numbers get even more dismal. Over a three-year period, 85% underperformed. Over a 10-year period, 90% underperformed. And over a 20-year period, 92% underperformed. This 2023 performance follows 14 consecutive years in which the majority of fund managers in this category have lagged the index.
Proof that 'past performance is no guarantee of future results' 📊
Even if you are a fund manager who generated industry-leading returns in one year, history says it’s an almost insurmountable task to stay on top consistently in subsequent years. According to S&P Dow Jones Indices, just 4.21% of all U.S. equity funds in the top half of performance during the first year were able to remain in the top during the four subsequent years. Only 2.42% of U.S. large-cap funds remained in the top half
SPDJI’s report also considered fund performance relative to their benchmarks over the past three years. Of 738 U.S. large-cap equity funds tracked by SPDJI, 50.68% beat the S&P 500 in 2022. Just 5.08% beat the S&P in the two years ending 2023. And only 2.14% beat the index in the three years ending in 2024.

The odds are stacked against stock pickers 🎲
Picking stocks in an attempt to beat market averages is an incredibly challenging and sometimes money-losing effort. Most professional stock pickers aren’t able to do this consistently. One of the reasons for this is that most stocks don’t deliver above-average returns. According to S&P Dow Jones Indices, only 24% of the stocks in the S&P 500 outperformed the average stock’s return from 2000 to 2022. Over this period, the average return on an S&P 500 stock was 390%, while the median stock rose by just 93%.
