Identifying winning stocks is hard. Holding winning stocks is a nightmare. π«
Plus a charted review of the macro crosscurrents π
π The stock market rallied last week, with the S&P 500 gaining 1.9% to close at 5,911.69. Itβs now down 3.8% from its February 19 closing high of 6,144.15 and up 65.3% from its October 12, 2022 closing low of 3,577.03. For more on how the market moves, read: It's OK to have emotions β just don't let them near your stock portfolio π
-
Weβve discussed exhaustively how difficult it is to pick stocks that outperform the market.
But letβs assume you were able to identify these winning stocks. Is it smooth sailing from there as you smoke the competition?
No. Far from it.
It turns out that the stocks offering the best returns for investors historically experienced incredibly painful max drawdowns (i.e. percentage declines from a price peak to a trough).
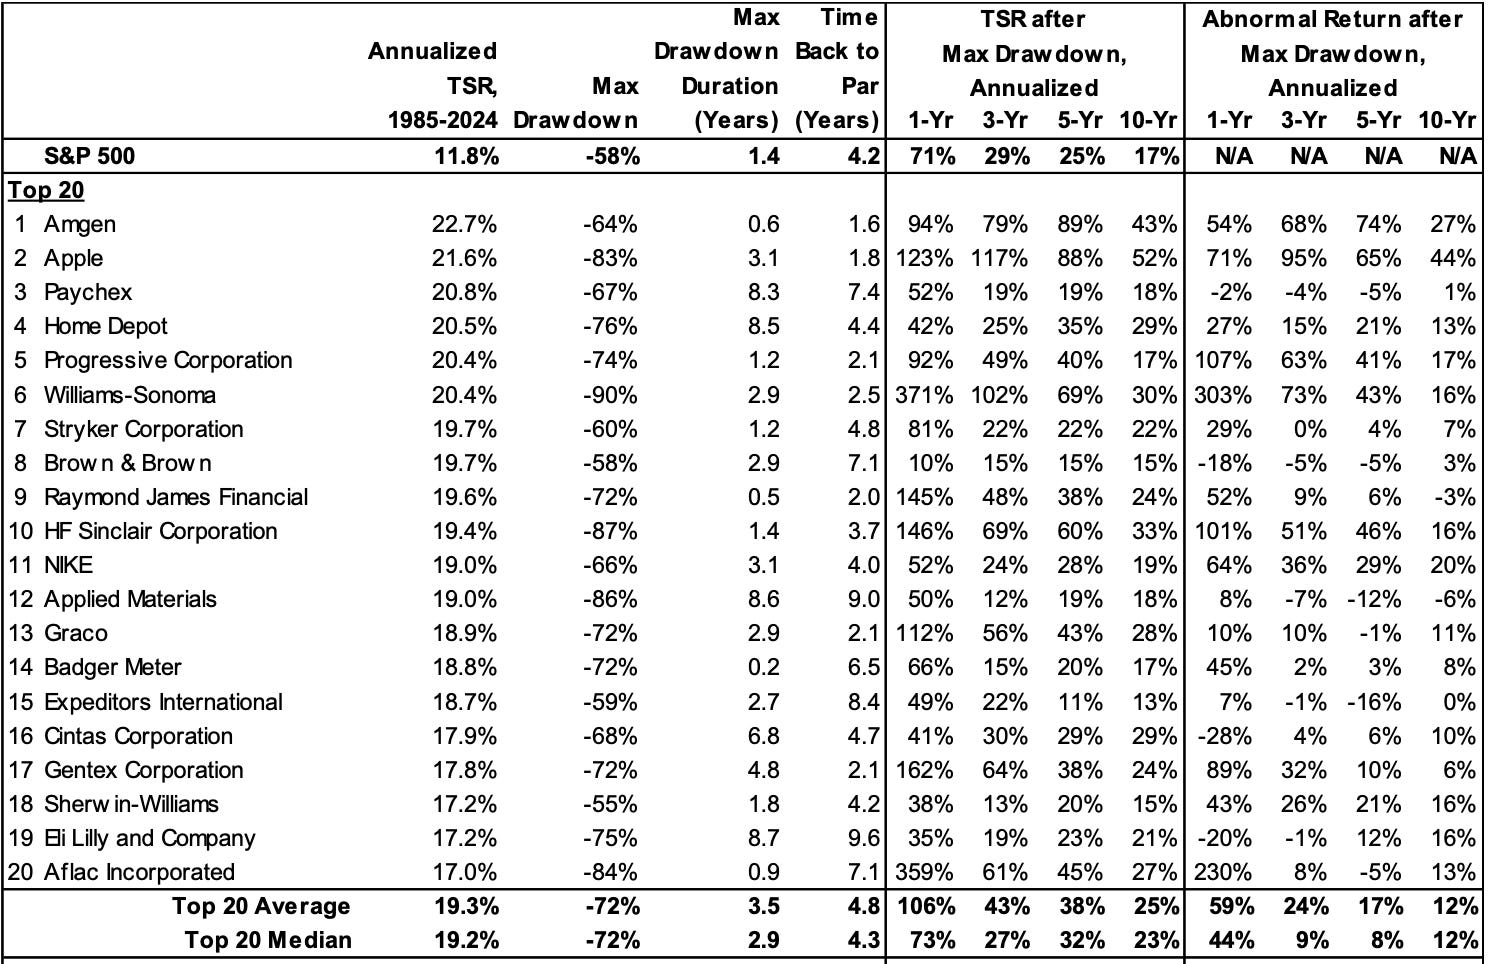
Morgan Stanleyβs Michael Mauboussin and Dan Callahan recently studied the price behavior of 6,500 stocks. Among other things, they took a closer look at the 20 stocks with the best total shareholder returns over the 40-year period from 1985 to 2024. They also reviewed the performance of the 20 worst performers during the period. (Note: They only considered stocks listed on the NYSE, NASDAQ and NYSE American exchanges that traded during the entire measurement period. They excluded companies worth less than $1 billion at the beginning and $250 million at the end of their maximum drawdowns.)
βThe median maximum drawdown was 72% for the best group, and the median maximum drawdown duration, the time from peak to trough, was 2.9 years,β they found. βThe median time to return to the prior peak was 4.3 years. The median annualized abnormal returns following the bottom was 8% for the next 5 years and 12% for the next 10 years. This is based on the unrealistic assumption the stock was purchased at the low.β

Just thinking about one of my positions losing 72% of its value makes me queasy, even knowing full well this is the average behavior of the best stocks.
Now imagine being a fund manager with the conviction to hang on to these types of stocks.
Mauboussin and Callahan note that Alpha Architectβs Wes Gray considered this thought experiment in a paper titled: βEven God Would Get Fired as an Active Investor.β
β[Grayβs] point is that if you had the (godlike) foresight to build a portfolio of the stocks that would produce the highest TSRs over the next five years, you would have βgreat returns, but gut-wrenching drawdowns,ββ they wrote. βIn other words, the drawdowns are so large that a client who hired you to be their active manager might fire you.β
Investing in index funds has its benefits π
The analysts considered the performance of the S&P 500 over this measurement period to show the benefits of diversification.
βThe maximum drawdown for the index was 58%, the maximum drawdown duration was 1.4 years, and the time to recover back to par was 4.2 years,β they observed. βFollowing the trough, the annual TSR for the S&P 500 was 25% over 5 years and 17% over 10 years.β
So maybe your return isnβt as high as investing in the top performing stocks. But the max drawdown for the S&P is shallower, and the duration of that drawdown is much shorter.
Obviously, youβd still opt for the more painful drawdowns if you knew you would outperform the market over time.
Unfortunately, almost no one has a consistent track record of identifying those long-term winners. And there are a lot of stocks with underperforming returns, including a whole lot of stocks that never recover from their max drawdowns.
βThe median stockβs recovery from its maximum drawdown is 90% of the prior peak price (par), which means it fails to return to its past high,β they found. βIn fact, about 54% of stocks never return to par after hitting bottom.β (Note: For this review, they considered stocks listed on the NYSE, NASDAQ and NYSE American exchanges that traded during the entire measurement period. They only considered stocks that worth worth at least $1 million at the end of any month.)

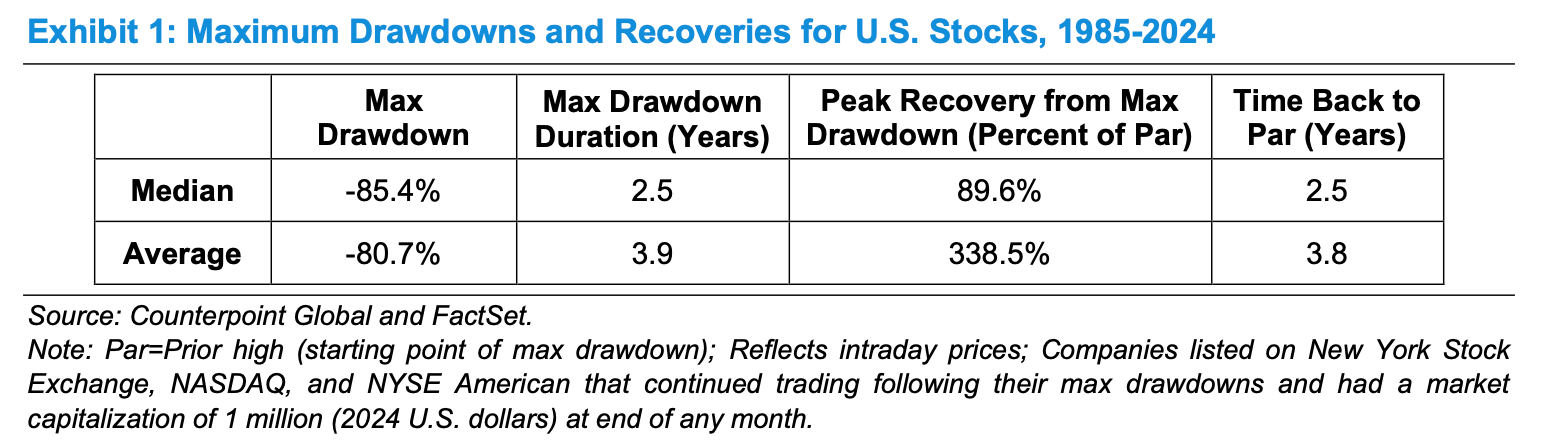
One of the more notable findings in this study is that the average recovery from a drawdown is a whopping 338.5%, to which the analysts said: βThis tells you that some stocks produced very high returns off of the bottom.β
Indeed, a few stocks β some generating >1,000% returns β can be responsible for the bulk of a portfolioβs returns.
To put it another way, the median 89.5% recovery figure tells us itβs very hard to pick winning stocks. Meanwhile, the average 338.5% recovery figure tells us that a broadly diversified portfolio with exposure to all stocks can generate returns that multiply the value of your initial investment.
It takes a strong stomachπ«π»
Legendary stock picker Peter Lynch once said: "In the stock market, the most important organ is the stomach. It's not the brain.β
This is true for investors in broadly diversified index funds. This is even more true for investors who aim to pick stocks with the aim of producing market-beating returns.
-
Related from TKer:
Warren Buffett: 'It takes just a few winners to work wonders' π
'Past performance is' clearly 'no guarantee of future results' π
Most stock-picking pros underperformed in 2024's market rally π«€
Review of the macro crosscurrents π
There were several notable data points and macroeconomic developments since our last review:
π Business investment activity declines. Orders for nondefense capital goods excluding aircraft β a.k.a. core capex or business investment β declined 1.3% to $74.8 billion in April.

Core capex orders are a leading indicator, meaning they foretell economic activity down the road. The recent decline could portend slowing growth in the months to come.
For more on core capex, read: An economic warning sign in the hard data β οΈ
π CEO confidence tanks. From The Conference Boardβs Stephanie Guichard: βCEO Confidence collapsed in Q2 2025 after surging in Q1. CEOsβ views about current economic conditions led the plunge, registering the largest quarter-on-quarter decline in almost 50 years. Expectations for the future also plummeted, with more than half of CEOs now expecting conditions to worsen over the next six months, both for the economy overall and in their own industries. CEOsβ assessments of current conditions in their own industriesβa measure not included in calculating the topline Confidence measureβalso fell sharply in Q2. The vast majority of CEOs (83%) said they expect a recession in the next 12-18 months, nearly matching the percentage who feared recession in late 2022 and early 2023. The USβChina trade deal announced on May 12 seems to have eased, but not removed, concerns about the future.β

From the firmβs Roger Ferguson: βCEOs named geopolitical instability, followed by trade and tariffs, as the two top business risks impacting their industry in Q2. Regulatory uncertainty followed close behind, while cyber risksβwhich dominated CEOsβ concerns over the past two yearsβdropped down to 4th place. As in previous quarters, a majority of CEOs indicated no revisions to their capital spending plans over the next 12 months. Still, consistent with more pessimism about the outlook in their own industries, the share of CEOs expecting to revise down investment plans doubled in Q2 to 26%, while the share expecting to upgrade investment plans dropped 14 ppts to 19%.β

For more on deteriorating sentiment, read: The confusing state of the economy π and We're gonna get ambiguous signals in the economic data π΅βπ«
π’ Imports sink. Hereβs Bloomberg on April Census data: β[G]oods imports plummeted by a record as companies adjusted to higher tariffs. β¦data showed an almost 20% slump in imports, leading to a massive narrowing in the US merchandise-trade deficit in April. β¦ Besides the punitive tariffs in place last month on Chinese products, the slump in goods imports probably reflected a reversal in the inflow of pharmaceuticals following a surge in March and a decline of gold importsβ¦β

For more on volatile imports, read: How much inventory did companies actually build ahead of tariffs? π€·π»ββοΈ, A BIG economic question right now π€, and What does the negative GDP report really tell us? π€
π Inflation cools. The personal consumption expenditures (PCE) price index in April was up 2.1% from a year ago. The core PCE price index β the Federal Reserveβs preferred measure of inflation β was up 2.5% during the month, down from Marchβs 2.7% rate. While itβs above the Fedβs 2% target, it remains near its lowest level since March 2021.

On a month over month basis, the core PCE price index was up 0.1%. If you annualized the rolling three-month and six-month figures, the core PCE price index was up 2.7% and 2.6%, respectively.

For more on inflation and the outlook for monetary policy, read: The Fed closes a chapter with a rate cut βοΈ and The other side of the Fed's inflation 'mistake' π§
ποΈ Consumer spending ticks up. According to BEA data, personal consumption expenditures increased 0.2% month over month in April to a record annual rate of $20.67 trillion.

π³ Card spending data is holding up. From JPMorgan: βAs of 23 May 2025, our Chase Consumer Card spending data (unadjusted) was 1.5% above the same day last year. Based on the Chase Consumer Card data through 23 May 2025, our estimate of the US Census May control measure of retail sales m/m is 0.48%.β
From BofA: βTotal card spending per HH was up 0.2% y/y in the week ending May 24, according to BAC aggregated credit & debit card data. The shift in Memorial Day (5/26/25 vs. 5/27/24) likely weighed on y/y total card spending growth in the week ending May 24. Initial read suggests that we could be getting a softer Memorial Day spending weekend this year likely due to colder weather.β
May spending is likely being boosted by consumers pulling forward purchases in an attempt to front-run tariffs.
For more on consumer spending, read: We're gonna get ambiguous signals in the economic data π΅βπ« and Americans have money, and they're spending it ποΈ
πΌ Unemployment claims tick higher. Initial claims for unemployment benefits rose to 240,000 during the week ending May 24, up from 226,000 the week prior. This metric continues to be at levels historically associated with economic growth.

For more context, read: A note about federal layoffs ποΈ and The labor market is cooling πΌ
π Consumer vibes improve. The Conference Boardβs Consumer Confidence Index ticked higher in May. From the firmβs Stephanie Guichard: βConsumer confidence improved in May after five consecutive months of decline. The rebound was already visible before the May 12 US-China trade deal but gained momentum afterwards. The monthly improvement was largely driven by consumer expectations as all three components of the Expectations Indexβbusiness conditions, employment prospects, and future incomeβrose from their April lows. Consumers were less pessimistic about business conditions and job availability over the next six months and regained optimism about future income prospects. Consumersβ assessments of the present situation also improved.β

Relatively weak consumer sentiment readings appear to contradict resilient consumer spending data. For more on this contradiction, read: What consumers do > what consumers say π and We're taking that vacation whether we like it or not π«
π Consumers feel worse about the labor market. The Conference Boardβs Guichard noted: βHowever, while consumers were more positive about current business conditions than last month, their appraisal of current job availability weakened for the fifth consecutive month.β From the firmβs May Consumer Confidence survey: βConsumersβ views of the labor market weakened in May. 31.8% of consumers said jobs were βplentiful,β up slightly from 31.2% in April. 18.6% of consumers said jobs were βhard to get,β up from 17.5%.β

For more on the labor market, read: The labor market is cooling πΌ
β½οΈ Gas prices tick lower. From AAA: βWith crude oil prices lingering in the low $60s per barrel, drivers are reaping the benefits at the pump. The national average is down about 3 cents from last week, returning to what it was a month ago: $3.16. While fuel prices are expected to remain on the lower side compared to last summer, weather is the wild card. The Atlantic hurricane season begins Sunday, and NOAA predicts a 60% chance of an above-normal season. Storms along the Gulf Coast can affect oil refineries and disrupt fuel deliveries, leading to a temporary increase in gas prices.β

For more on energy prices, read: Higher oil prices meant something different in the past π’οΈ
π Mortgage rates tick higher. According to Freddie Mac, the average 30-year fixed-rate mortgage rose to 6.89%, up from 6.86% last week. From Freddie Mac: βThis week, the 30-year fixed-rate mortgage rose slightly higher. Aspiring buyers should remember to shop around for the best mortgage rate, as they can potentially save thousands of dollars by getting multiple quotes.β

There are 147.8 million housing units in the U.S., of which 86.1 million are owner-occupied and about 34.1 million of which are mortgage-free. Of those carrying mortgage debt, almost all have fixed-rate mortgages, and most of those mortgages have rates that were locked in before rates surged from 2021 lows. All of this is to say: Most homeowners are not particularly sensitive to movements in home prices or mortgage rates.
For more on mortgages and home prices, read: Why home prices and rents are creating all sorts of confusion about inflation π
π Home sales fall. Sales of previously owned homes fell by 0.5% in April to an annualized rate of 4.0 million units. From NAR chief economist Lawrence Yun: βHome sales have been at 75% of normal or pre-pandemic activity for the past three years, even with seven million jobs added to the economy. Pent-up housing demand continues to grow, though not realized. Any meaningful decline in mortgage rates will help release this demand.β

Prices for previously owned homes increased from last monthβs levels and year ago levels. From the NAR: βThe median existing-home sales price for all housing types in April was $414,000, up 1.8% from one year ago ($406,600). The Northeast and Midwest posted price increases, and the South and West registered price decreases.β

ποΈ New home sales rise. Sales of newly built homes rose 10.9% in April to an annualized rate of 743,000 units.

π Home prices cool. According to the S&P CoreLogic Case-Shiller index, home prices were up 3.4% year-over-year in March but declined 0.3% month-over-month. From S&P Dow Jones Indicesβ Nicholas Godec: βHome price growth continued to decelerate on an annual basis in March, even as the market experienced its strongest monthly gains so far in 2025. This divergence between slowing year-over-year appreciation and renewed spring momentum highlighted how the housing market shifted from mere resilience to a broader seasonal recovery. Limited supply and steady demand drove prices higher across most metropolitan areas, despite affordability challenges remaining firmly in place.β

π’ Offices remain relatively empty. From Kastle Systems: βPeak day office occupancy was 62.2% on Tuesday last week, down 1.1 points from the previous week. Only Chicago and San Francisco experienced decreases of more than two full points, falling 3.4 points to 68.6% and 2.8 points to 49.4%, respectively. The average low was on Friday at 34.8%, up three tenths of a point from the previous week.β

For more on office occupancy, read: This stat about offices reminds us things are far from normal π’
π Activity survey improves. From S&P Globalβs May U.S. PMI: βBusiness confidence has improved in May from the worrying slump seen in April, with gloom about prospects for the year ahead lifting somewhat thanks largely to the pause on higher rate tariffs. Current output growth has also picked up from Aprilβs recent low, which had seen the weakest rise for over one-and-a-half years, in response to an upturn in demand. However, both sentiment and output growth remain relatively subdued, and at least some of the upturn in May can be linked to companies and their customers seeking to front-run further possible tariff-related issues, most notably the potential for future tariff hikes after the 90-day pause lapses in July.β

Keep in mind that during times of perceived stress, soft survey data tends to be more exaggerated than actual hard data.
For more on this, read: What businesses do > what businesses say π
πΊπΈ Most U.S. states are still growing. From the Philly Fedβs April State Coincident Indexes report: "Over the past three months, the indexes increased in 42 states, decreased in five states, and remained stable in three, for a three-month diffusion index of 74. Additionally, in the past month, the indexes increased in 35 states, decreased in nine states, and remained stable in six, for a one-month diffusion index of 52.β

π Near-term GDP growth estimates are tracking positive. The Atlanta Fedβs GDPNow model sees real GDP growth rising at a 3.8% rate in Q2.

For more on GDP and the economy, read: 9 once-hot economic charts that cooled π and You call this a recession? π€¨
Putting it all together π€
π¨ The Trump administrationβs view on tariffs threatens to disrupt global trade β with significant implications for the U.S. economy, corporate earnings, and the stock market. Until we get more clarity, hereβs where things stand:
Earnings look bullish: The long-term outlook for the stock market remains favorable, bolstered by expectations for years of earnings growth. And earnings are the most important driver of stock prices.
Demand is positive: Demand for goods and services remains positive, supported by healthy consumer and business balance sheets. Job creation, while cooling, also remains positive, and the Federal Reserve β having resolved the inflation crisis β has shifted its focus toward supporting the labor market.
But growth is cooling: While the economy remains healthy, growth has normalized from much hotter levels earlier in the cycle. The economy is less βcoiledβ these days as major tailwinds like excess job openings and core capex orders have faded. It has become harder to argue that growth is destiny.
Actions speak louder than words: We are in an odd period given that the hard economic data has decoupled from the soft sentiment-oriented data. Consumer and business sentiment has been relatively poor, even as tangible consumer and business activity continue to grow and trend at record levels. From an investorβs perspective, what matters is that the hard economic data continues to hold up.
Stocks are not the economy: Analysts expect the U.S. stock market could outperform the U.S. economy, thanks largely due to positive operating leverage. Since the pandemic, companies have adjusted their cost structures aggressively. This has come with strategic layoffs and investment in new equipment, including hardware powered by AI. These moves are resulting in positive operating leverage, which means a modest amount of sales growth β in the cooling economy β is translating to robust earnings growth.
Mind the ever-present risks: Of course, this does not mean we should get complacent. There will always be risks to worry about β such as U.S. political uncertainty, geopolitical turmoil, energy price volatility, cyber attacks, etc. There are also the dreaded unknowns. Any of these risks can flare up and spark short-term volatility in the markets.
Investing is never a smooth ride: Thereβs also the harsh reality that economic recessions and bear markets are developments that all long-term investors should expect to experience as they build wealth in the markets. Always keep your stock market seat belts fastened.
Think long term: For now, thereβs no reason to believe thereβll be a challenge that the economy and the markets wonβt be able to overcome over time. The long game remains undefeated, and itβs a streak long-term investors can expect to continue.
For more on how the macro story is evolving, check out the previous review of the macro crosscurrents Β»
Key insights about the stock market π
Hereβs a roundup of some of TKerβs most talked-about paid and free newsletters about the stock market. All of the headlines are hyperlinked to the archived pieces.
10 truths about the stock market π
The stock market can be an intimidating place: Itβs real money on the line, thereβs an overwhelming amount of information, and people have lost fortunes in it very quickly. But itβs also a place where thoughtful investors have long accumulated a lot of wealth. The primary difference between those two outlooks is related to misconceptions about the stock market that can lead people to make poor investment decisions.
The makeup of the S&P 500 is constantly changing π
Passive investing is a concept usually associated with buying and holding a fund that tracks an index. And no passive investment strategy has attracted as much attention as buying an S&P 500 index fund. However, the S&P 500 β an index of 500 of the largest U.S. companies β is anything but a static set of 500 stocks.

The key driver of stock prices: Earningsπ°
For investors, anything you can ever learn about a company matters only if it also tells you something about earnings. Thatβs because long-term moves in a stock can ultimately be explained by the underlying companyβs earnings, expectations for earnings, and uncertainty about those expectations for earnings. Over time, the relationship between stock prices and earnings have a very tight statistical relationship.

Stomach-churning stock market sell-offs are normalπ’
Investors should always be mentally prepared for some big sell-offs in the stock market. Itβs part of the deal when you invest in an asset class that is sensitive to the constant flow of good and bad news. Since 1950, the S&P 500 has seen an average annual max drawdown (i.e., the biggest intra-year sell-off) of 14%.
How the stock market performed around recessions ππ
Every recession in history was different. And the range of stock performance around them varied greatly. There are two things worth noting. First, recessions have always been accompanied by a significant drawdown in stock prices. Second, the stock market bottomed and inflected upward long before recessions ended.

In the stock market, time pays β³
Since 1928, the S&P 500 generated a positive total return more than 89% of the time over all five-year periods. Those are pretty good odds. When you extend the timeframe to 20 years, youβll see that thereβs never been a period where the S&P 500 didnβt generate a positive return.

What a strong dollar means for stocks π
While a strong dollar may be great news for Americans vacationing abroad and U.S. businesses importing goods from overseas, itβs a headwind for multinational U.S.-based corporations doing business in non-U.S. markets.

Economy β Stock Market π€·ββοΈ
The stock market sorta reflects the economy. But also, not really. The S&P 500 is more about the manufacture and sale of goods. U.S. GDP is more about providing services.

Stanley Druckenmiller's No. 1 piece of advice for novice investors π§
β¦you don't want to buy them when earnings are great, because what are they doing when their earnings are great? They go out and expand capacity. Three or four years later, there's overcapacity and they're losing money. What about when they're losing money? Well, then theyβve stopped building capacity. So three or four years later, capacity will have shrunk and their profit margins will be way up. So, you always have to sort of imagine the world the way it's going to be in 18 to 24 months as opposed to now. If you buy it now, you're buying into every single fad every single moment. Whereas if you envision the future, you're trying to imagine how that might be reflected differently in security prices.
Peter Lynch made a remarkably prescient market observation in 1994 π―
Some event will come out of left field, and the market will go down, or the market will go up. Volatility will occur. Markets will continue to have these ups and downs. β¦ Basic corporate profits have grown about 8% a year historically. So, corporate profits double about every nine years. The stock market ought to double about every nine yearsβ¦ The next 500 points, the next 600 points β I donβt know which way theyβll goβ¦ Theyβll double again in eight or nine years after that. Because profits go up 8% a year, and stocks will follow. That's all there is to it.
Warren Buffett's 'fourth law of motion' π
Long ago, Sir Isaac Newton gave us three laws of motion, which were the work of genius. But Sir Isaacβs talents didnβt extend to investing: He lost a bundle in the South Sea Bubble, explaining later, βI can calculate the movement of the stars, but not the madness of men.β If he had not been traumatized by this loss, Sir Isaac might well have gone on to discover the Fourth Law of Motion: For investors as a whole, returns decrease as motion increases.
Most pros canβt beat the market π₯
According to S&P Dow Jones Indices (SPDJI), 65% of U.S. large-cap equity fund managers underperformed the S&P 500 in 2024. As you stretch the time horizon, the numbers get even more dismal. Over a three-year period, 85% underperformed. Over a 10-year period, 90% underperformed. And over a 20-year period, 92% underperformed. This 2023 performance follows 14 consecutive years in which the majority of fund managers in this category have lagged the index.

Proof that 'past performance is no guarantee of future results' π
Even if you are a fund manager who generated industry-leading returns in one year, history says itβs an almost insurmountable task to stay on top consistently in subsequent years. According to S&P Dow Jones Indices, just 4.21% of all U.S. equity funds in the top half of performance during the first year were able to remain in the top during the four subsequent years. Only 2.42% of U.S. large-cap funds remained in the top half
SPDJIβs report also considered fund performance relative to their benchmarks over the past three years. Of 738 U.S. large-cap equity funds tracked by SPDJI, 50.68% beat the S&P 500 in 2022. Just 5.08% beat the S&P in the two years ending 2023. And only 2.14% beat the index in the three years ending in 2024.

The odds are stacked against stock pickers π²
Picking stocks in an attempt to beat market averages is an incredibly challenging and sometimes money-losing effort. In fact, most professional stock pickers arenβt able to do this on a consistent basis. One of the reasons for this is that most stocks donβt deliver above-average returns. According to S&P Dow Jones Indices, only 24% of the stocks in the S&P 500 outperformed the average stockβs return from 2000 to 2022. Over this period, the average return on an S&P 500 stock was 390%, while the median stock rose by just 93%.

Thanks, Sam! A great reminder that it's the outliers drive the index growth overall, and consistently picking just those outliers is next to impossible.
As a side-note, I'm looking forward to the Covid related initial unemployment claims dropping off the 5-year chart completely - it's difficult to get a sense of the weekly trend when those dominate the graph scale.
So many great stats and takeaways from this piece. Nice work!