There are two main types of risk.
There are well-known risks that are at least somewhat priced into the markets. They are the lingering fears that are covered regularly in the news and surfaced in surveys. As long as new developments related to these risks aren’t much worse than what’s in the range of likely outcomes, markets can handle bad news relatively well.
And there are risks that are not well known, not widely discussed, and not priced into the markets. They often emerge as an unexpected shock event, which is when many market participants decide it’s time to price it in. The nature of the risk isn’t always the most problematic issue for investors. But the introduction of uncertainty alone is enough to send prices lower.
With that in mind, let’s talk about some risks.
What people are worried about 😬
A bunch of firms recently conducted surveys asking people what they’re worried about.
Let’s go through some of the findings.
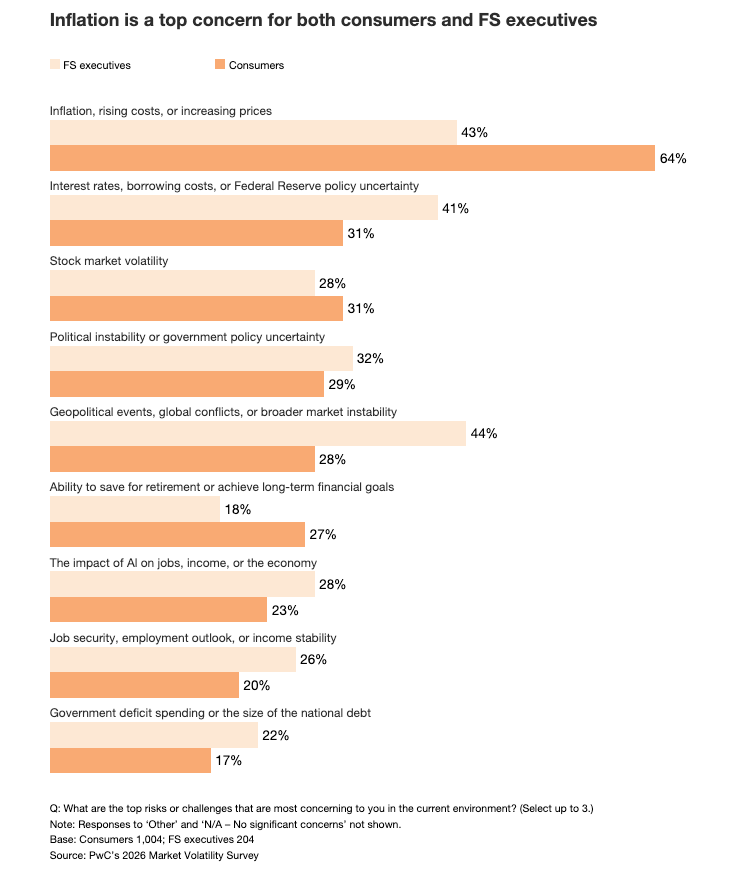
According to PwC’s Market Volatility Survey released last week, financial services executives’ top concerns include geopolitical events, inflation, interest rates, and government policy uncertainty. Consumers are particularly concerned about inflation, followed by interest rates and stock market volatility.
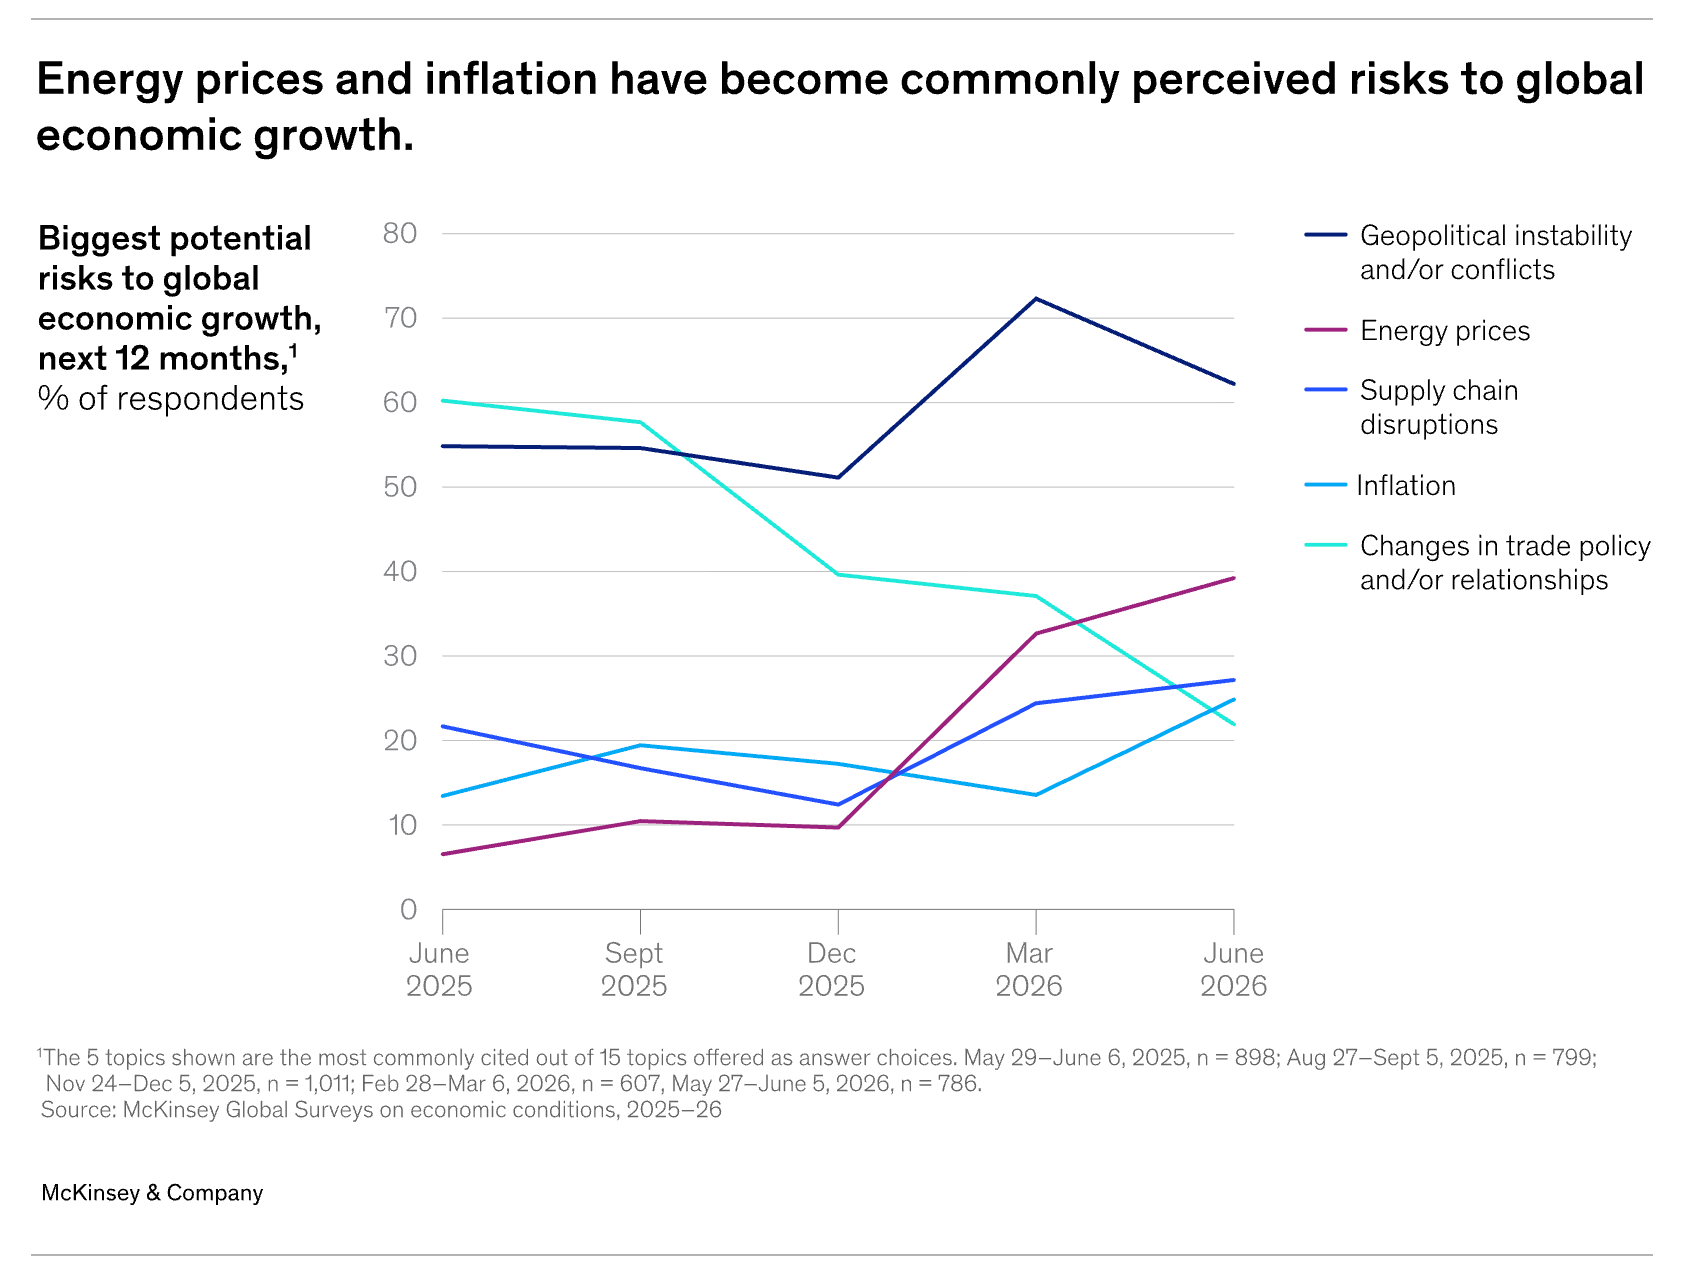
McKinsey’s June Economic Conditions survey revealed that executives saw geopolitical instability and energy prices as leading risks to global economic growth.
Natixis surveyed market strategists about their top concerns. Leading the way was inflation and the Iran war’s impact on oil prices. Strategists were also broadly concerned about how weak consumer confidence could hinder consumer spending.
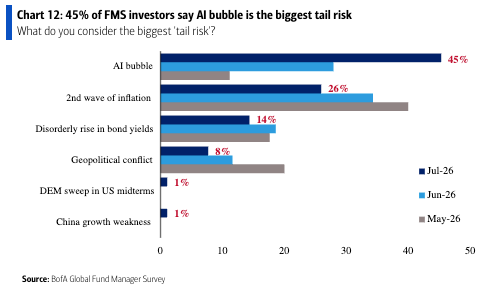
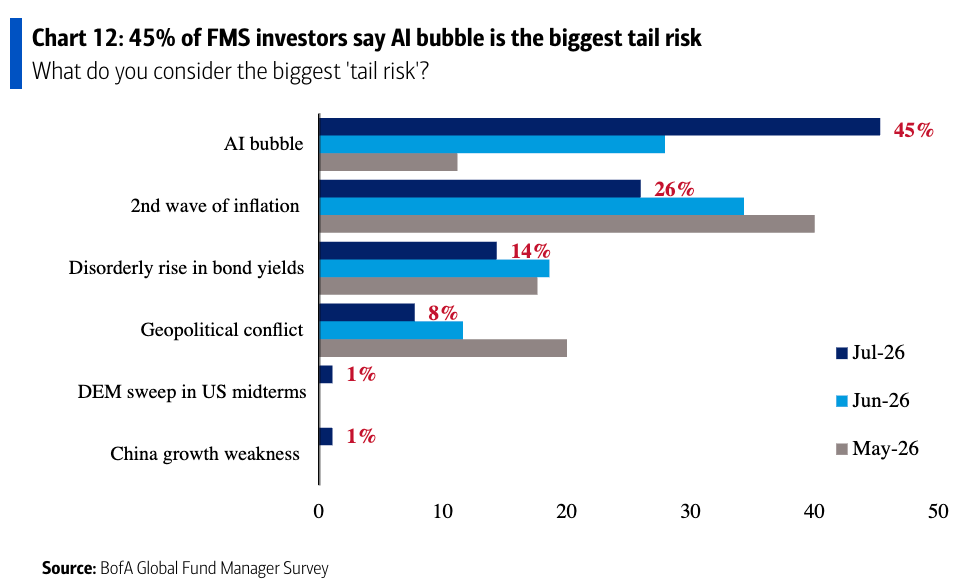
Meanwhile, BofA’s July Global Fund Manager Survey showed that participants ranked “AI bubble” as their biggest “tail risk.” That was followed by inflation, bond yields, and geopolitical conflict.
Each survey covers different types of people, and they all word questions differently.
That said, it seems people are generally concerned about inflation, geopolitics, and the stability of the stock and bond markets.
None of this is particularly surprising, as they are the stories dominating the news cycle in business media.
What’s worrisome is what’s not on these lists ⚖️
As TKer Stock Market Truth No. 7 reminds us, there will always be something to worry about.
It’s an inescapable reality of investing in the stock market.
On the bright side, these worries get priced into the market as a discount, which helps to explain why investor returns in the stock market tend to be relatively high.
When investors and traders are aware of a certain risk, they tend to adjust market prices in a way that anticipates the likelihood that a risk event could materialize to some degree. If the event comes to fruition and it’s not as bad as feared, markets tend to react positively. In other words, there are scenarios where bad things happen, and stocks rally.
It may seem counterintuitive. But it’s a positive for investors that there are many things the market is actively worried about. It keeps the market in check and less vulnerable to stomach-churning price swings.
On the other hand, the most destabilizing risks are the ones people aren’t talking about. The unknown unknowns. This is TKer Stock Market Truth No. 8.
Every once in a while, we get an event that’s out of mind or considered extremely unlikely. Consider the attacks on Iran earlier this year, the announcement of sweeping tariffs last year, the failure of Silicon Valley Bank three years ago, or the emergence of COVID-19 six years ago.
Even if these sudden shock events prove benign to economic activity and corporate earnings, the introduction of uncertainty alone is enough to compress valuations and send stock prices lower.
Unfortunately, there’s not much you can do about these unknown unknowns. There’s no knowing what’s coming and when they’ll emerge (unless you’ve got some inside information). There’s also the possibility they’ll never emerge.
The best we can do is understand that sometimes, things will come out of nowhere and send shockwaves through the markets. And given a little time, these things become another one of those more manageable risks that surface on many surveys for months.
The good news is that the stock market has a long history of recovering from unexpected shock events, which means any drop in prices has proven to be a buying opportunity for long-term investors.
An important note on consumers, businesses, and earnings 🤔
It’s not just markets that adjust when traders become aware of new risks. Given time, consumers and businesses adjust as well.
Consumers will make tweaks to their spending and saving behavior. Maybe they’ll work more or change jobs to address new realities.
Businesses will reorganize and restructure their operations, including adjusting supply chains and moving workforces, all with the intent of preserving earnings growth and creating shareholder value.
All this is to say that the economy doesn’t take risks lying down. So, in addition to considering the challenges presented by risks, investors should also think about what could go right.
-
Related from TKer:
Review of the macro crosscurrents 🔀
📉The stock market declined last week, with the S&P 500 shedding 1.5% to end at 7,457.69. The index is now down 2.0% from its June 2 closing high of 7,609.78 and up 8.9% year-to-date. For market insights, check out the Stock Market tab at TKer. »
There were several notable data points and macroeconomic developments since our last review:
🏦 America’s top banks confirm that the economy remains resilient: From JPMorgan’s Jamie Dimon: “The U.S. economy has demonstrated notable resiliency this year, with stronger business investment and hiring. This strength is being supported by several tailwinds, including AI-driven capital investment, fiscal stimulus, and the benefits of more efficient regulation. However, several risks are shifting below the surface like tectonic plates, including geopolitical tensions and wars, sticky inflation, large global fiscal deficits, and elevated asset prices. We cannot predict how these forces will ultimately play out. They may remain manageable, but they could also cause meaningful disruptions when they shift or collide.”
Here’s Wells Fargo’s Charlie Scharf: “Consumers and businesses remain very strong. Consumer spending is higher, charge-offs and delinquencies are lower, and savings and investments are growing across consumer segments. Businesses are cautious, but balance sheets and cash flows remain strong, resulting in strong credit performance. Equity indices are at or near all-time highs, credit spreads are narrow, and there is a significant amount of liquidity being deployed by banks and non-banks. Concerns around affordability and inflation exist, but the labor market and wage growth remain strong. We know that such favorable conditions do not go on forever, so we are being selective about how much and where to grow. Our goal is to build sustainable higher returns and higher growth that can endure the inevitable market shocks and economic cycles.”
And BofA’s Brian Moynihan: “Against a healthy economic backdrop, resilient consumers and businesses are turning to Bank of America to spend, borrow and invest.”
These statements echo what was said three months ago. For more, read: America’s top bankers confirm: The economy remains resilient 💪
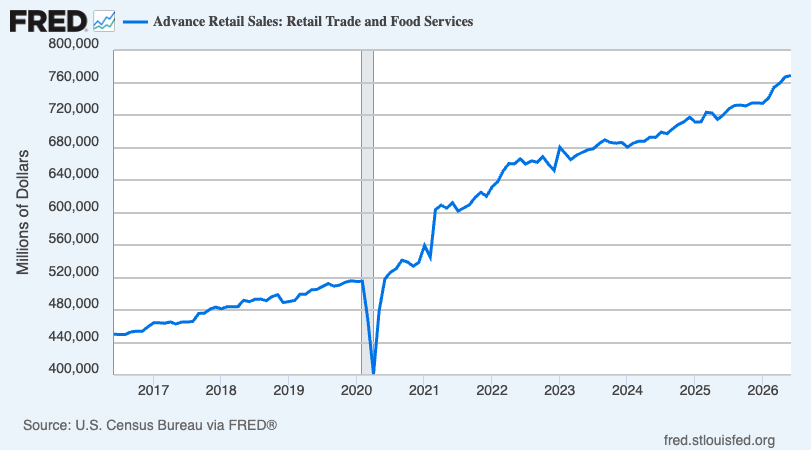
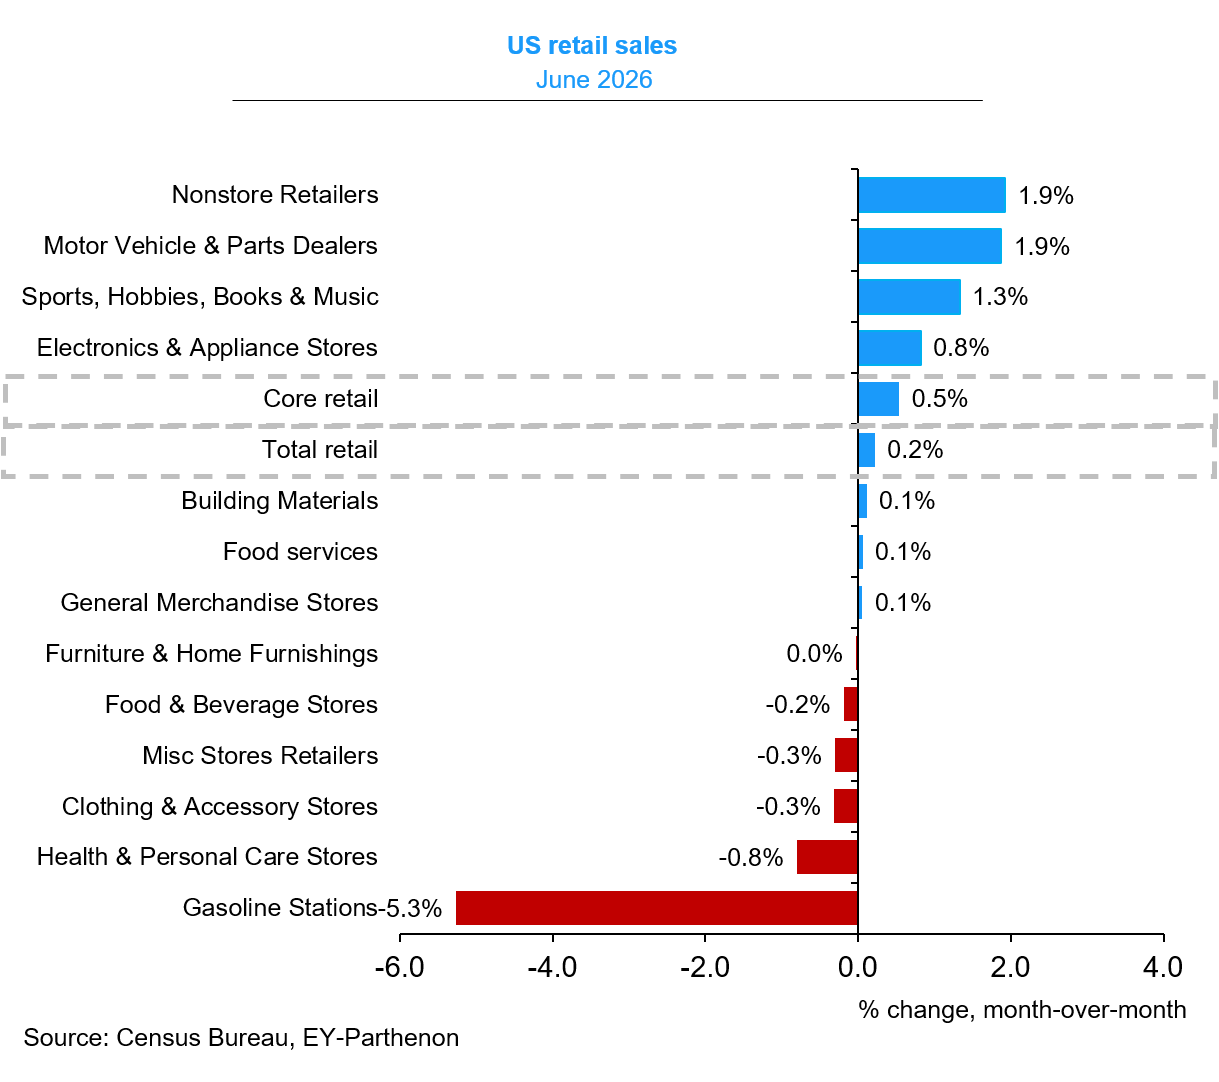
🛍️ Retail shopping activity rose. Retail sales in June increased 0.2% to a record $768.6 billion, as lower spending on gasoline was more than offset by strength in other categories.
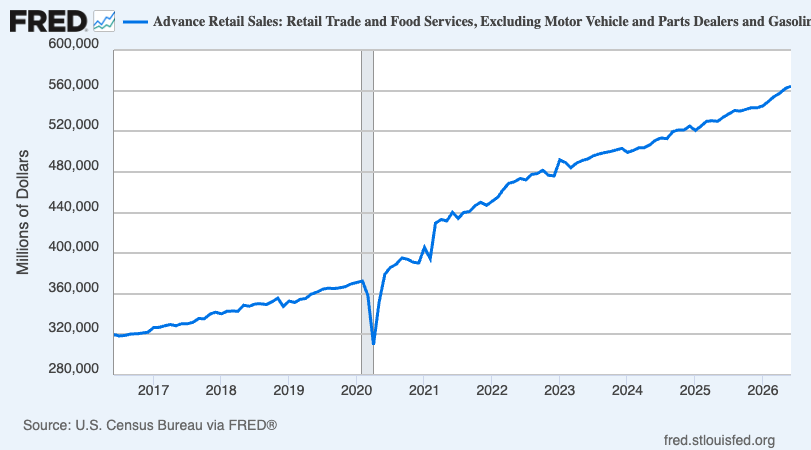
Excluding autos and gas, which tend to be volatile in the short term, retail sales climbed 0.4%.
Here’s a look at nominal sales by category.
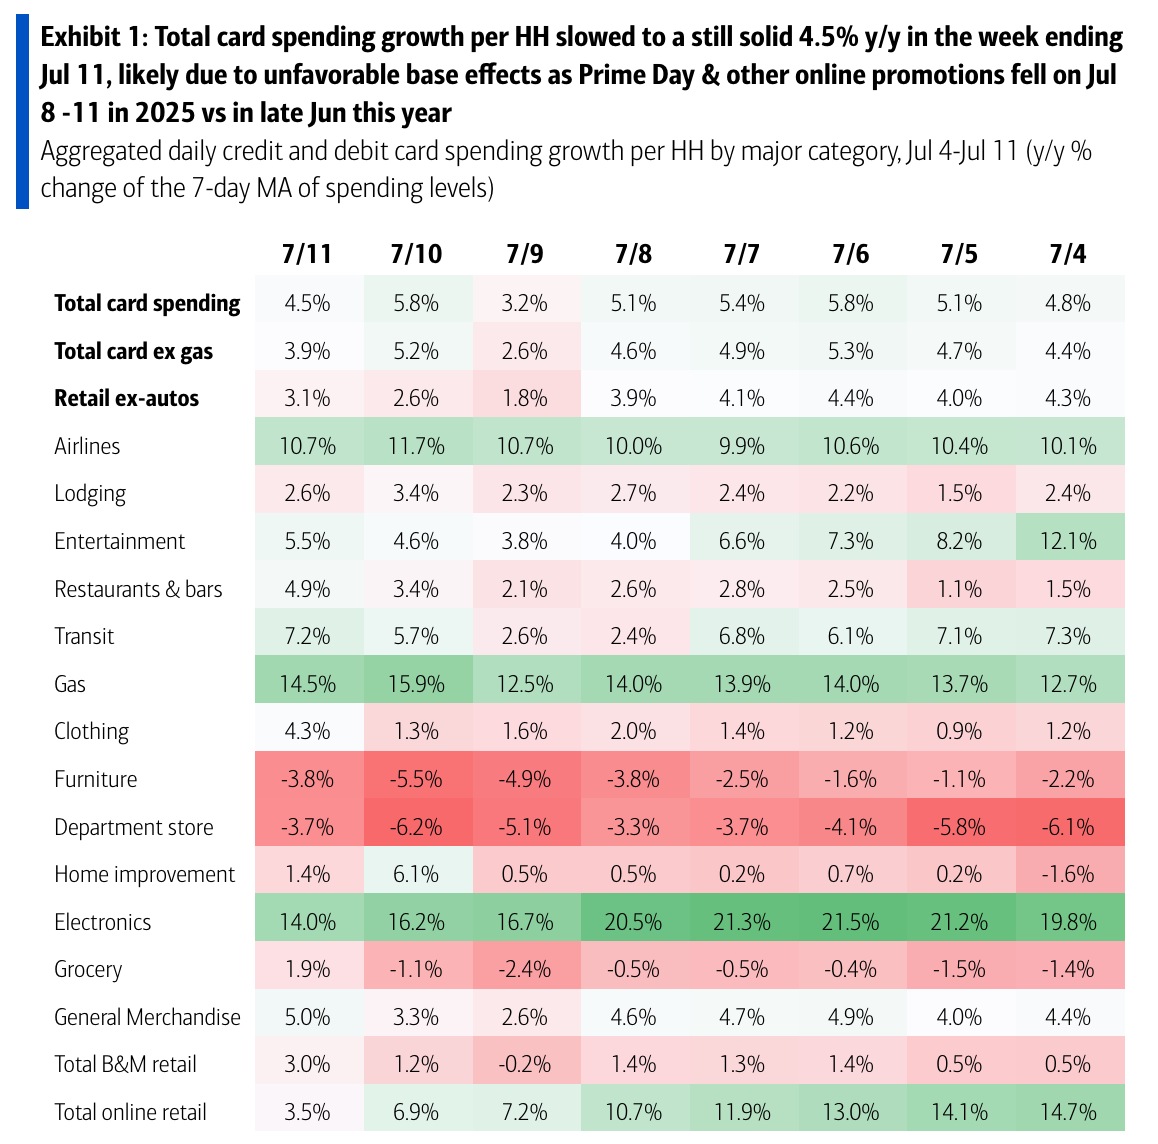
💳 Card spending data is holding up. From BofA: “Total card spending per HH was up 4.5% y/y in the week ending Jul 11, according to BAC aggregated credit & debit card data. Spending growth slowed but remains solid, likely due to unfavorable base effects from Prime Day timing change vs last year. Divergence in restaurants spending growth between host cities & rest of U.S. persists despite number of games coming down.”
Consumer spending data has looked a lot better than consumer sentiment readings. For more on this contradiction, read: We’re taking that vacation whether we like it or not 🛫 and Household finances are both ‘worse’ and ‘good’ 🌦️
👎 Consumer vibes improve slightly, but remain in the dump. From the University of Michigan’s July Surveys of Consumers: “With the second straight month of 10% jumps, consumer sentiment climbed to its highest reading since February of this year on the basis of easing price pressures at the pump in recent weeks. All five index components improved, led by significant 20% increases in buying conditions for durables as well as year-ahead business conditions. This month’s rise in sentiment was pervasive across the population, seen across groups by age, income, wealth, and political party. Particularly strong increases were seen among consumers without a bachelor’s degree. However, with prices remaining frustratingly high, consumers are hardly ebullient about the economy; sentiment is down 12% from a year ago. Thus, sentiment’s upward momentum may prove difficult to sustain if recent declines in gas prices continue to reverse course. Interviews for this release spanned June 23 to July 13, with more than 70% completed before the resumption of US strikes against Iran on July 7 and the subsequent increase in gas prices.”
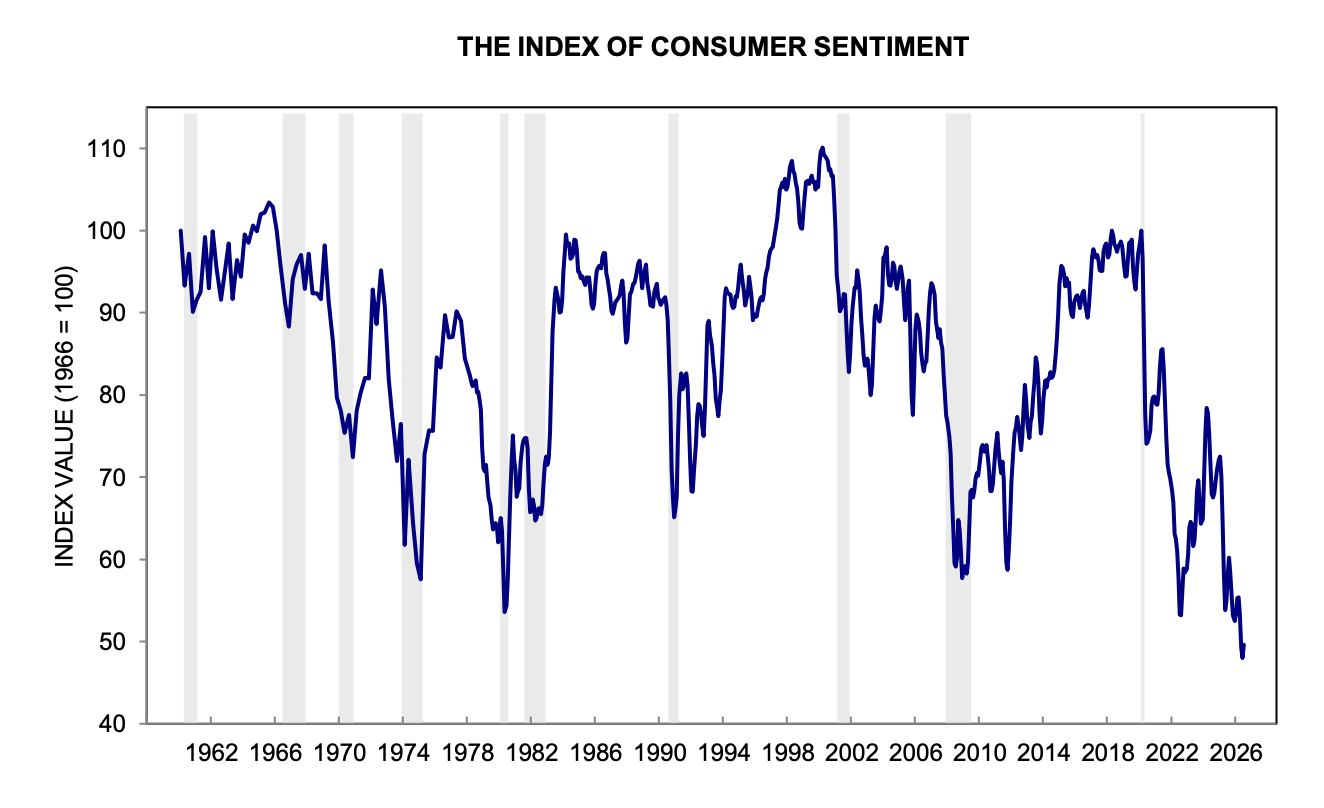
For more on consumer sentiment, read: What consumers do > what consumers say 🙊
🎈Consumer price inflation cooled as gas prices fell. The Consumer Price Index (CPI) increased 3.5% year-over-year in June, down from 4.2% the month prior, as energy prices declined. Adjusted for food and energy prices, core CPI was up 2.6%.
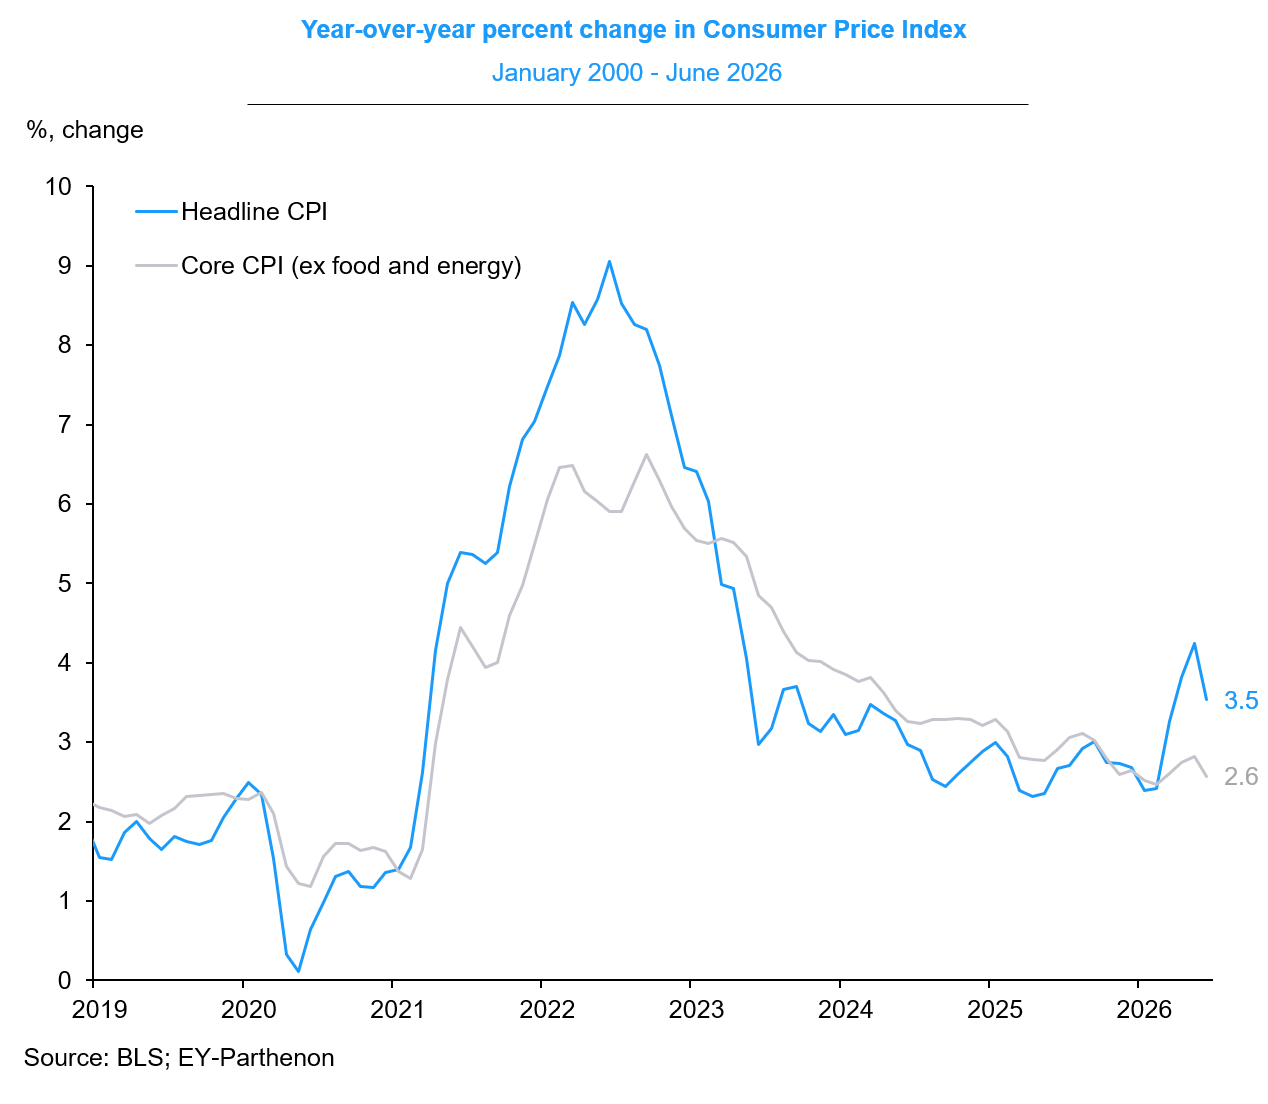
On a month-over-month basis, CPI declined 0.4% as energy prices fell 5.7%. Core CPI was relatively flat, ticking down by just 0.02%. If you annualize the three-month and six-month figures — a reflection of the short-term trend in prices — core CPI climbed 2.3% and 2.6%, respectively.
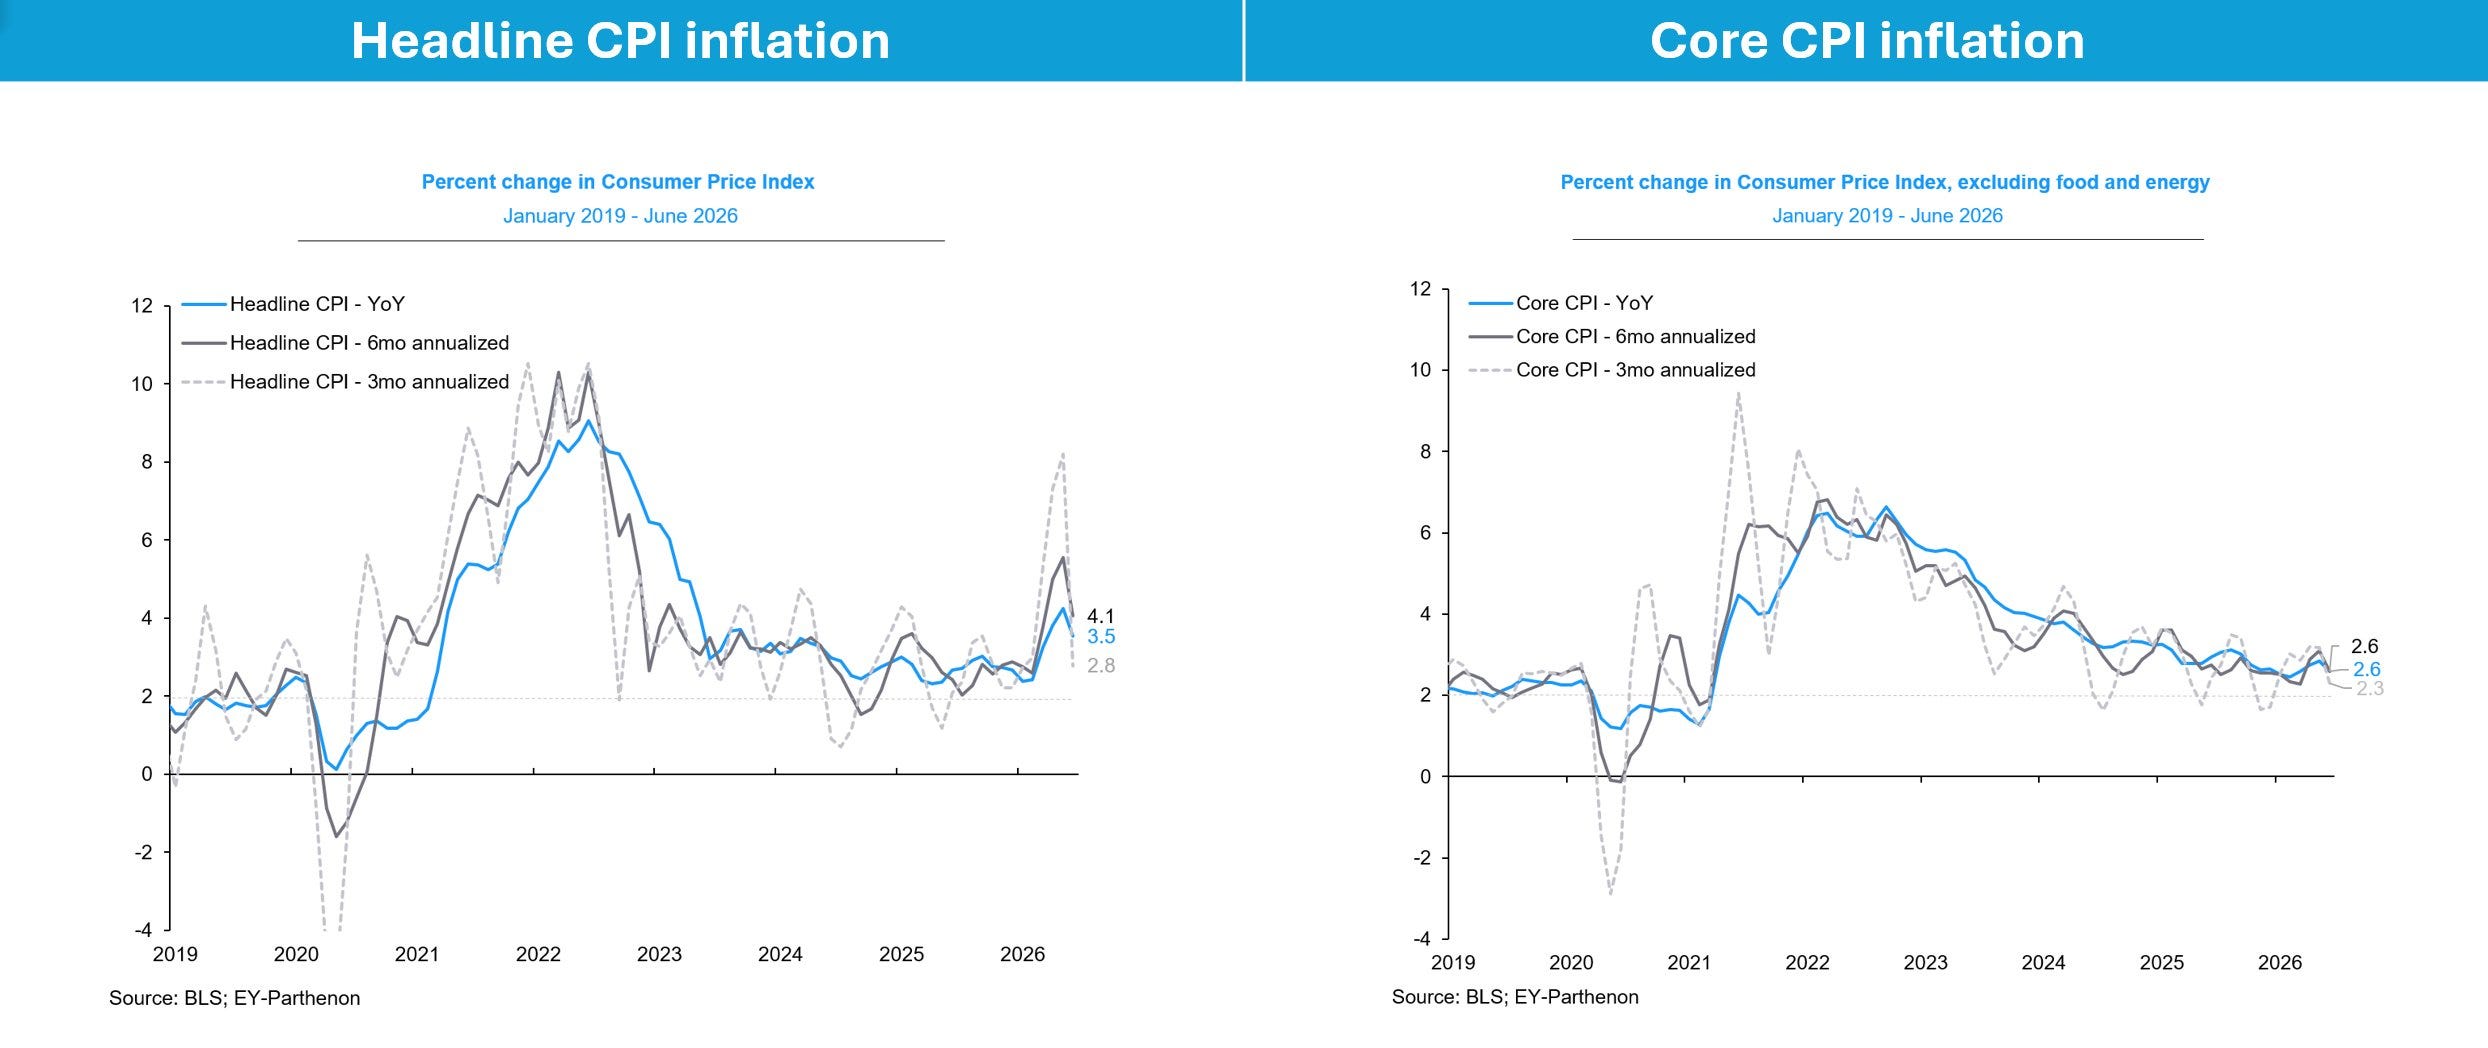
While inflation rates have cooled over the years, they remain above the Fed’s 2% target rate.
For more discussion on inflation and monetary policy, read: The other side of the Fed’s inflation ‘mistake’ 🧐 and ‘When will the Fed cut rates?’ is not the right question for investors right now ✂️
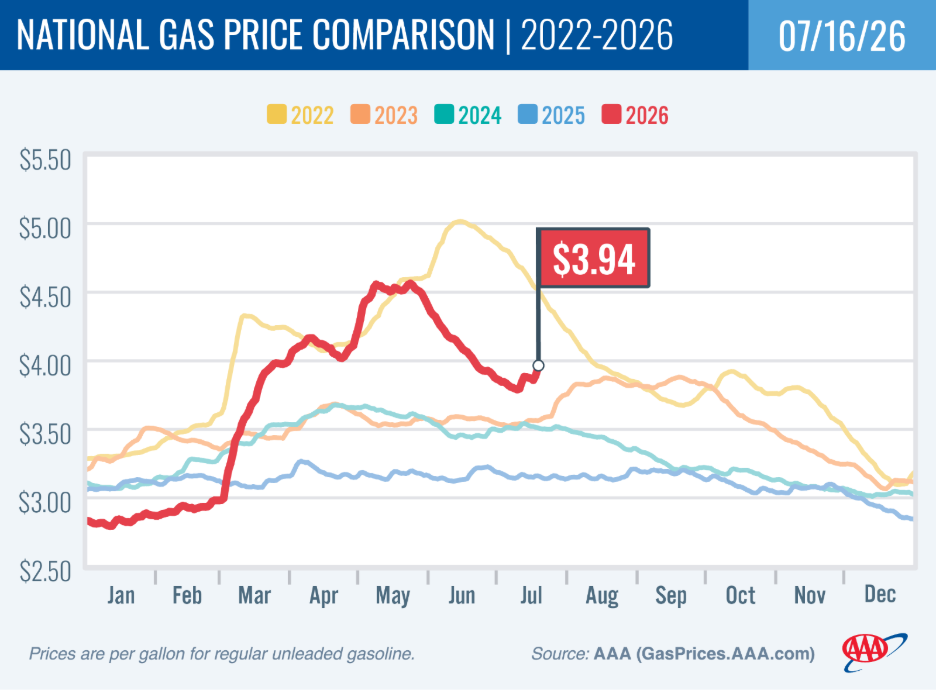
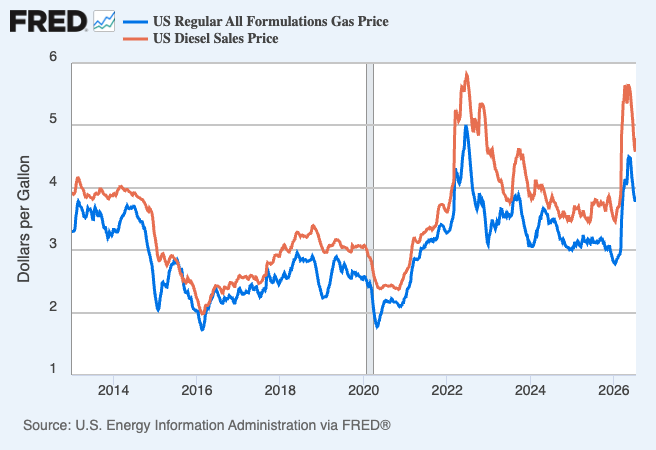
⛽️ Gas prices tick up. From AAA: “The national average for a gallon of regular gasoline went up 10 cents since last week to $3.94. Instability along the Strait of Hormuz is contributing to the increase at the pump and pushing crude oil prices toward $80 per barrel.”
Here’s a longer-term look at the trajectory of gas and diesel prices, as tracked by the EIA.
For more on energy prices, read: Our love-hate relationship with rising oil prices in charts 💔🛢️📊
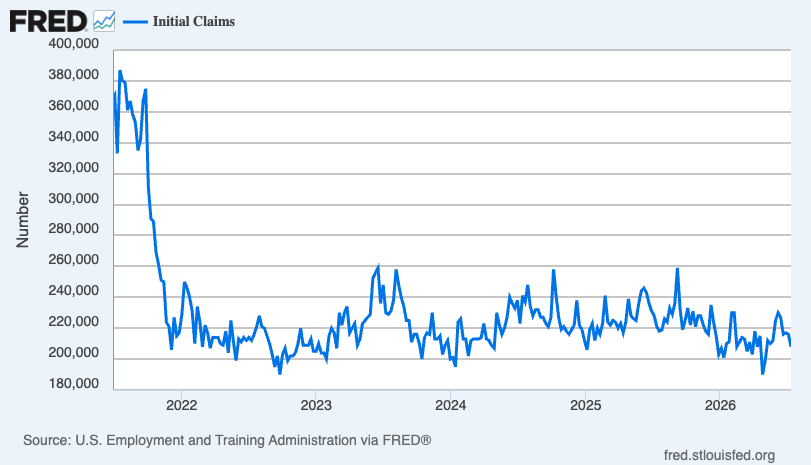
💼 New unemployment insurance claims, total ongoing claims remain low. Initial claims for unemployment benefits declined to 208,000 during the week ending July 11, down from 216,000 the week prior. This metric remains at levels historically associated with economic growth.
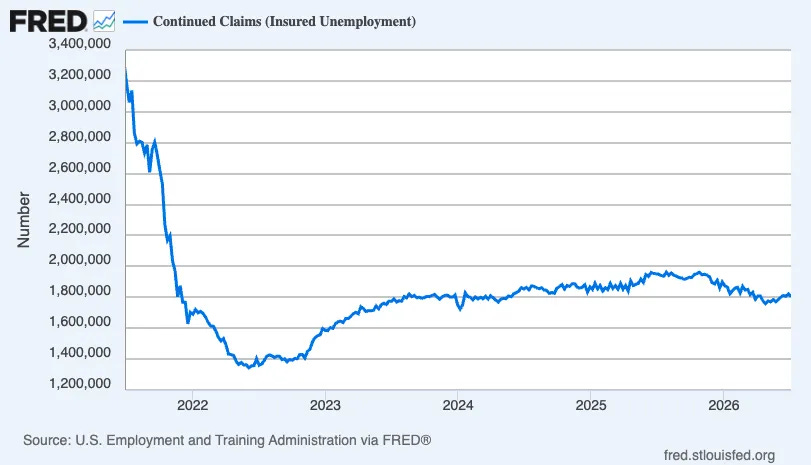
Insured unemployment, which captures those who continue to claim unemployment benefits, ticked down to 1.805 million during the week ending July 4.
For more on the labor market, read: Why mass tech layoffs have little effect on total employment 💾
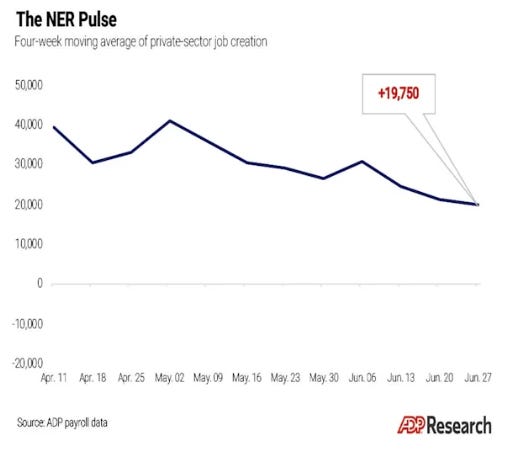
🤔 Recent private job growth is positive. According to payroll processor ADP, private U.S. employers added 19,750 jobs in the four weeks ending June 27.
For more on the labor market, read: Things are looking up in the labor market 👍
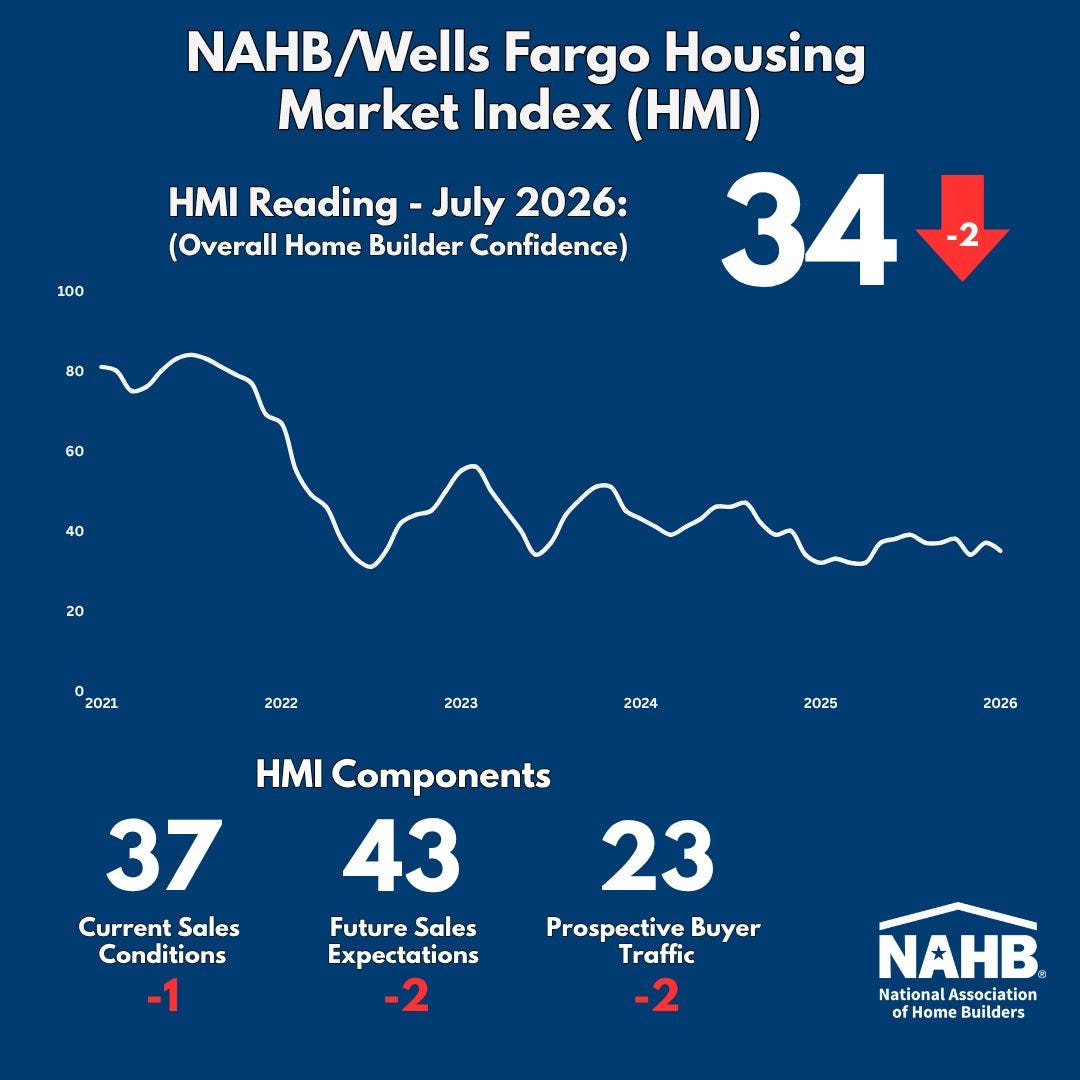
🏠 Homebuilder sentiment ticks lower. From the NAHB: “With the HMI below 40 for 15 straight months, affordability remains the home building industry’s primary challenge, as elevated mortgage rates, costly land, rising material prices, and persistent skilled labor shortages continue to affect the market. Looking ahead, the newly enacted housing law is a positive step that will help expand housing supply and lower overall housing costs, although more policy change is needed at the state and local level.”
🔨 New home construction starts rise. Housing starts jumped 19.0% in June to an annualized rate of 1.43 million units, according to the Census Bureau. Building permits fell 3.0% to an annualized rate of 1.37 million units.
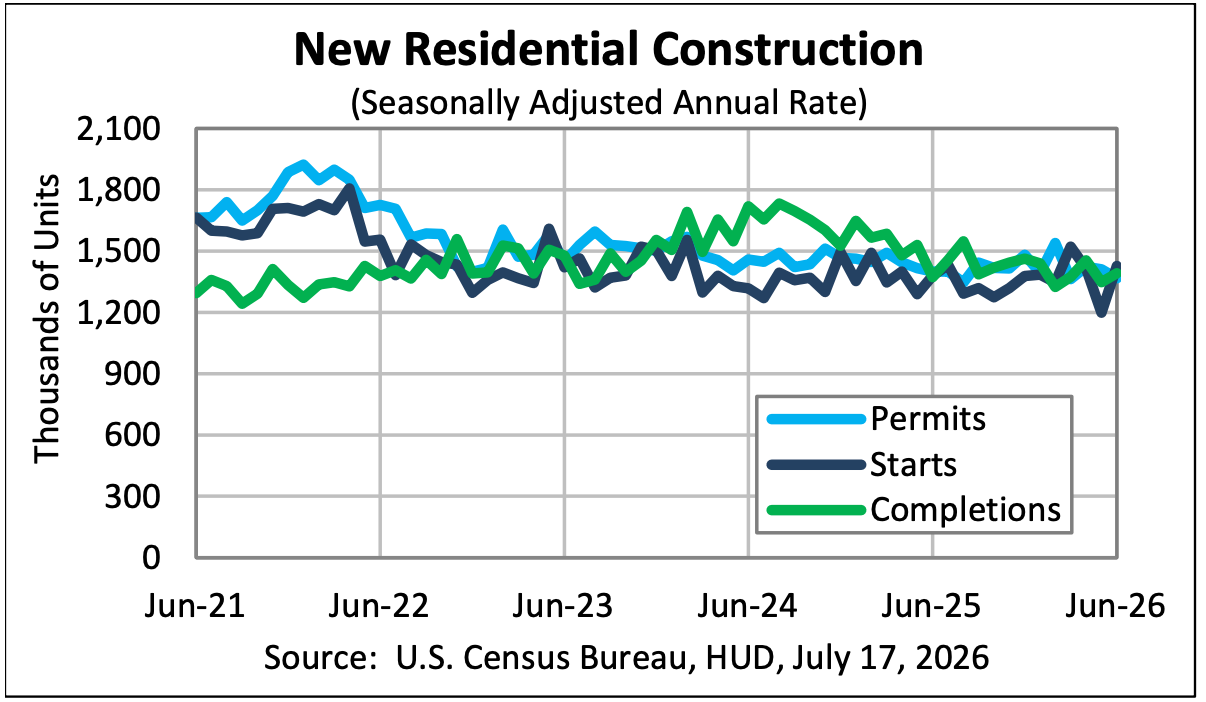
It’s worth noting that the starts metric comes with a very large margin of error. For more on margins of error, read: Mathematical context can totally change the story 🧮
🏠 Mortgage rates tick higher. According to Freddie Mac, the average 30-year fixed-rate mortgage rose to 6.55%, up from 6.49% last week. From Freddie Mac: “Purchase application demand has weakened recently, but housing affordability is more favorable and housing inventory continues to rise, thus the backdrop for prospective homebuyers is modestly improving.”
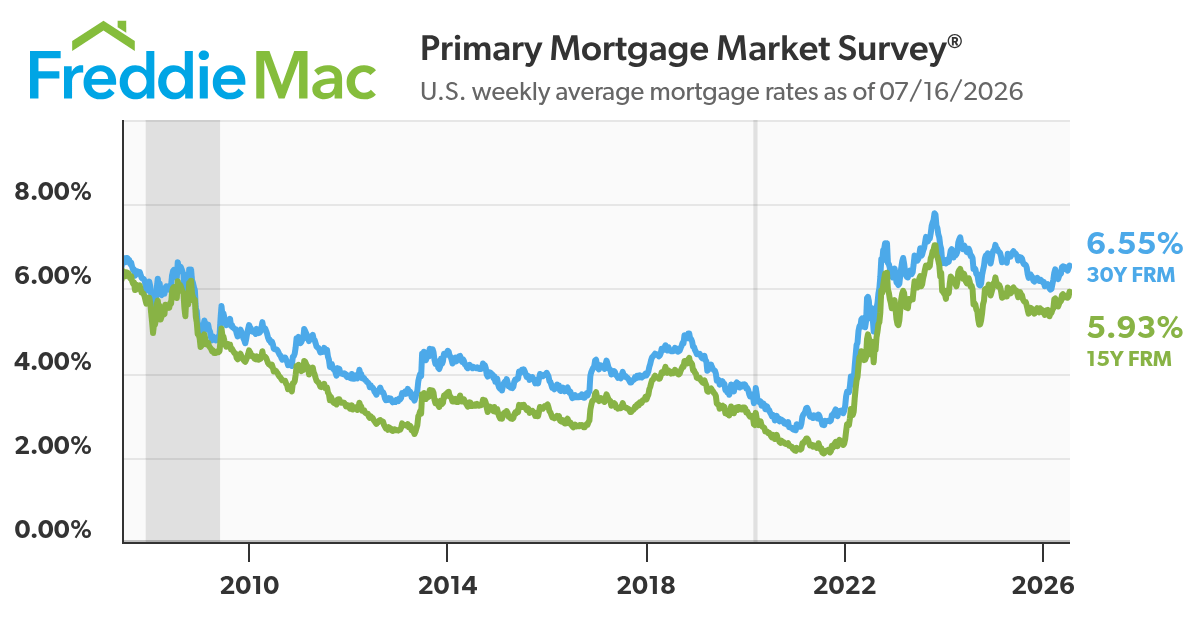
As of Q1, there were 147.6 million housing units in the U.S., of which 86.0 million were owner-occupied and about 40% were mortgage-free. Of those carrying mortgage debt, almost all have fixed-rate mortgages, and most of those mortgages have rates that were locked in before rates surged from 2021 lows. All of this is to say: Most homeowners are not particularly sensitive to the small weekly movements in home prices or mortgage rates.
For more on mortgages and home prices, read: Why home prices and rents are creating all sorts of confusion about inflation 😖
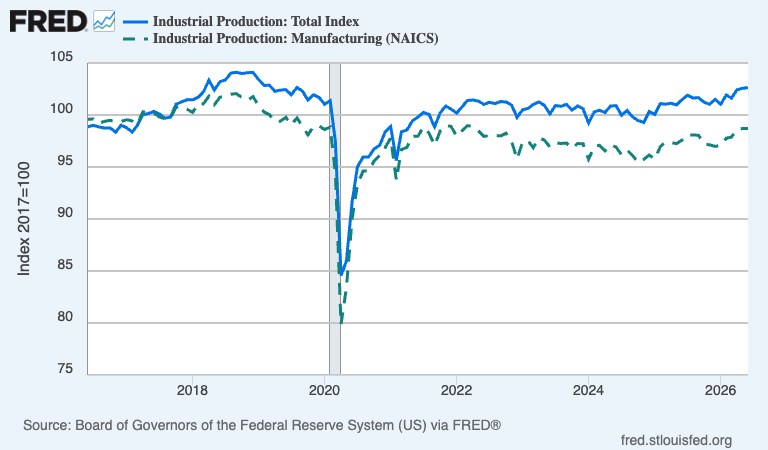
🛠️ Industrial activity increased. Industrial production activity in June rose 0.1% from prior month levels. Manufacturing output was unchanged compared to the prior month.
👎 Small business optimism ticks higher, remains cool. The NFIB’s Small Business Optimism Index rose to 97.4 in June from 95.3 in May. From the NFIB: “Current economic conditions present small business owners with both encouraging developments and ongoing challenges. Lower fuel costs provide welcome relief for businesses as well as consumers, with firms anticipating improved operating conditions over the next six months. While there have been improvements in the overall environment, high interest rates and modest economic growth are causing owners to approach hiring and capital spending with caution.”
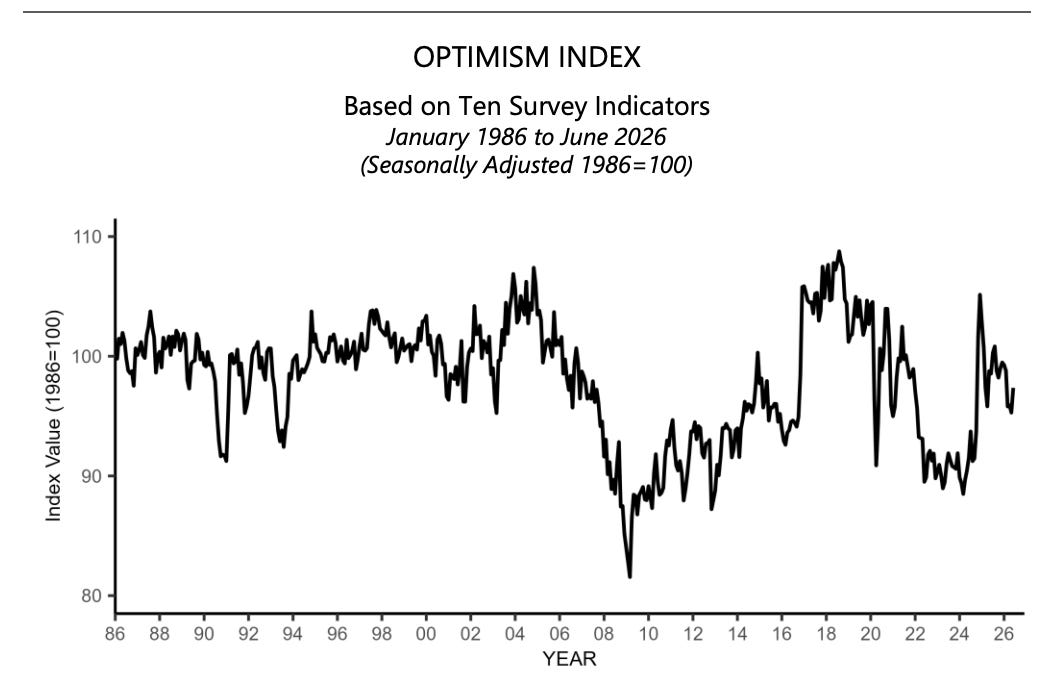
Keep in mind that during times of perceived stress, soft survey data tends to be more exaggerated than actual hard data.
For more on this, read: What businesses do > what businesses say 🙊 and 4 sometimes-conflicting ways I’m thinking about the economy 😬😞😎🙃
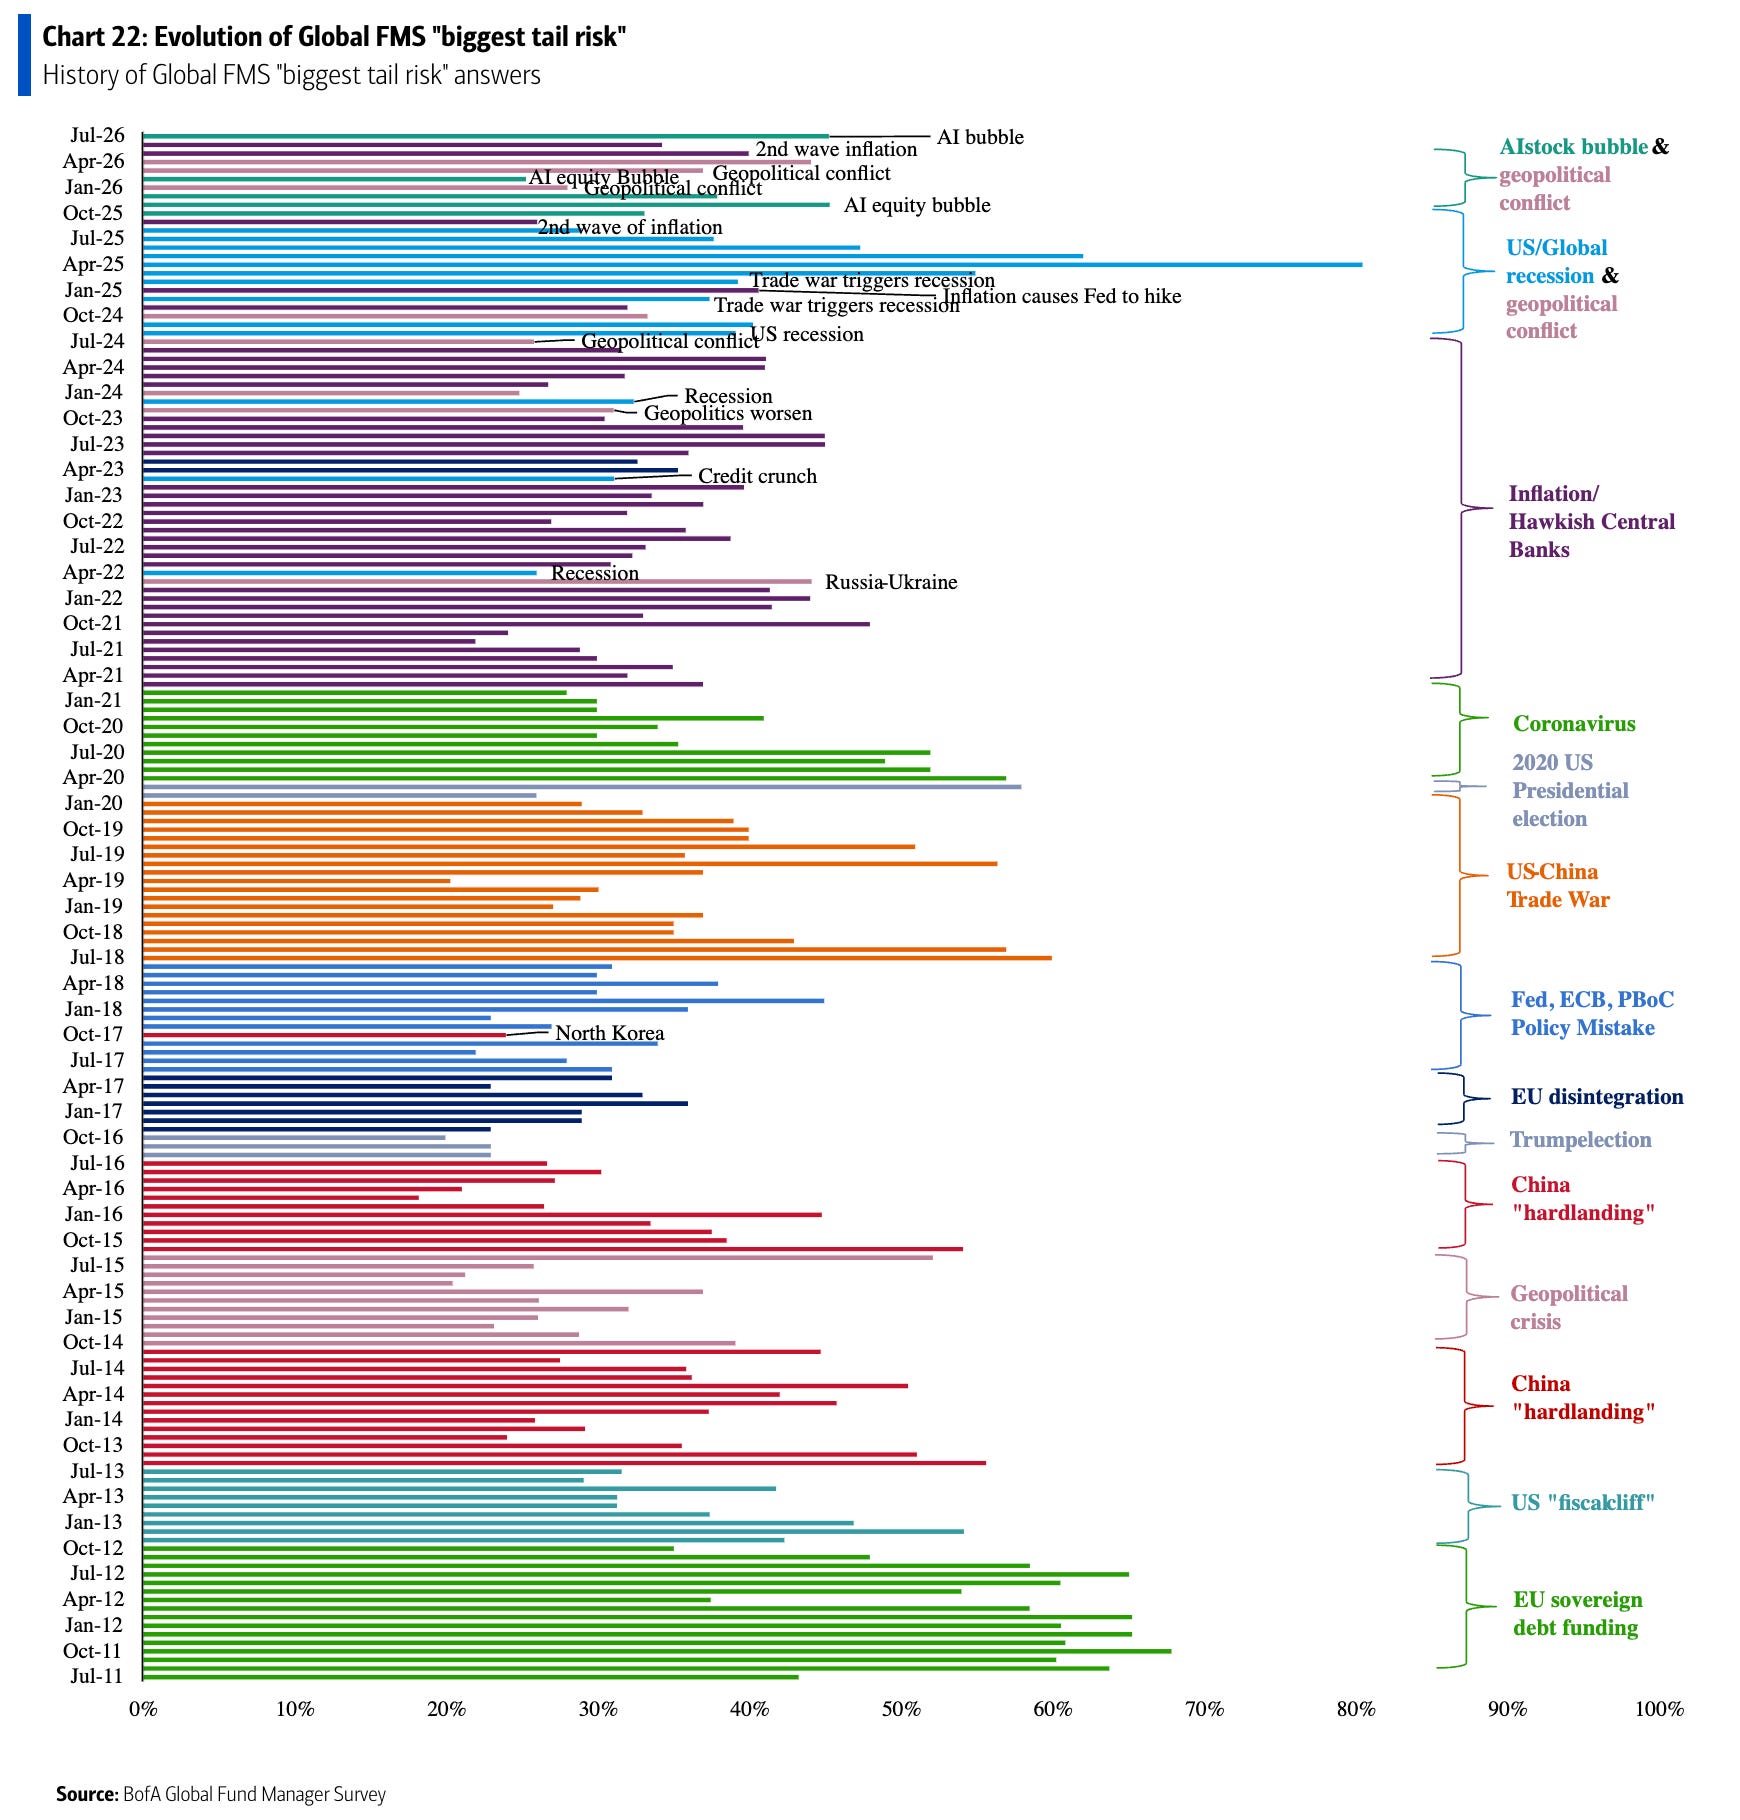
😬 This is the stuff pros are worried about. From BofA’s July Global Fund Manager Survey: “‘AI bubble’ rose to the top spot for the biggest tail risk in July per 45% of FMS investors (up from 28% last month). In June, the #1 perceived tail risk was ‘2nd wave inflation’… this has dropped to #2 (26% of investors, from 34%).”
Here’s how the biggest “tail risk” has evolved over the years.
For more on risks, read: Three observations about uncertainty in the markets 😟 and Two times when uncertainty seemed low and confidence was high 🌈
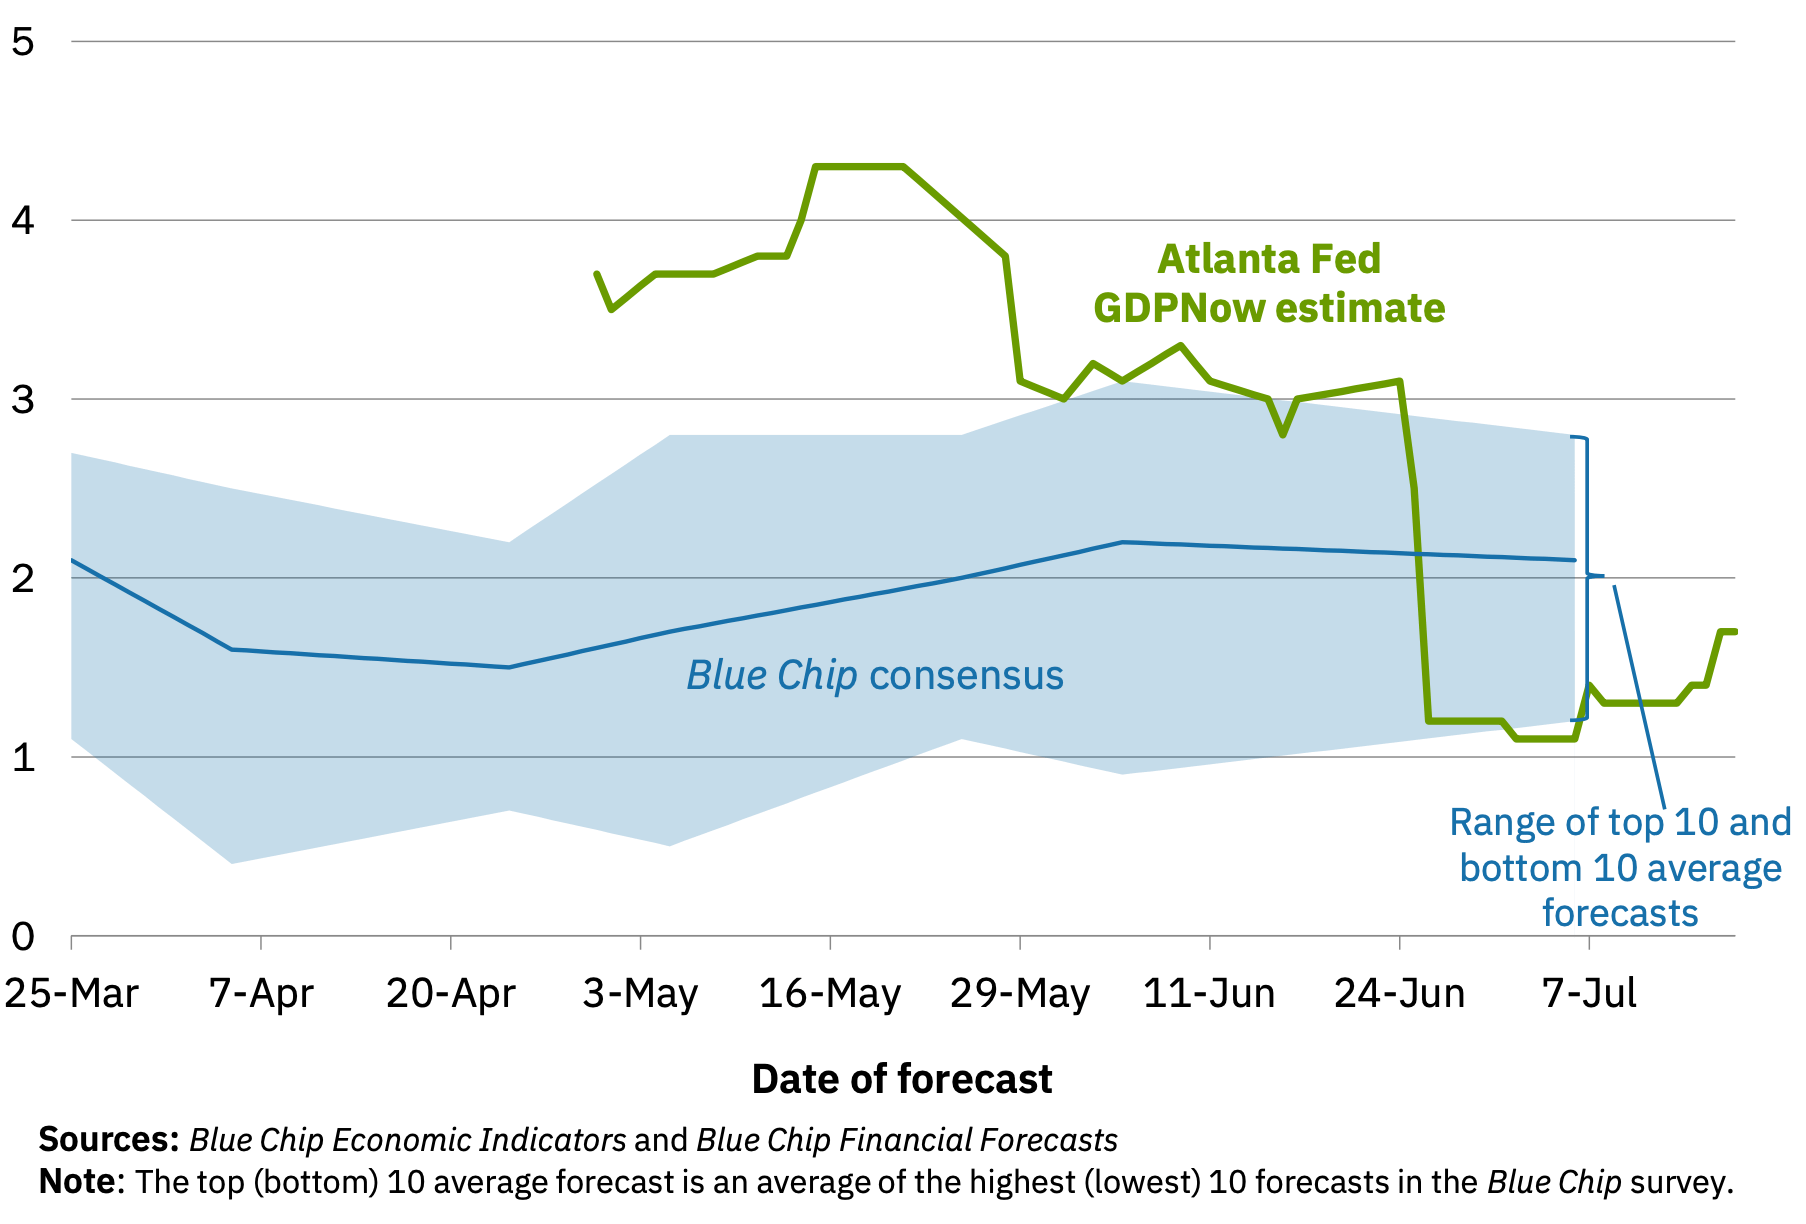
📈 Near-term GDP growth estimates are tracking positively. The Atlanta Fed’s GDPNow model sees real GDP growth rising at a 1.7% rate in Q2.
For more on GDP and the economy, read: It’s too ambiguous to just say ‘the economy’ 🤦🏻♂️ and Economic data can often be both ‘worse’ and ‘good’ 🌦️
Putting it all together 📋
Earnings look bullish: The long-term outlook for the stock market remains favorable, bolstered by expectations for years of earnings growth. And earnings are the most important driver of stock prices.
Demand is positive: Demand for goods and services remains positive, supported by healthy consumer and business balance sheets. Personal spending activity remains at record levels. Core capex orders, which are a leading indicator of business spending, have been trending higher.
Growth rates have cooled: While the economy remains healthy, growth has normalized from much hotter levels earlier in the cycle. The economy is less “coiled” these days as major tailwinds like job openings and excess savings have faded. Job creation, while positive, is not as hot as it used to be. It has become harder to argue that growth is destiny.
Actions speak louder than words: We are in an odd period, given that the hard economic data decoupled from the soft sentiment-oriented data. Consumer and business sentiment has been relatively poor, even as tangible consumer and business activity continues to grow and trend at record levels. From an investor’s perspective, what matters is that the hard economic data continues to hold up.
Stocks are not the economy: There’s a case to be made that the U.S. stock market could outperform the U.S. economy in the near term, thanks largely to positive operating leverage. Since the pandemic, companies have aggressively adjusted their cost structures. This came with strategic layoffs and investment in new equipment, including hardware powered by AI. These moves are resulting in positive operating leverage, which means a modest amount of sales growth — in the cooling economy — is translating to robust earnings growth.
Mind the ever-present risks: Of course, we should not get complacent. There will always be risks to worry about, such as U.S. political uncertainty, geopolitical turmoil, energy price volatility, and cyber attacks. There are also the dreaded unknowns. Any of these risks can flare up and spark short-term volatility in the markets.
Investing is never a smooth ride: There’s also the harsh reality that economic recessions and bear markets are developments that all long-term investors should expect as they build wealth in the markets. Always keep your stock market seat belts fastened.
Think long-term: For now, there’s no reason to believe there’ll be a challenge that the economy and the markets won’t overcome. The long game remains undefeated, and it’s a streak that long-term investors can expect to continue.
For more on how the macro story is evolving, check out the previous review of the macro crosscurrents. »
Key insights about the stock market 📈
Here’s a roundup of some of TKer’s most talked-about paid and free newsletters about the stock market. All of the headlines are hyperlinked to the archived pieces.
10 truths about the stock market 📈
The stock market can be an intimidating place: It’s real money on the line, there’s an overwhelming amount of information, and people have lost fortunes in it very quickly. But it’s also a place where thoughtful investors have long accumulated a lot of wealth. The primary difference between those two outlooks is related to misconceptions about the stock market that can lead people to make poor investment decisions.
The makeup of the S&P 500 is constantly changing 🔀
Passive investing is a concept usually associated with buying and holding a fund that tracks an index. And no passive investment strategy has attracted as much attention as buying an S&P 500 index fund. However, the S&P 500 — an index of 500 of the largest U.S. companies — is anything but a static set of 500 stocks.

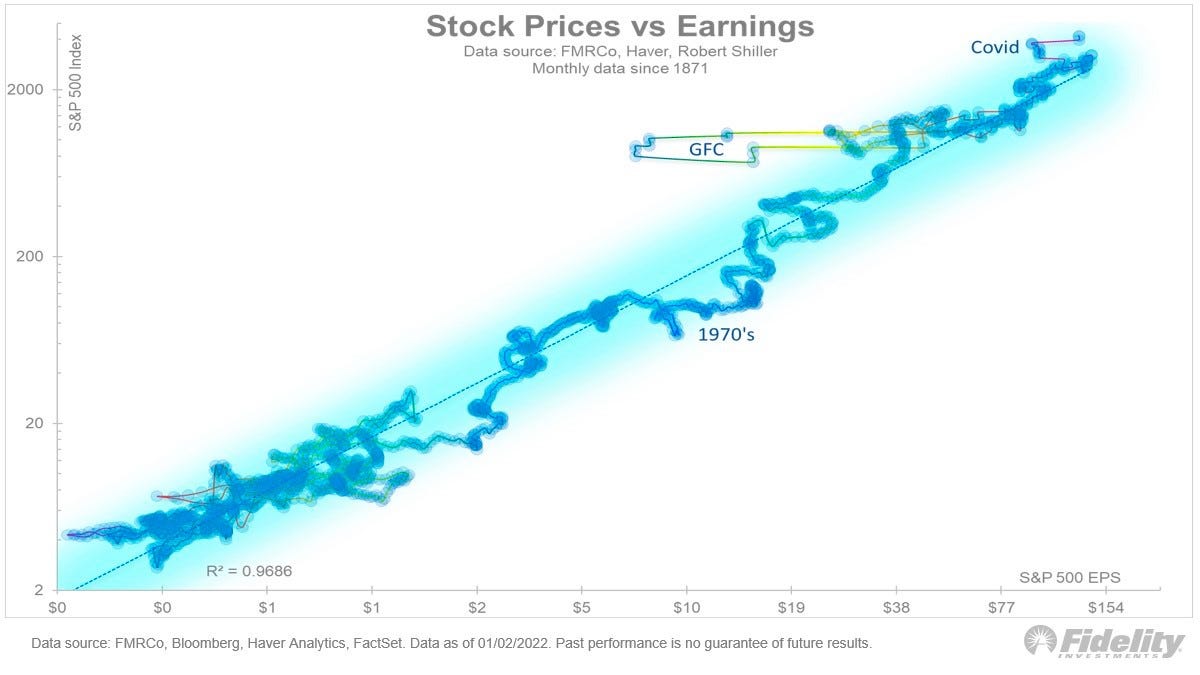
The key driver of stock prices: Earnings💰
For investors, anything you can ever learn about a company matters only if it also tells you something about earnings. That’s because long-term moves in a stock can ultimately be explained by the underlying company’s earnings, expectations for earnings, and uncertainty about those expectations for earnings. Over time, the relationship between stock prices and earnings has a very tight statistical relationship.
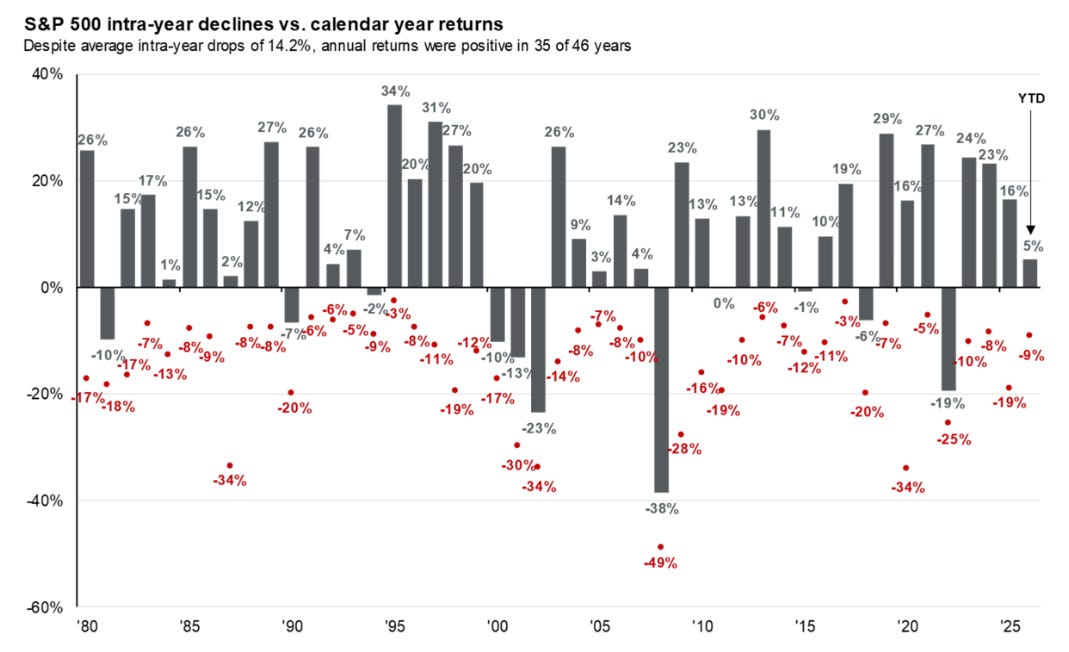
Stomach-churning stock market sell-offs are normal🎢
Investors should always be mentally prepared for some big sell-offs in the stock market. It’s part of the deal when you invest in an asset class that is sensitive to the constant flow of good and bad news. Since 1950, the S&P 500 has seen an average annual max drawdown (i.e., the biggest intra-year sell-off) of 14%.
How the stock market performed around recessions 📉📈
Every recession in history was different. And the range of stock performance around them varied greatly. There are two things worth noting. First, recessions have always been accompanied by a significant drawdown in stock prices. Second, the stock market bottomed and inflected upward long before recessions ended.

In the stock market, time pays ⏳
Since 1928, the S&P 500 has generated a positive total return more than 89% of the time over all five-year periods. Those are pretty good odds. When you extend the timeframe to 20 years, you’ll see that there’s never been a period where the S&P 500 didn’t generate a positive return.

What a strong dollar means for stocks 👑
While a strong dollar may be great news for Americans vacationing abroad and U.S. businesses importing goods from overseas, it’s a headwind for multinational U.S.-based corporations doing business in non-U.S. markets.

Stanley Druckenmiller’s No. 1 piece of advice for novice investors 🧐
…you don’t want to buy them when earnings are great, because what are they doing when their earnings are great? They go out and expand capacity. Three or four years later, there’s overcapacity and they’re losing money. What about when they’re losing money? Well, then they’ve stopped building capacity. So three or four years later, capacity will have shrunk and their profit margins will be way up. So, you always have to sort of imagine the world the way it’s going to be in 18 to 24 months as opposed to now. If you buy it now, you’re buying into every single fad every single moment. Whereas if you envision the future, you’re trying to imagine how that might be reflected differently in security prices.
Peter Lynch made a remarkably prescient market observation in 1994 🎯
Some event will come out of left field, and the market will go down, or the market will go up. Volatility will occur. Markets will continue to have these ups and downs. … Basic corporate profits have grown about 8% a year historically. So, corporate profits double about every nine years. The stock market ought to double about every nine years… The next 500 points, the next 600 points — I don’t know which way they’ll go… They’ll double again in eight or nine years after that. Because profits go up 8% a year, and stocks will follow. That’s all there is to it.
Warren Buffett’s ‘fourth law of motion’ 📉
Long ago, Sir Isaac Newton gave us three laws of motion, which were the work of genius. But Sir Isaac’s talents didn’t extend to investing: He lost a bundle in the South Sea Bubble, explaining later, “I can calculate the movement of the stars, but not the madness of men.” If he had not been traumatized by this loss, Sir Isaac might well have gone on to discover the Fourth Law of Motion: For investors as a whole, returns decrease as motion increases.
Most pros can’t beat the market 🥊
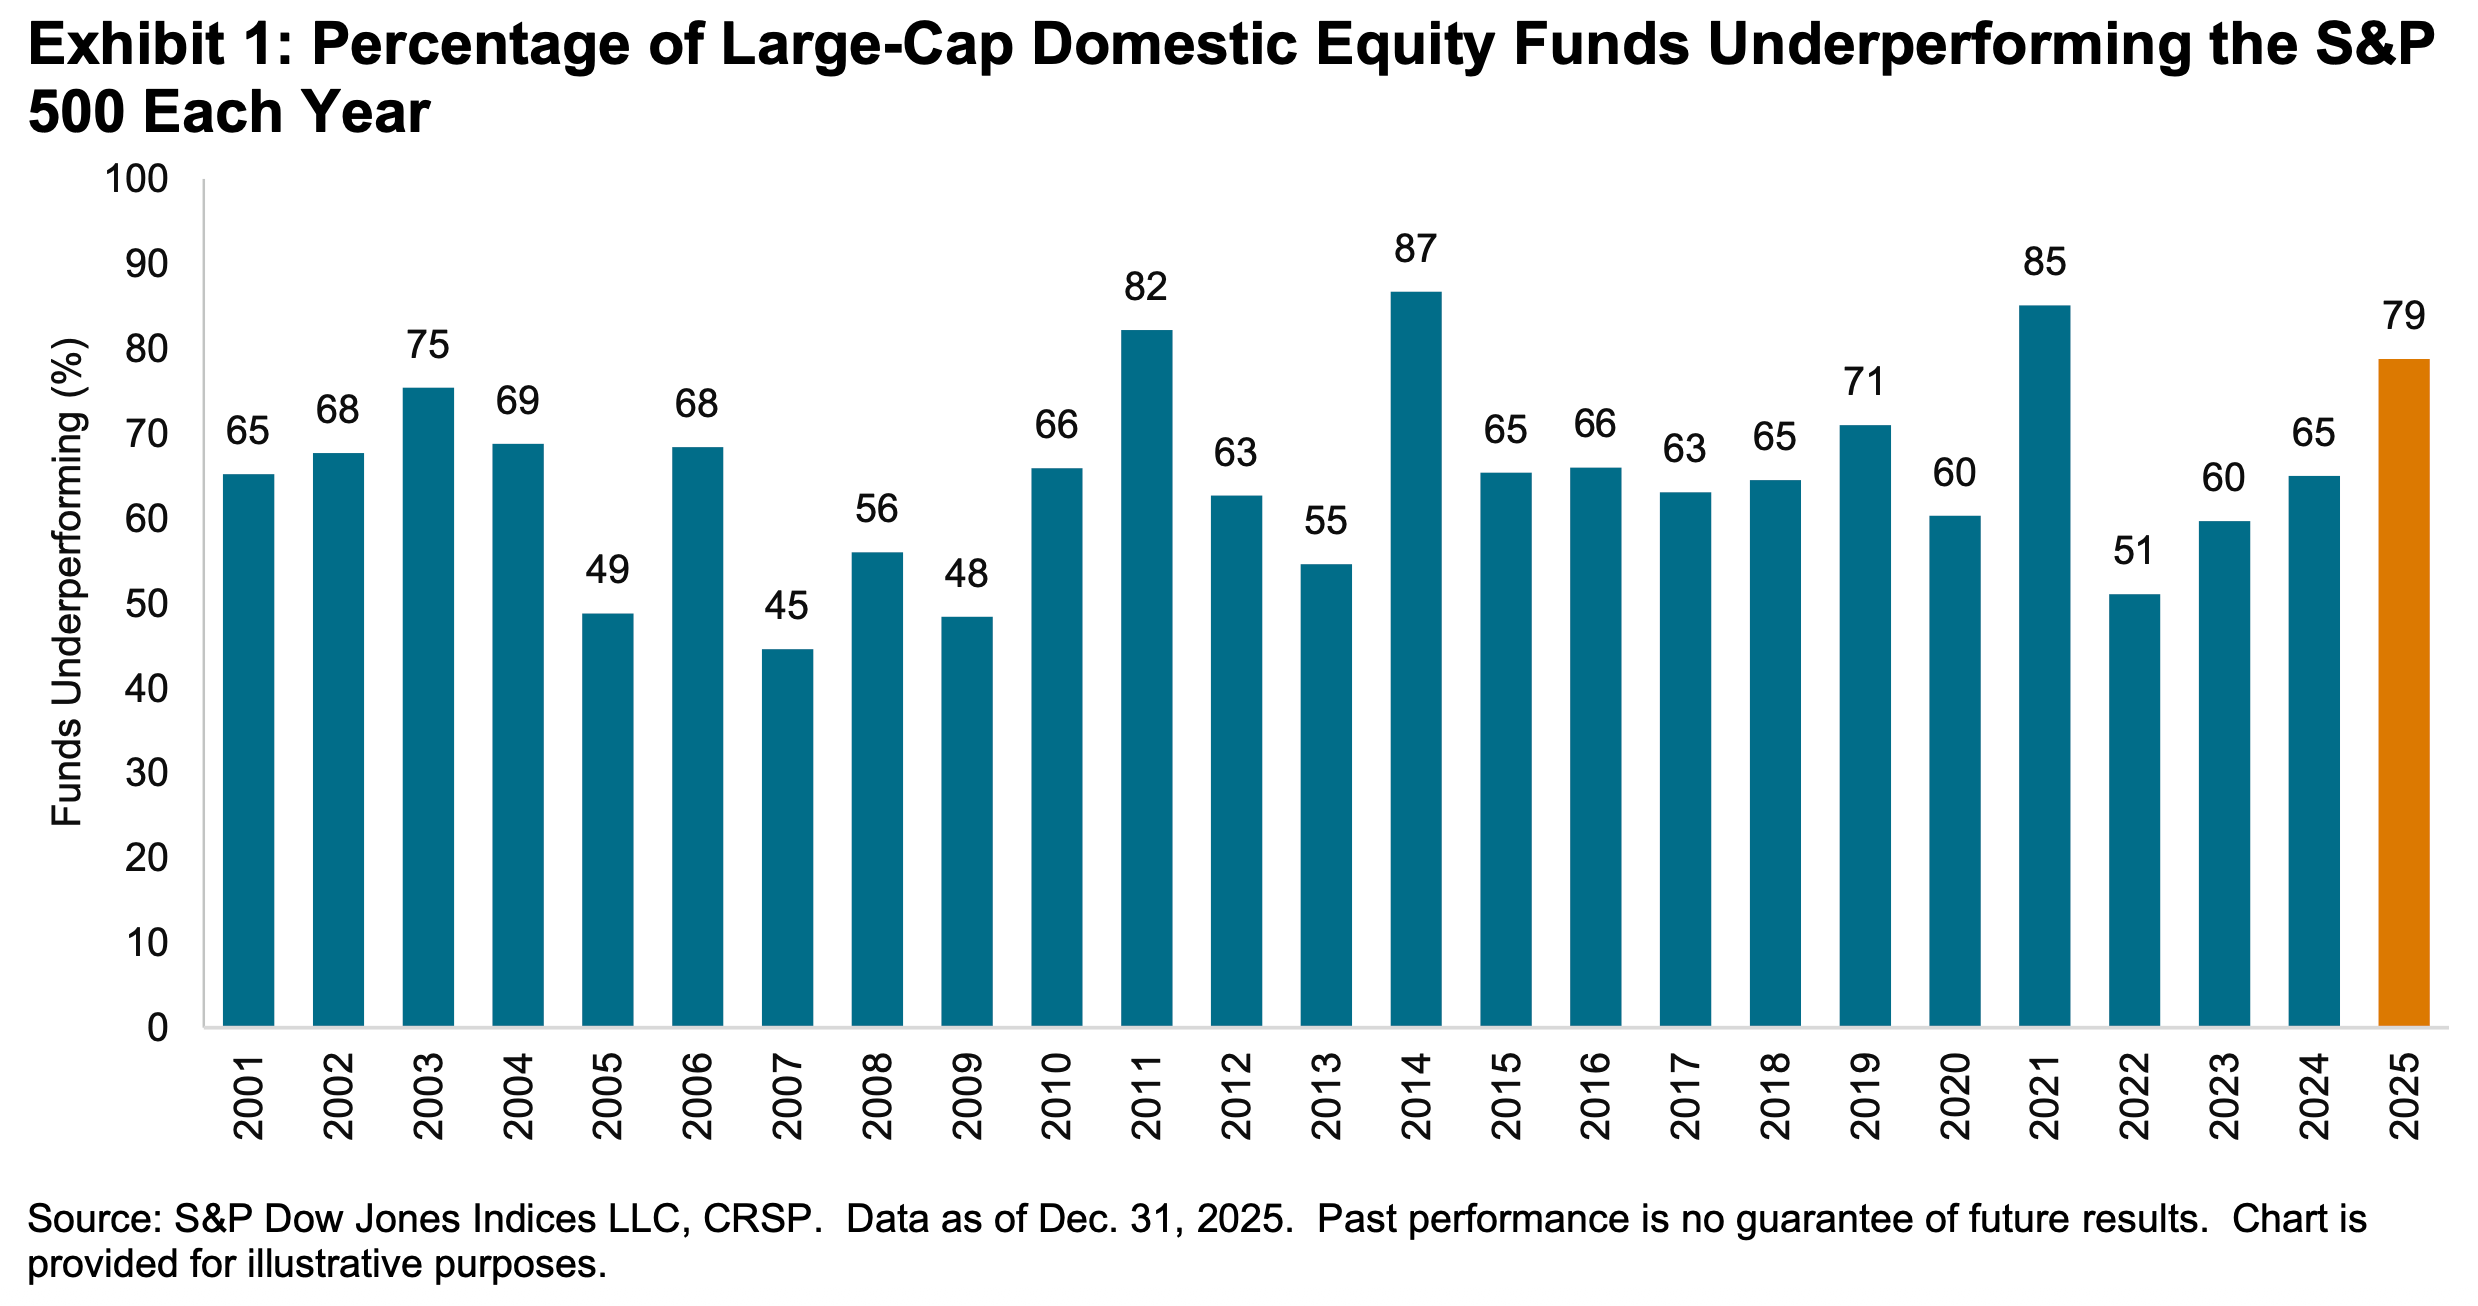
According to S&P Dow Jones Indices (SPDJI), 79% of U.S. large-cap equity fund managers underperformed the S&P 500 in 2025. As you stretch the time horizon, the numbers get even more dismal. Over three years, 67% underperformed. Over 5 years, 89% underperformed. And over 20 years, 93% underperformed. This 2025 performance was the 16th consecutive year in which the majority of fund managers in this category have lagged the index.
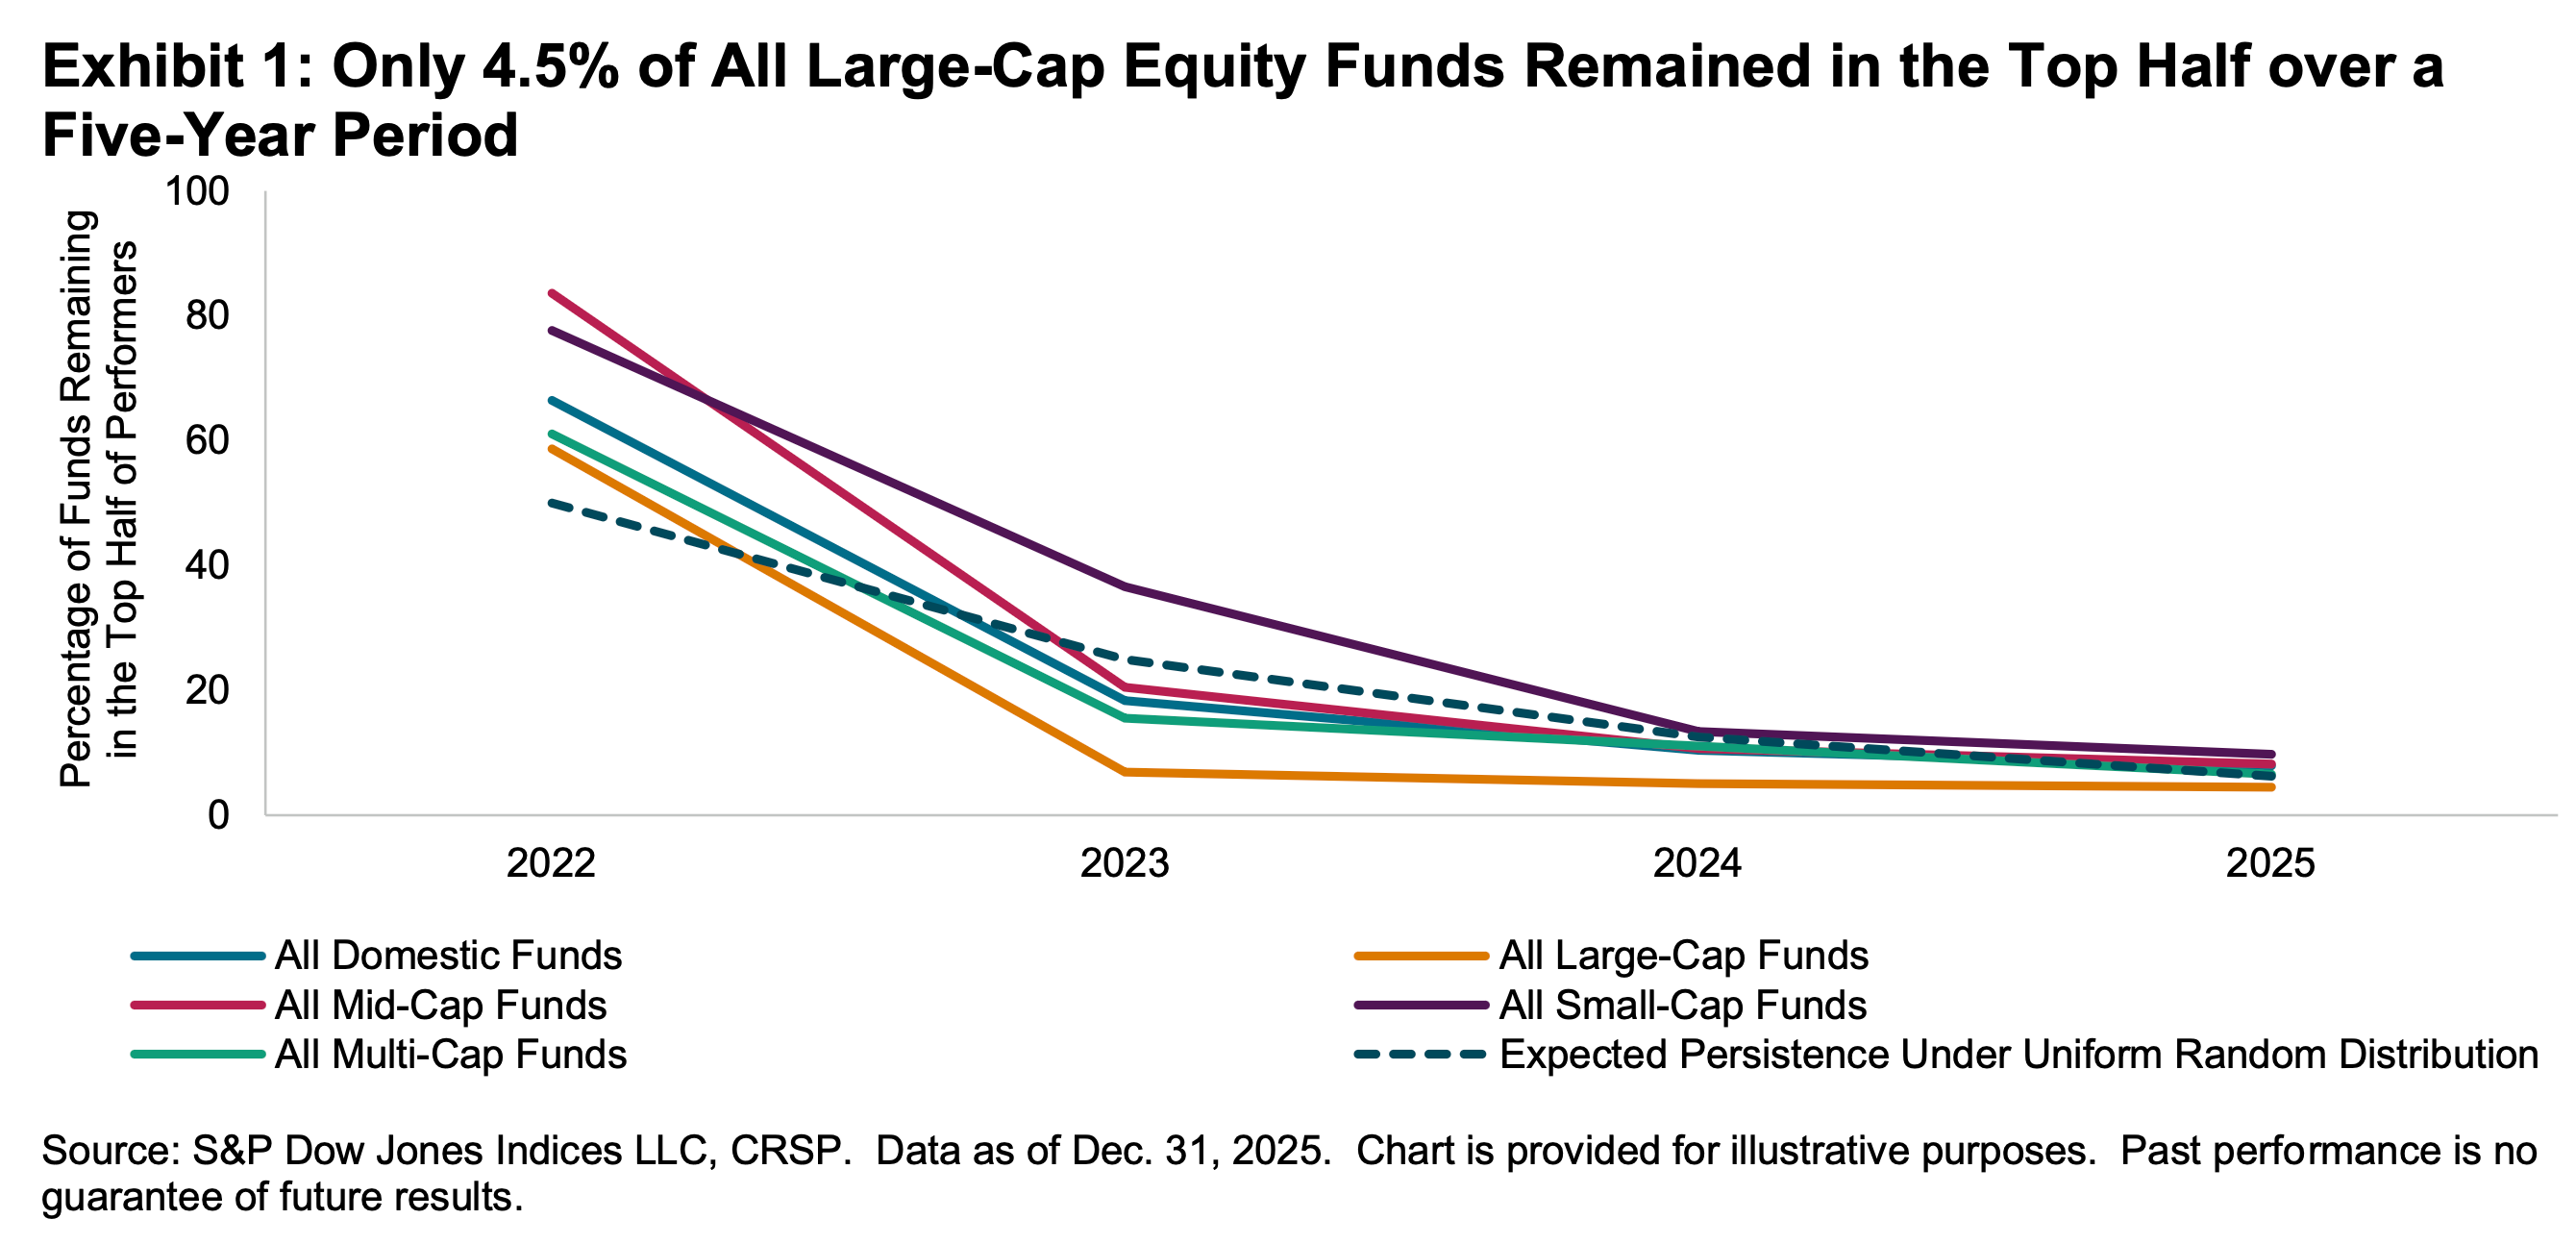
Proof that ‘past performance is no guarantee of future results’ 📊
Even if you are a fund manager who generated industry-leading returns in one year, history says it’s an almost insurmountable task to stay on top consistently in subsequent years. According to S&P Dow Jones Indices, of the 334 large-cap equity funds in the top half of performance in 2021, 58.7% remained at the top half in 2022. However, just 6.9% remained on top through 2023. Only 4.5% stayed on top in the five consecutive years through 2025.
It’s much more dismal when you raise the bar. Of the 164 large-cap equity funds in the top quartile in 2021, just 20.1% remained in that category in 2022. That percentage fell to literally 0.0% in 2023.
The odds are stacked against stock pickers 🎲
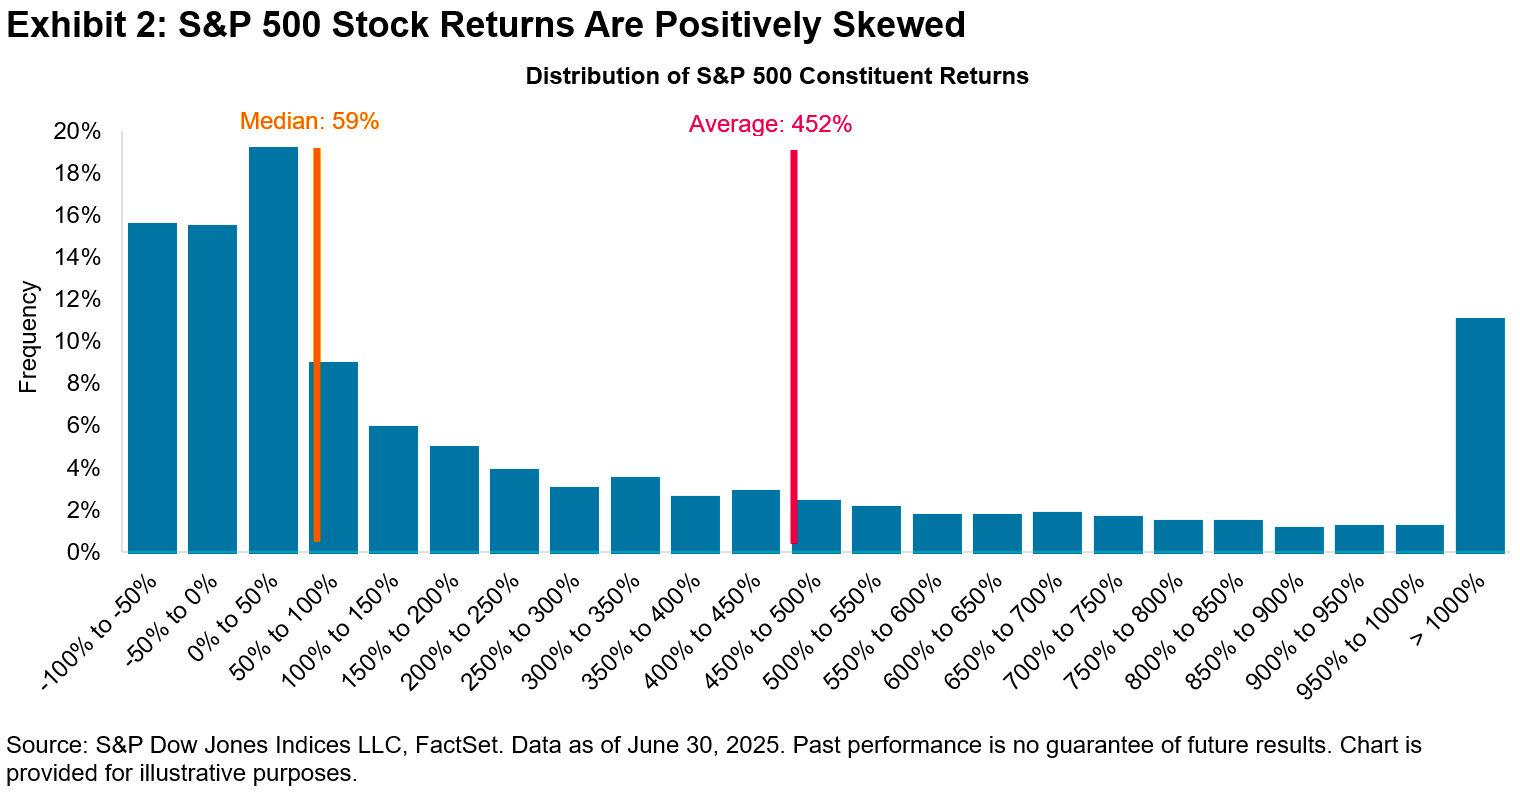
Picking stocks in an attempt to beat market averages is an incredibly challenging and sometimes money-losing effort. Most professional stock pickers aren’t able to do this consistently. One of the reasons for this is that most stocks don’t deliver above-average returns. According to S&P Dow Jones Indices, only 19% of the stocks in the S&P 500 outperformed the average stock’s return from 2001 to 2025. Over this period, the average return on an S&P 500 stock was 452%, while the median stock rose by just 59%.