Bizarre moment at Berkshire's annual meeting spotlights cyber risk🤖
Plus a charted review of the macro crosscurrents 🔀


Berkshire Hathaway’s annual shareholder meeting was destined to be interesting as the first without its now-retired CEO, Warren Buffett, MC’ing the event.
But Buffett, who remains chairman of Berkshire’s board, made a few cameos. One of them was pretty eerie.
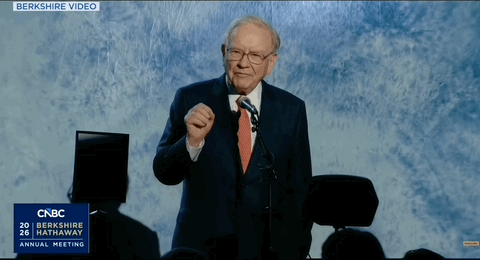
Kicking off the Q&A on Saturday morning, the spotlight went to a video where “Warren from Omaha” asked the first question:
Hi. My name is Warren from Omaha. I’ve recently undergone, let’s call it, a significant change in role. And I have, well, let’s just say, a not insignificant portion of my net worth tied up in Berkshire stock. Now, Greg, I’ve been watching this company for a while, a long time, a very long time. And I’ve been telling people that I have no intentions of selling a single share, not one. So my question is a simple one. I’m 95 years old. I’ve got nothing but time and Cherry Coke. And I want to know, just so I have something to tell my fellow shareholders: Why should they hold their Berkshire shares for the long term?
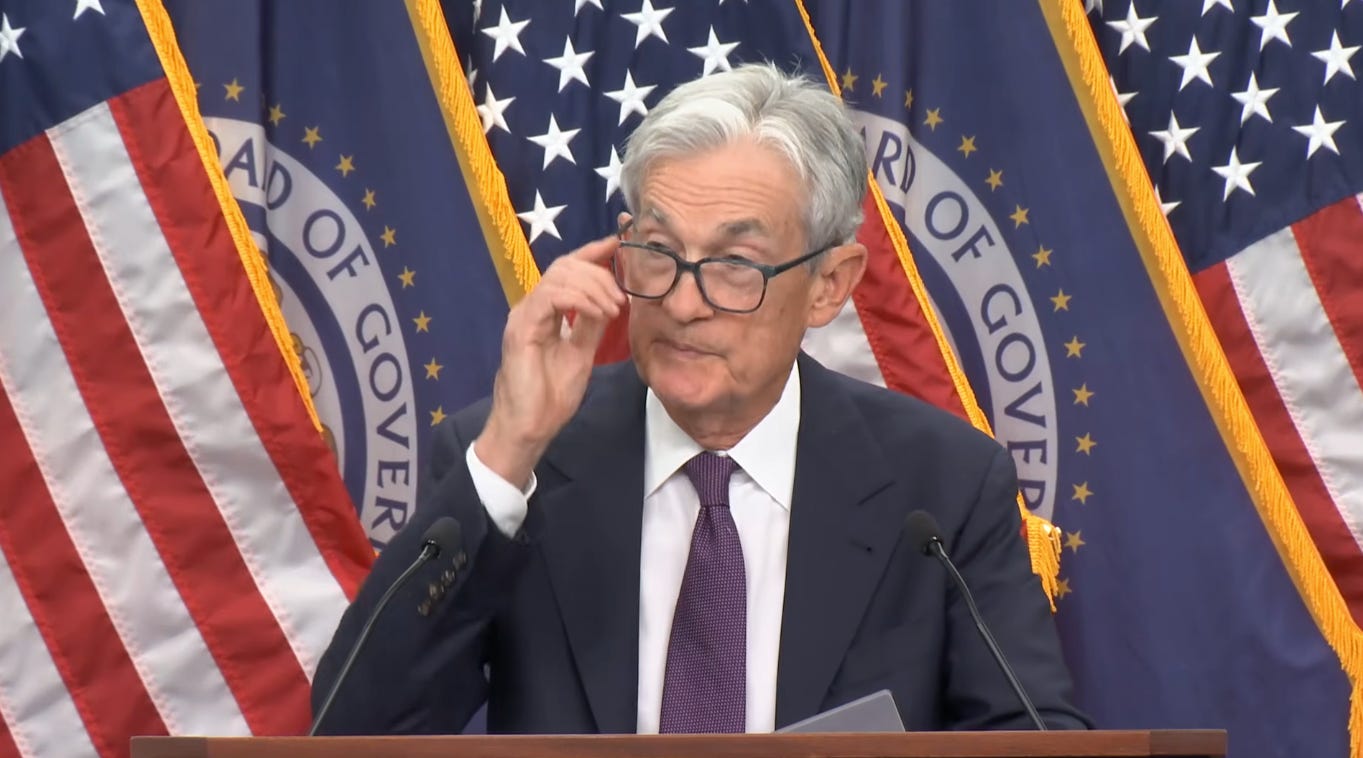
The fun moment quickly turned serious when CEO Greg Abel informed the audience that it wasn’t Warren Buffett.
“As you've all picked up, that was a deepfake,” Abel said. “But here's the interesting thing. That was done with zero input from Warren. Voice, photo... we were able to obtain that with information that's out there, and replicate those actions and that voice.”
It’s notable that they leaned into the deepfake because it’s a problem that Buffett has been wrestling with for years. Just a few months ago, Berkshire put out a rare press release about deepfakes titled: “It’s Not Me.”
“Scamming has always been part of the American scene,” Buffett said of deepfakes at the 2024 meeting. “If I was interested in investing in scamming — it’s gonna be the growth industry of all time.”

While Buffett has had to warn specifically of deepfakes of his likeness being used by scammers, Berkshire and its management team have long flagged cyber broadly as a major risk. In fact, it’s the second item identified in “Risk Factors” section of the company’s annual report:
Cybersecurity risks could result in economic losses to our businesses and reputational damage.
We rely on technology in virtually all aspects of our business. Like those of many large businesses, certain of our information systems have been subject to cyber threats, including computer viruses, malicious codes, unauthorized access, phishing efforts, denial-of-service attacks and other cyber-attacks. We expect continued exposure to such attacks in the future and attacks have become more sophisticated and frequent. A significant disruption or failure of our technology systems could result in service interruptions, safety failures, security events, regulatory compliance failures, an inability to protect information and assets against unauthorized users and other operational difficulties. Cyber-attacks perpetrated against our systems could result in loss of assets and critical information and expose us to remediation costs and reputation damage.
So of course, it’s not surprising that it was the very first topic they addressed during the meeting’s Q&A session.

“That’s what we’re dealing with when we think of Berkshire and how we have to protect it every day,” Abel said on Saturday. “It can go to deepfakes, and they’re using it to try to penetrate our business. It can be cyber attacks. It’s a great reminder for our team, because that is a significant risk across Berkshire that we’re managing every day. Cyber risk. And it’s one that we take extremely seriously.”
Are markets complacent about cyber risks?
While it’s unsettling to think about the risks posed by cyber attacks, it’s encouraging to hear executives, not just at Berkshire, confirm that it’s top of mind.
The fact that we haven’t experienced a market-destabilizing event tied to cyber perhaps speaks to how effective companies and regulators have been at keeping bad actors at bay.
Hopefully it stays that way.
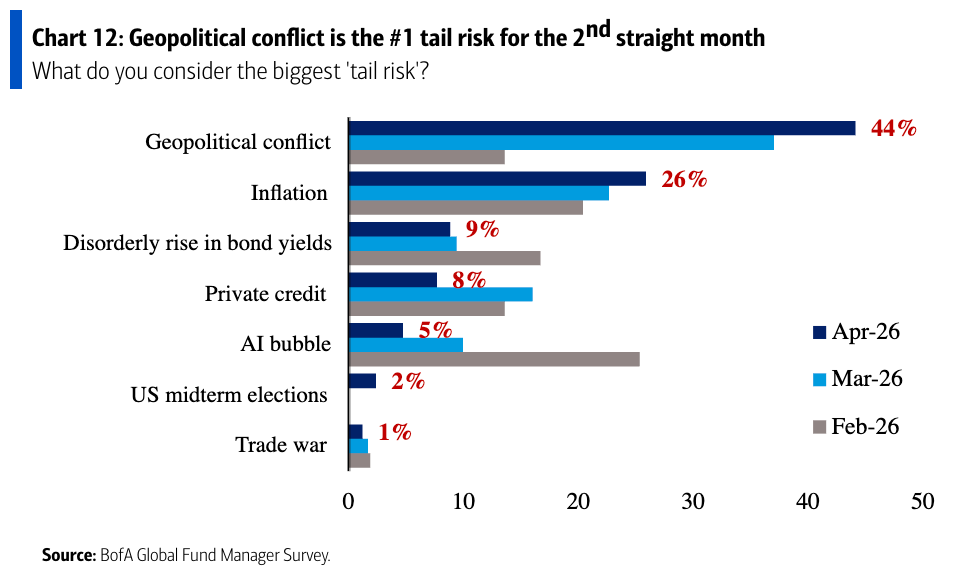
Because, for now, market participants are arguably complacent about cyber risks. It rarely comes up in surveys about risk. For example, in BofA’s latest Global Fund Manager Survey, cyber didn’t crack the list of top “tail risks” identified by market pros.
This might be a problem. Because according to TKer Truth No. 8: “The most destabilizing risks are the ones people aren’t talking about.“
Investors and traders not talking about a risk suggests that the risk isn’t priced into markets. That means when the risk materializes, volatility is more likely to spike with prices potentially overshooting to the downside.
Especially with the rise of AI and increasingly scary stories about related risks, it’s never been more important to be vigilant.
For now, we put faith in our business leaders and policymakers and hope that they continue to be in front of this.
On Saturday, CNBC’s Becky Quick asked Buffett about the morning’s deepfake and the risk AI poses to the world.
“It’s scary,” Buffett said. “It’s particularly scary when you have nine countries or so with nuclear weapons and people working on it. We haven’t dealt with it. We don’t know what’s going to happen.“
Investing is risky. Bad things often happen. And sometimes, very bad things happen.
-
Related from TKer:
Review of the macro crosscurrents 🔀
📈The stock market rallied to all-time highs, with the S&P 500 setting an intraday high of 7,272.52 and a closing high of 7,230.12 on Friday. The index is now up 5.6% year-to-date. For market insights, check out the Stock Market tab at TKer. »
There were several notable data points and macroeconomic developments since our last review:
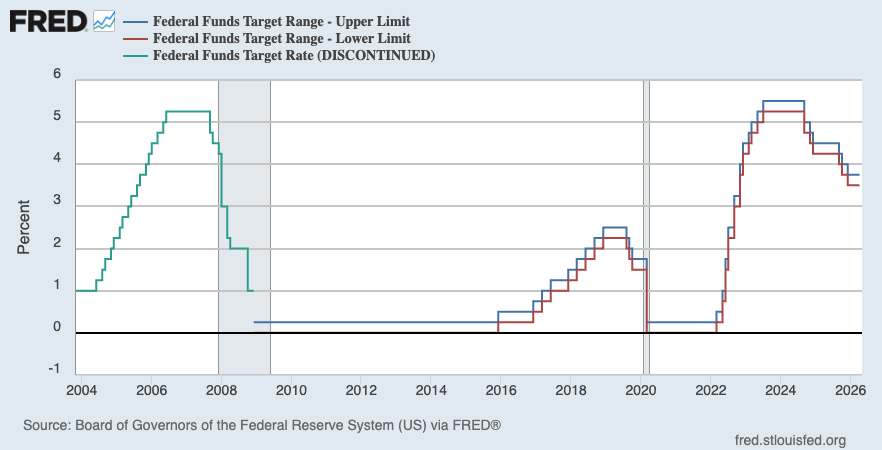
🏛️ Fed holds rates. On Wednesday, the Federal Reserve kept its benchmark interest rate target range at 3.5% to 3.75%.
From the Fed’s policy statement: “Recent indicators suggest that economic activity has been expanding at a solid pace. Job gains have remained low, on average, and the unemployment rate has been little changed in recent months. Inflation is elevated, in part reflecting the recent increase in global energy prices. The Committee seeks to achieve maximum employment and inflation at the rate of 2 percent over the longer run. Developments in the Middle East are contributing to a high level of uncertainty about the economic outlook. The Committee is attentive to the risks to both sides of its dual mandate.”
From Fed Chair Powell’s press conference: “After my term as Chair ends on May 15, I will continue to serve as a governor for a period of time, to be determined. I plan to keep a low profile as a governor. There is only ever one Chair of the Federal Reserve Board. When Kevin Warsh is confirmed and sworn, he will be that Chair. Once sworn in as Board Chair, his new colleagues will elect him to chair the FOMC as well.”
For more on what Fed policy could mean for markets, read: About Fed rate cuts and stocks ⚖️
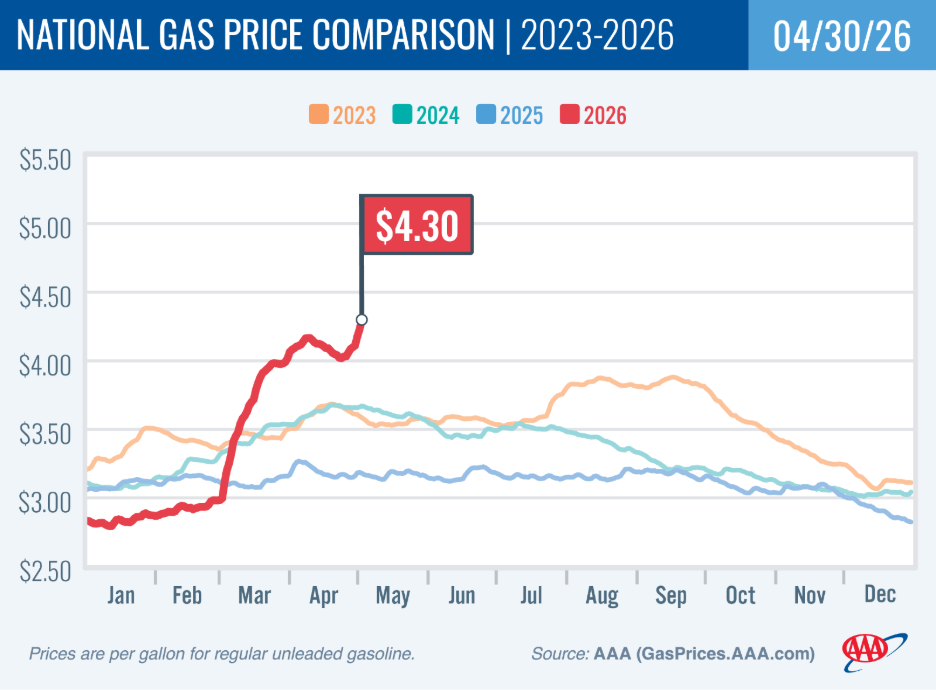
⛽️ Gas and diesel prices remain elevated. From AAA: “After ticking down for nearly two weeks, gas prices are going back up again with the national average seeing a 27-cent hike in one week. The national average is $1.12 higher than it was this time last year, as oil prices surge above $100/barrel with no indication of when the Strait of Hormuz will reopen. Gas prices are the highest they’ve been in four years, since late July 2022.“
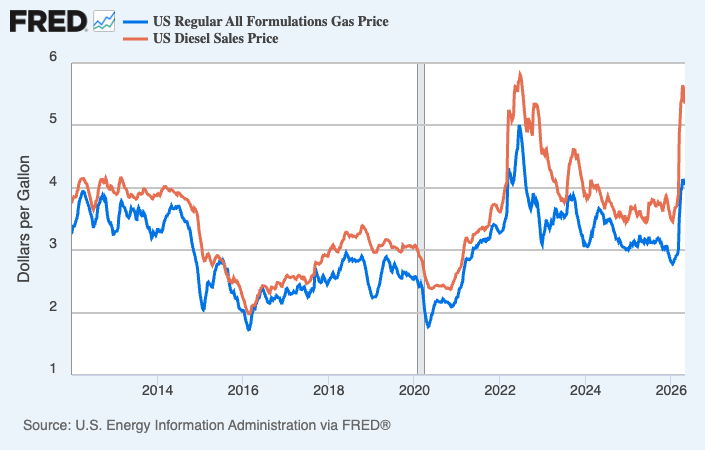
Here’s a longer-term look at the trajectory of gas and diesel prices, as tracked by the EIA.
For more on energy prices, read: Our love-hate relationship with rising oil prices in charts 💔🛢️📊
🎈 Fed’s preferred inflation measure jumped on higher energy prices. The personal consumption expenditures (PCE) price index in March was up 3.5% from a year ago, fueled by higher energy prices. The core PCE price index — the Federal Reserve’s preferred measure of inflation — was up 3.2% during the month, up from February’s 3.0% rate.
On a month-over-month basis, the core PCE price index was up 0.29%.
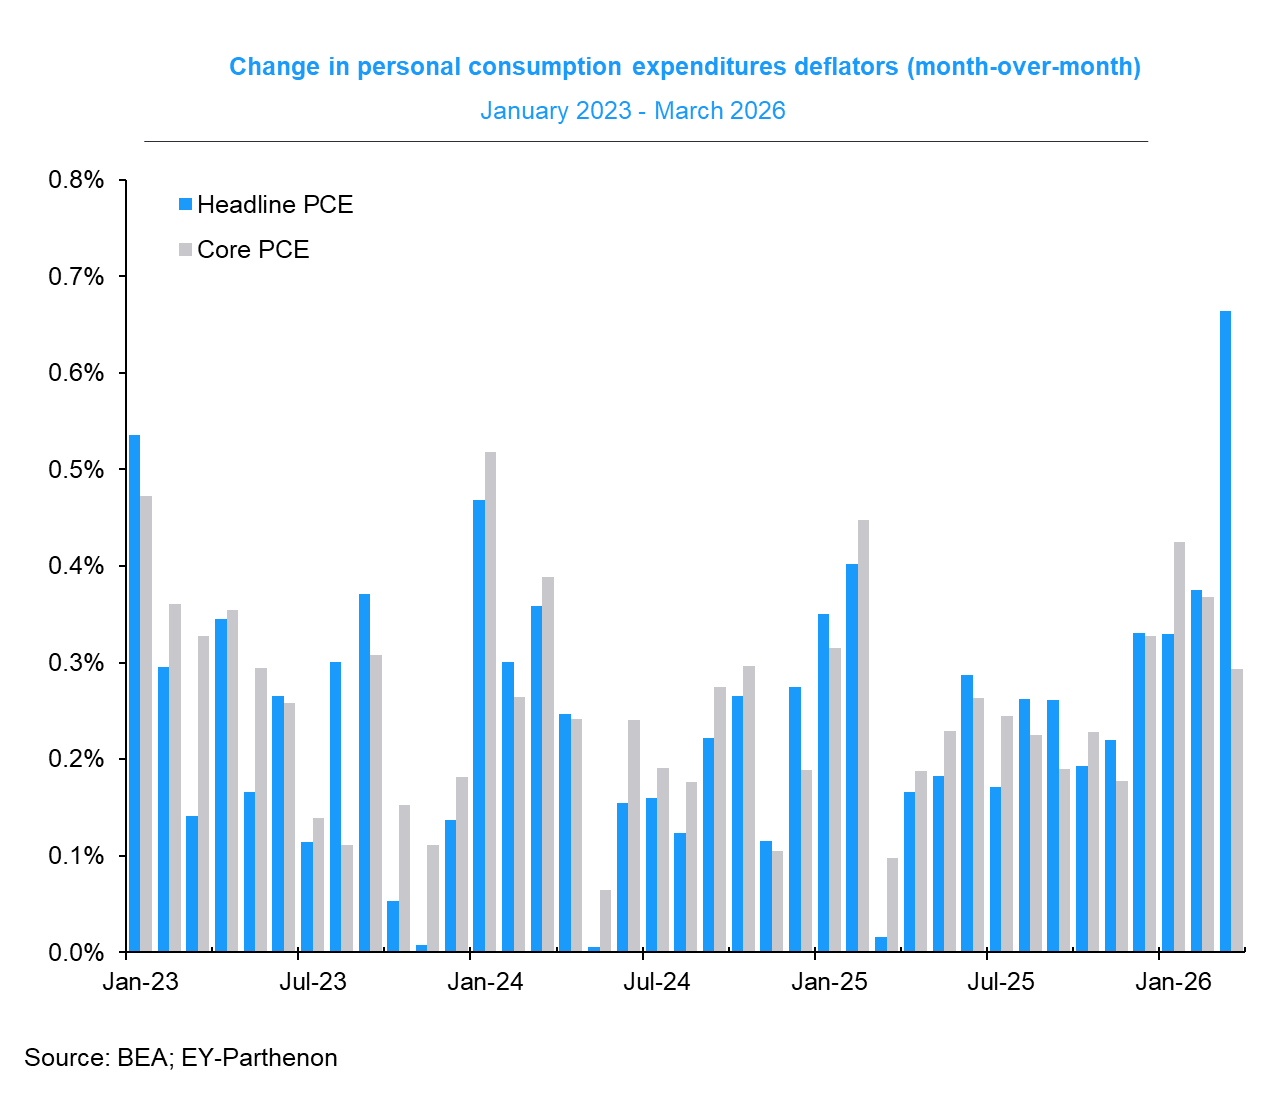
While inflation rates remain above the Federal Reserve’s 2% target, they are down considerably from peak levels just a few years ago.
For more on the Fed’s impact on markets, read: There’s a more important force than the Fed driving the stock market 💪
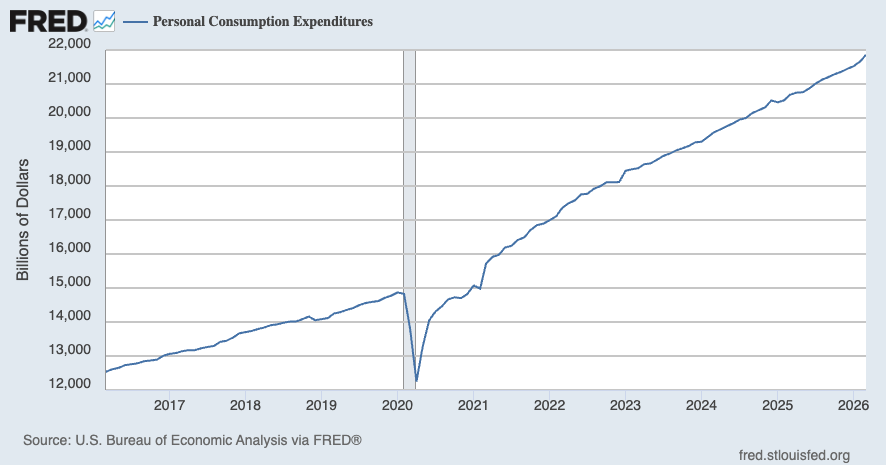
🛍️ Consumer spending ticks higher. According to BEA data, personal consumption expenditures increased 0.9% month-over-month in March to an annual rate of $21.86 trillion, an all-time high.
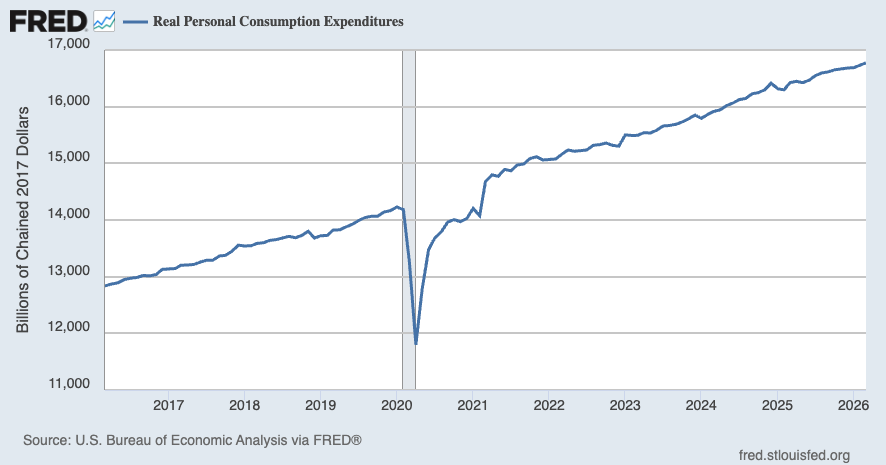
Adjusted for inflation, real personal consumption expenditures increased 0.2% from the prior month to another all-time high.
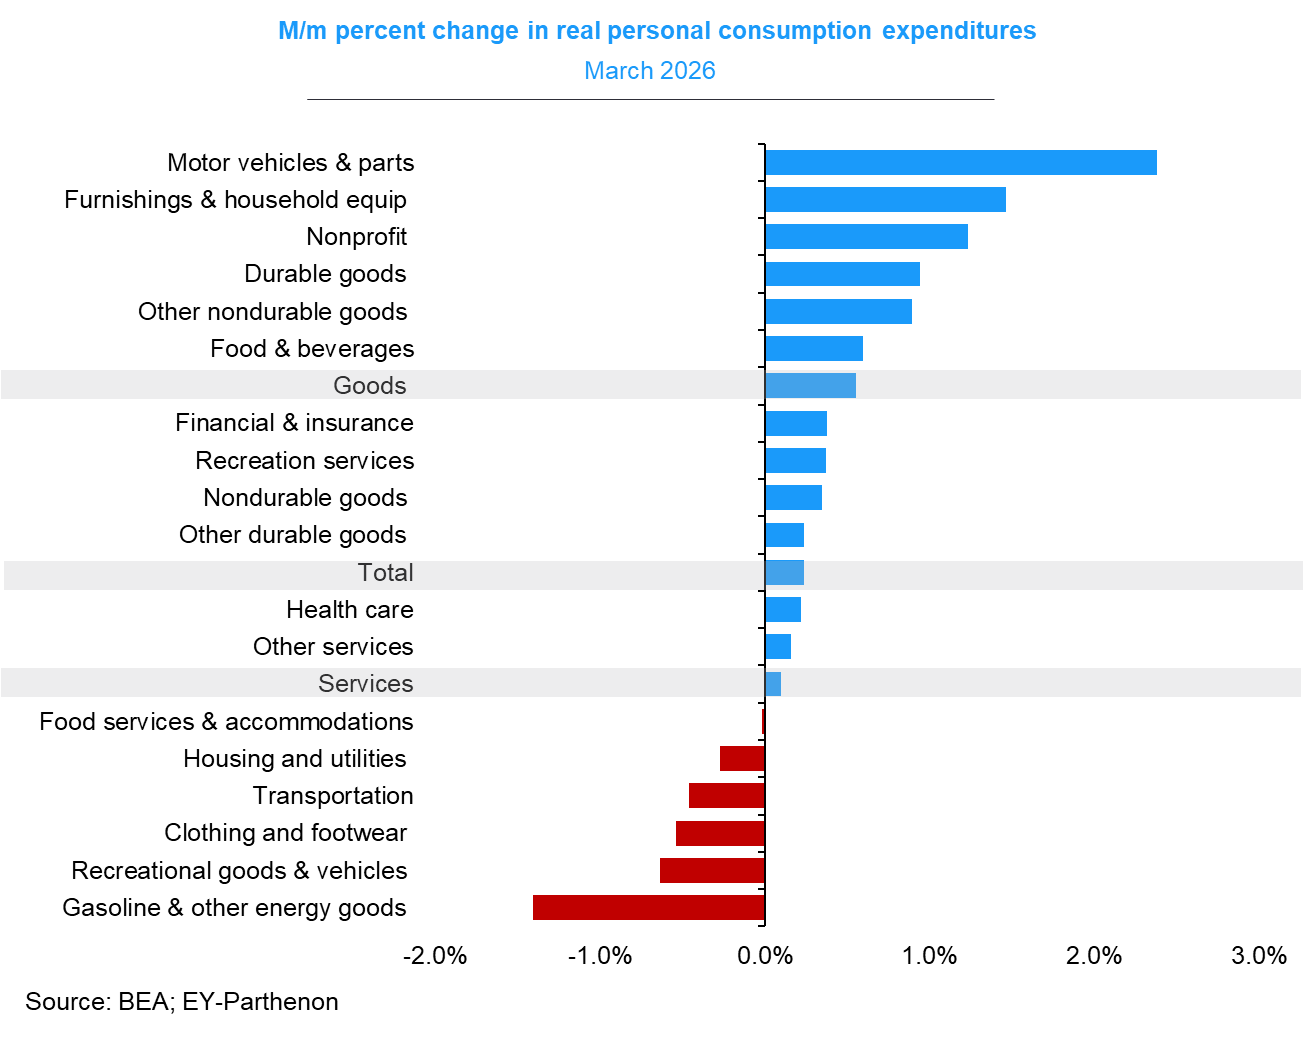
Here’s a breakdown of real spending growth by category.
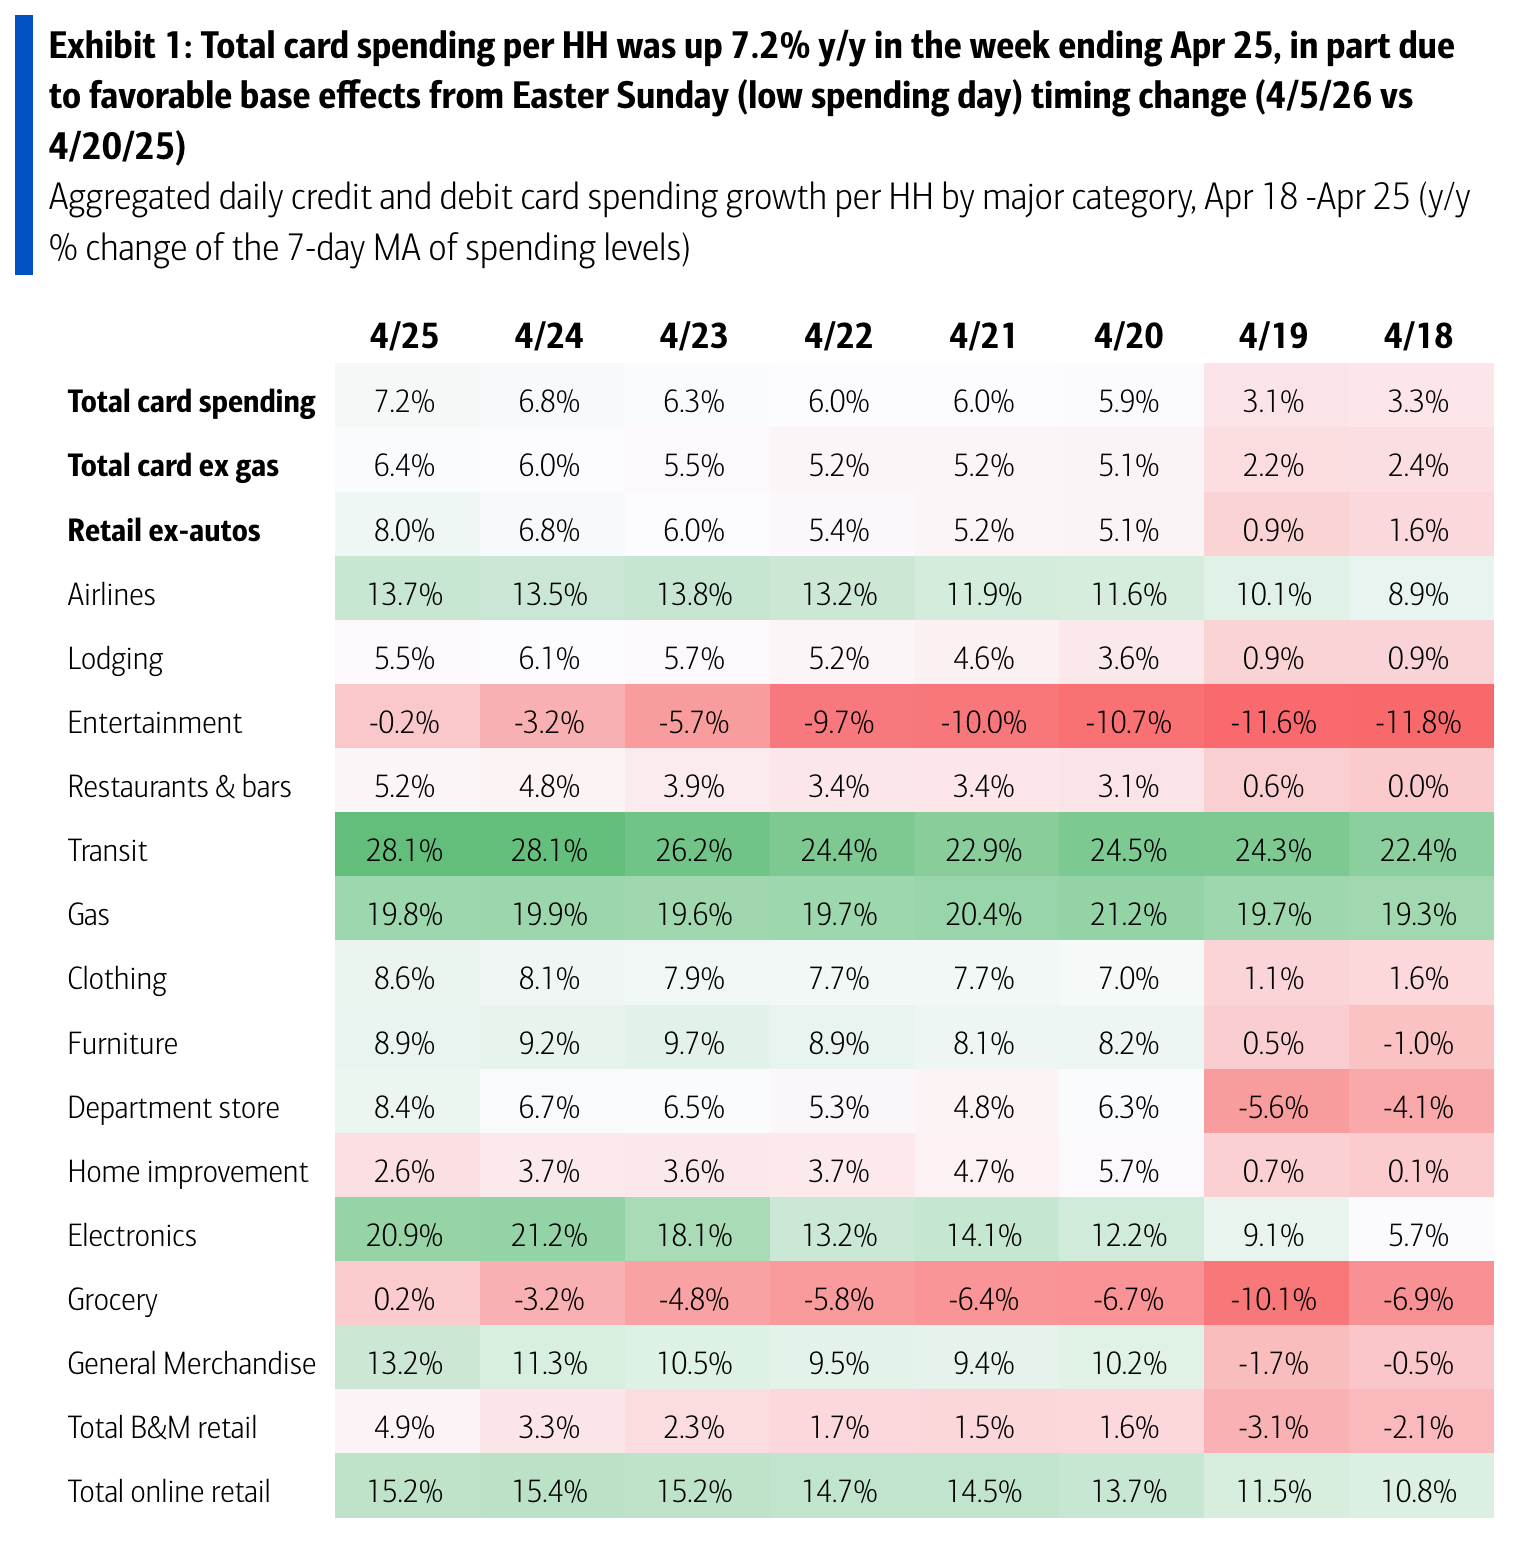
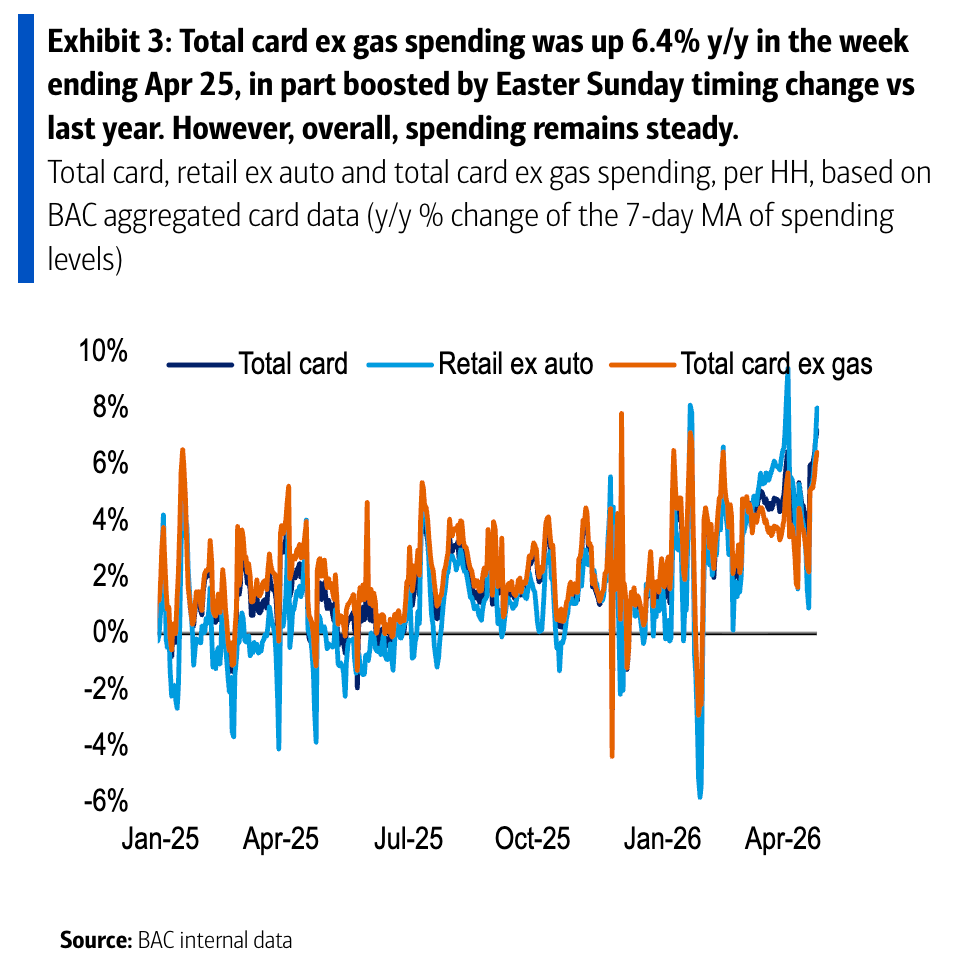
💳 Card spending data is holding up. From BofA: “Total card spending per HH was up 7.2% y/y in the week ending Apr 25, according to BAC aggregated credit & debit card data. Ex gas spending was up 6.4% y/y, in part due to favorable base effects from Easter Sunday (low spending day) timing change. Spending remains healthy. K-shaped spending dynamics persist, with the ‘K’ even wider at the top 5% & top 1% income cohorts.“
Consumer spending data has looked a lot better than consumer sentiment readings. For more on this contradiction, read: We’re taking that vacation whether we like it or not 🛫 and Household finances are both ‘worse’ and ‘good’ 🌦️
🏭 Business investment activity jumps. Orders for nondefense capital goods excluding aircraft — a.k.a. core capex or business investment — increased 3.3% to a record $82.9 billion in March.
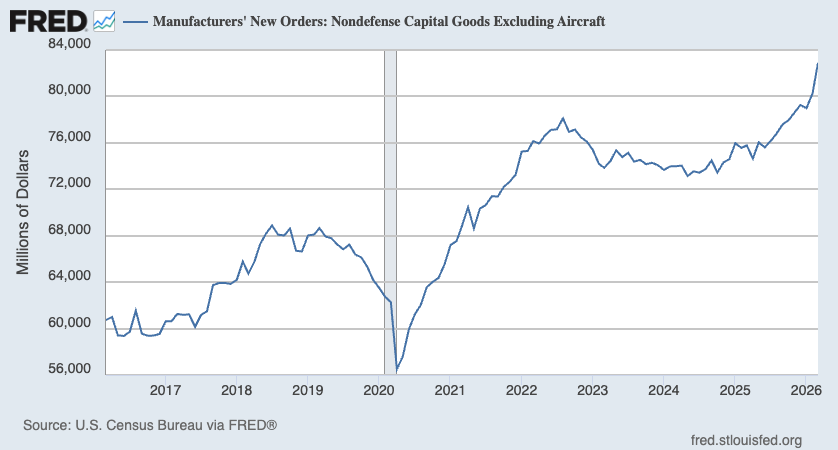
Core capex orders are a leading indicator, meaning they foretell economic activity down the road.
📋 Manufacturing activity surveys signal growth, but also problems. From S&P Global’s April U.S. Manufacturing PMI: “The surge in manufacturing activity in April is not the cause for cheer that at first glance it suggests. A key driving force behind the upturn is the need for companies to get ahead of further feared price rises and supply shortages, providing a short-term boost that could fade in the coming months as headwinds to the economy continue to build.”
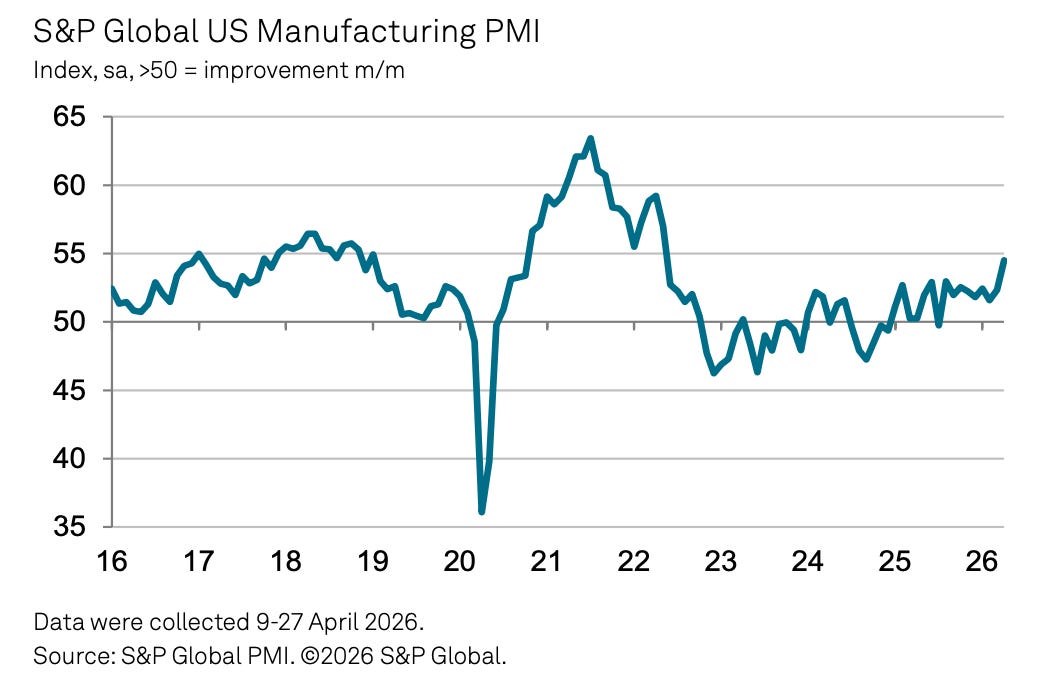
Similarly, the ISM April Manufacturing PMI signaled growth.
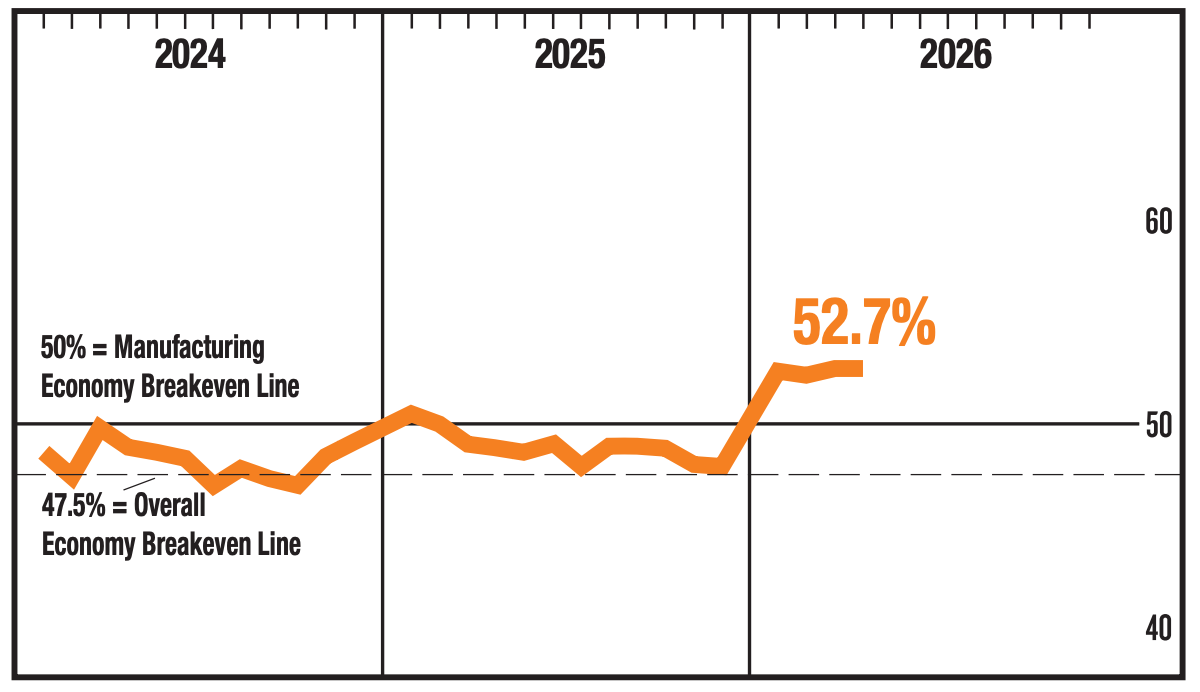
But the ISM report also signaled inflation was heating up.
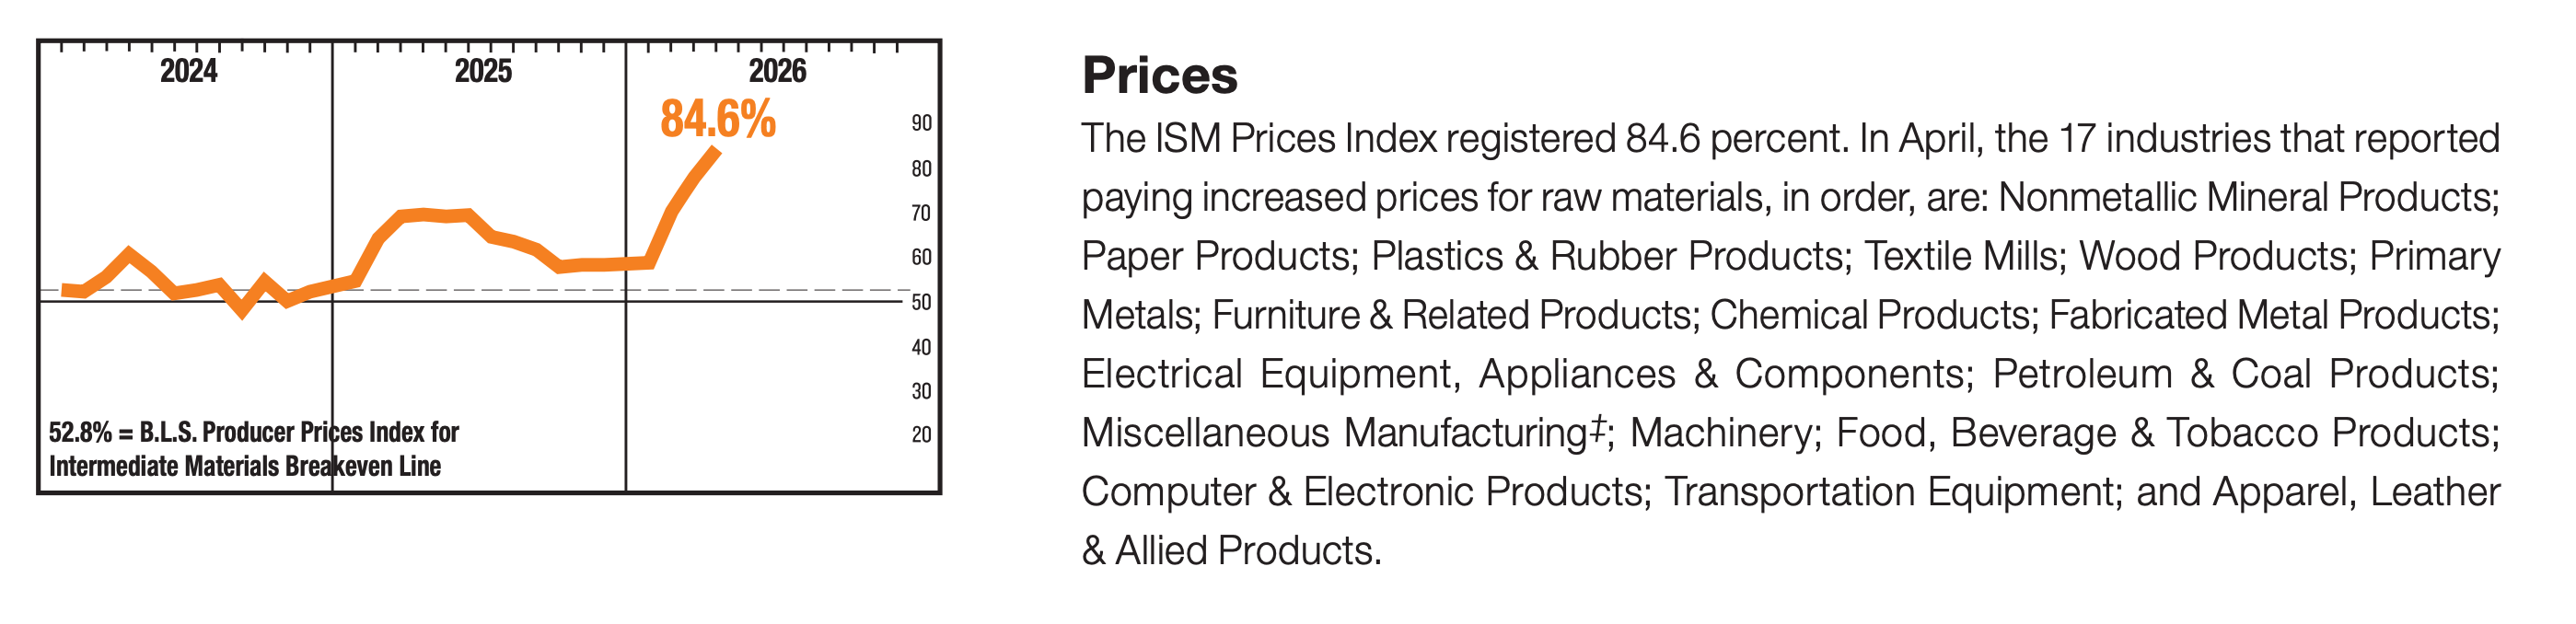
Keep in mind that during times of perceived stress, soft survey data tends to be more exaggerated than actual hard data.
For more on this, read: What businesses do > what businesses say 🙊 and 4 sometimes-conflicting ways I’m thinking about the economy 😬😞😎🙃
👎 Consumer vibes improve slightly, but remain in the dumps. The Conference Board’s Consumer Confidence Index climbed 0.6 points in April. From the report: “Consumer confidence edged up in April but was overall little changed, despite material concern about rising gasoline prices as the war in the Middle East prompted a surge in Brent crude oil prices. Consumer appraisals of current and expected business conditions declined moderately compared to last month. This was offset by modest improvements in consumers’ perceptions of the labor market, both current and expected, as well as income expectations, which were slightly more optimistic in April.”
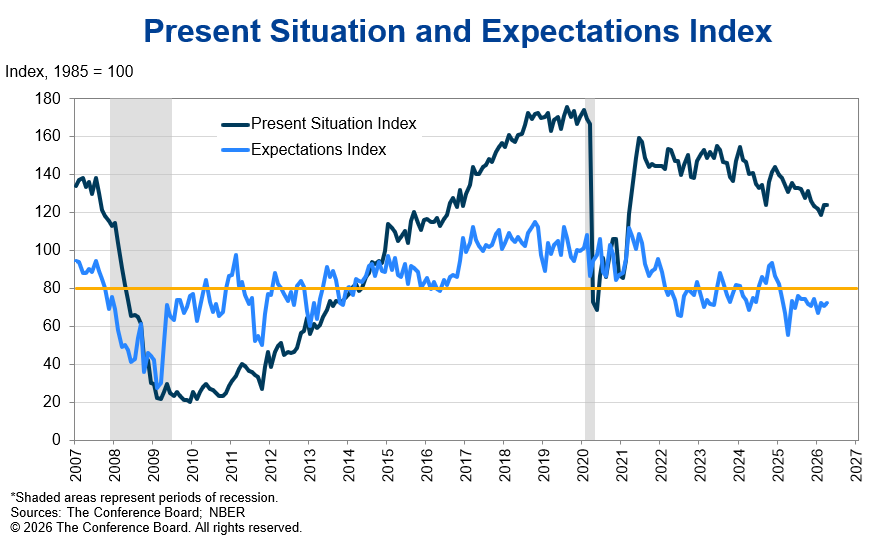
More from the report: “Among demographic groups, confidence continued to trend downward on a six-month moving average basis for consumers aged 35 and up while younger consumers were a tad more confident in April. Respondents under 35 remained the most optimistic and those 55 and over the least. On a six-month moving average basis, confidence improved among Millennials and Gen Z but declined among older generations. By income, confidence on a six-month moving average basis varied, but most income groups expressed less optimism. By political affiliation, Republicans remained the most optimistic, while confidence fell for Independents and improved slightly for Democrats.”
For more on consumer sentiment, read: What consumers do > what consumers say 🙊 and The economy may not be working for everyone right now, but it’s at least working for stock market investors 🎭
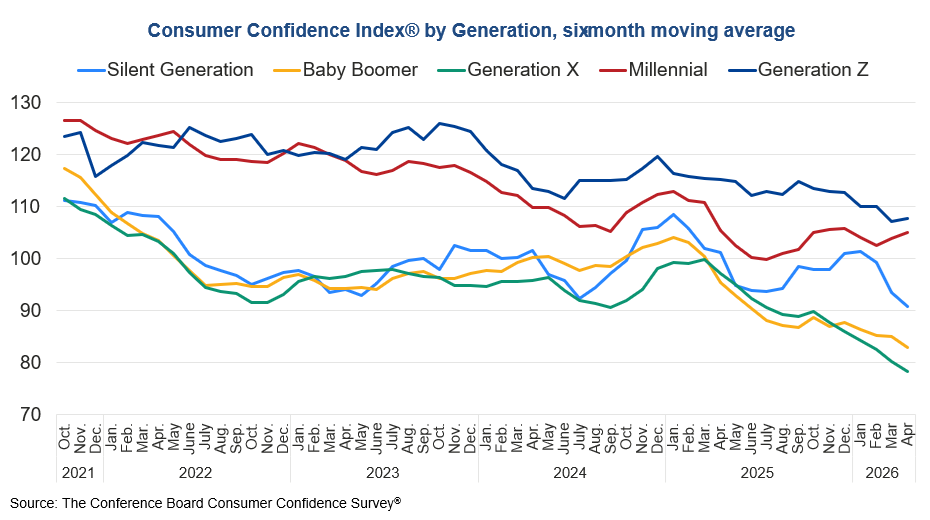
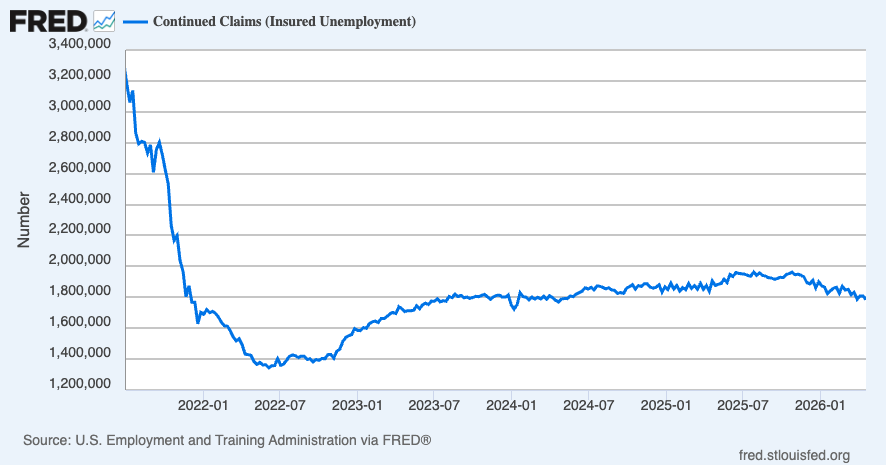
💼 New unemployment insurance claims, total ongoing claims remain low. Initial claims for unemployment benefits fell to 189,000 during the week ending Apr. 25, down from 215,000 the week prior. This metric remains at levels historically associated with economic growth.
Insured unemployment, which captures those who continue to claim unemployment benefits, ticked up to 1.785million during the week ending Apr. 18.
For more on the labor market, read: The next couple of years for the job market could be tough 🫤
👎 Consumers don’t feel good about the labor market. From The Conference Board: “On net, consumers’ views of the labor market improved moderately in April. 27.3% of consumers said jobs were ‘plentiful,’ virtually unchanged from 27.4% in March. 19.8% of consumers said jobs were ‘hard to get,’ down from 21.3%.”
Many economists monitor the spread between these two percentages (a.k.a., the labor market differential). While the metric improved recently, the direction of the spread reflects a cooling labor market.
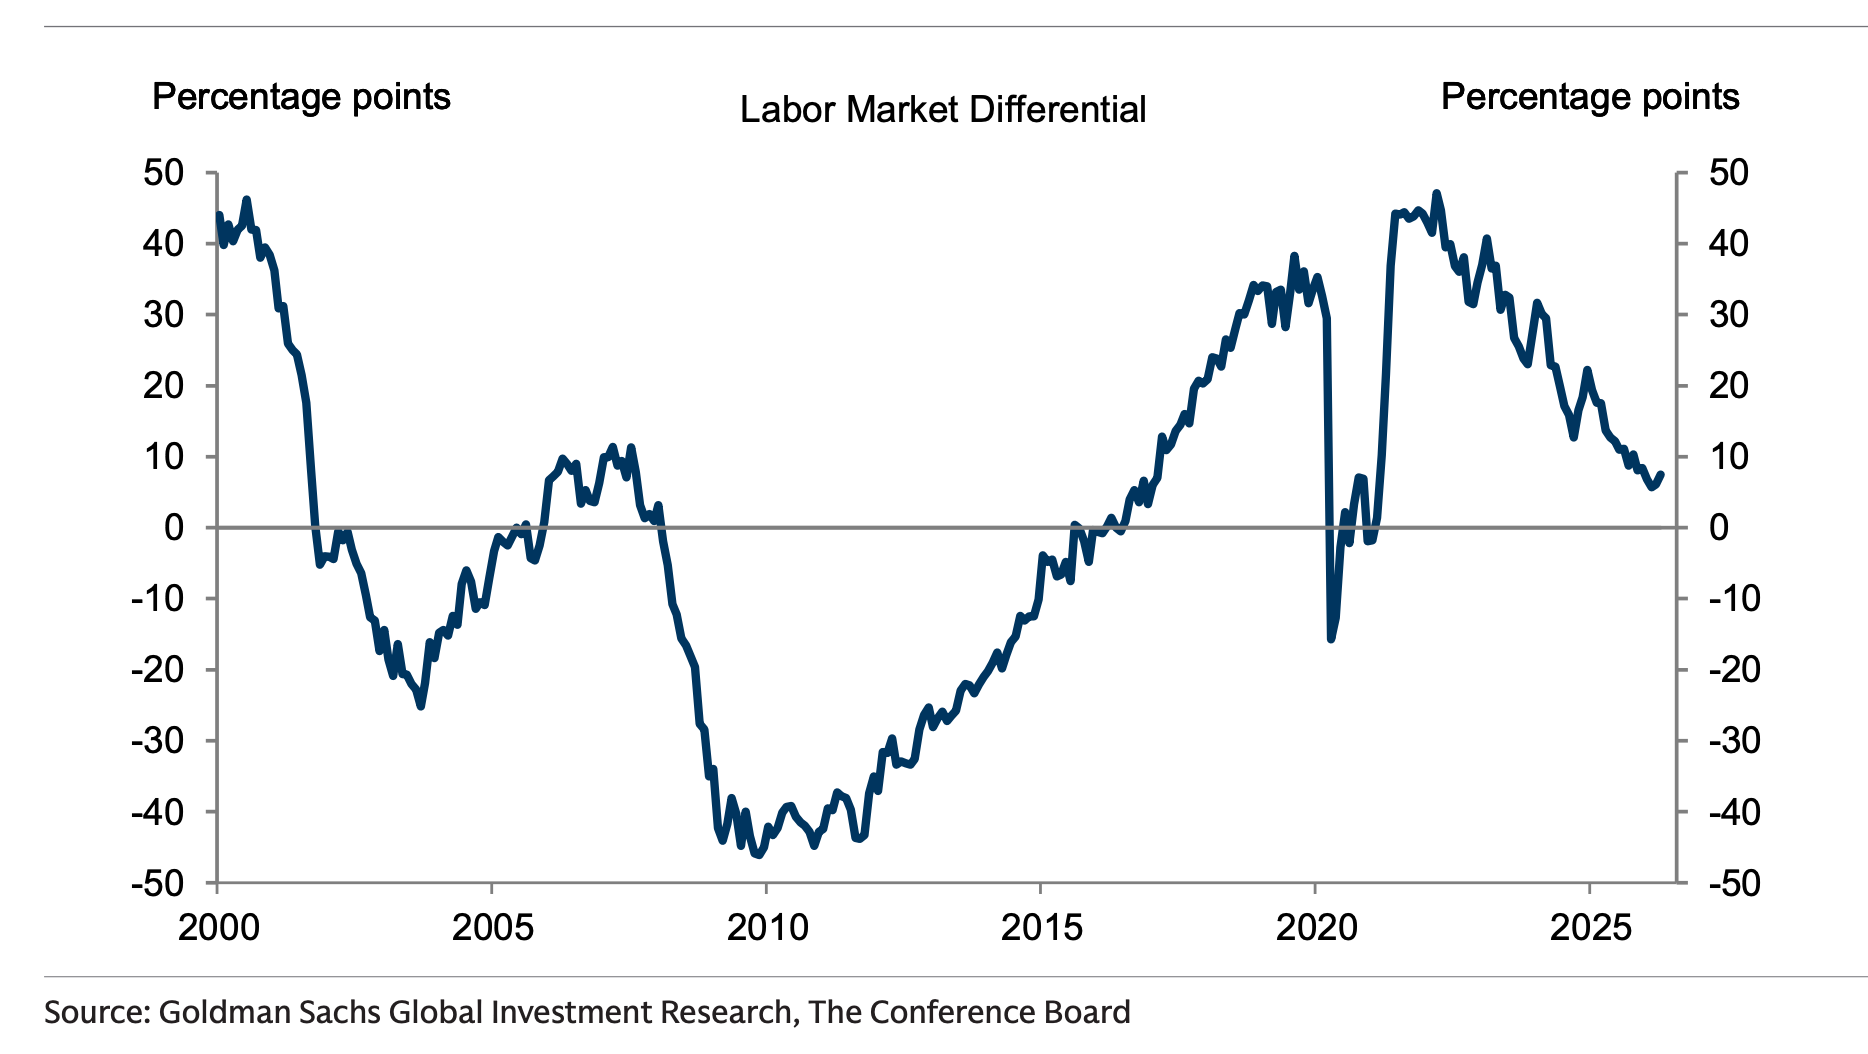
More from The Conference Board: “However, consumers were less negative about the labor market outlook in April. 16.1% of consumers expected more jobs to be available, up from 15.4% in March. 26.9% anticipated fewer jobs, down from 27.8%.“
For more on the labor market, read: The labor market is cooling 💼
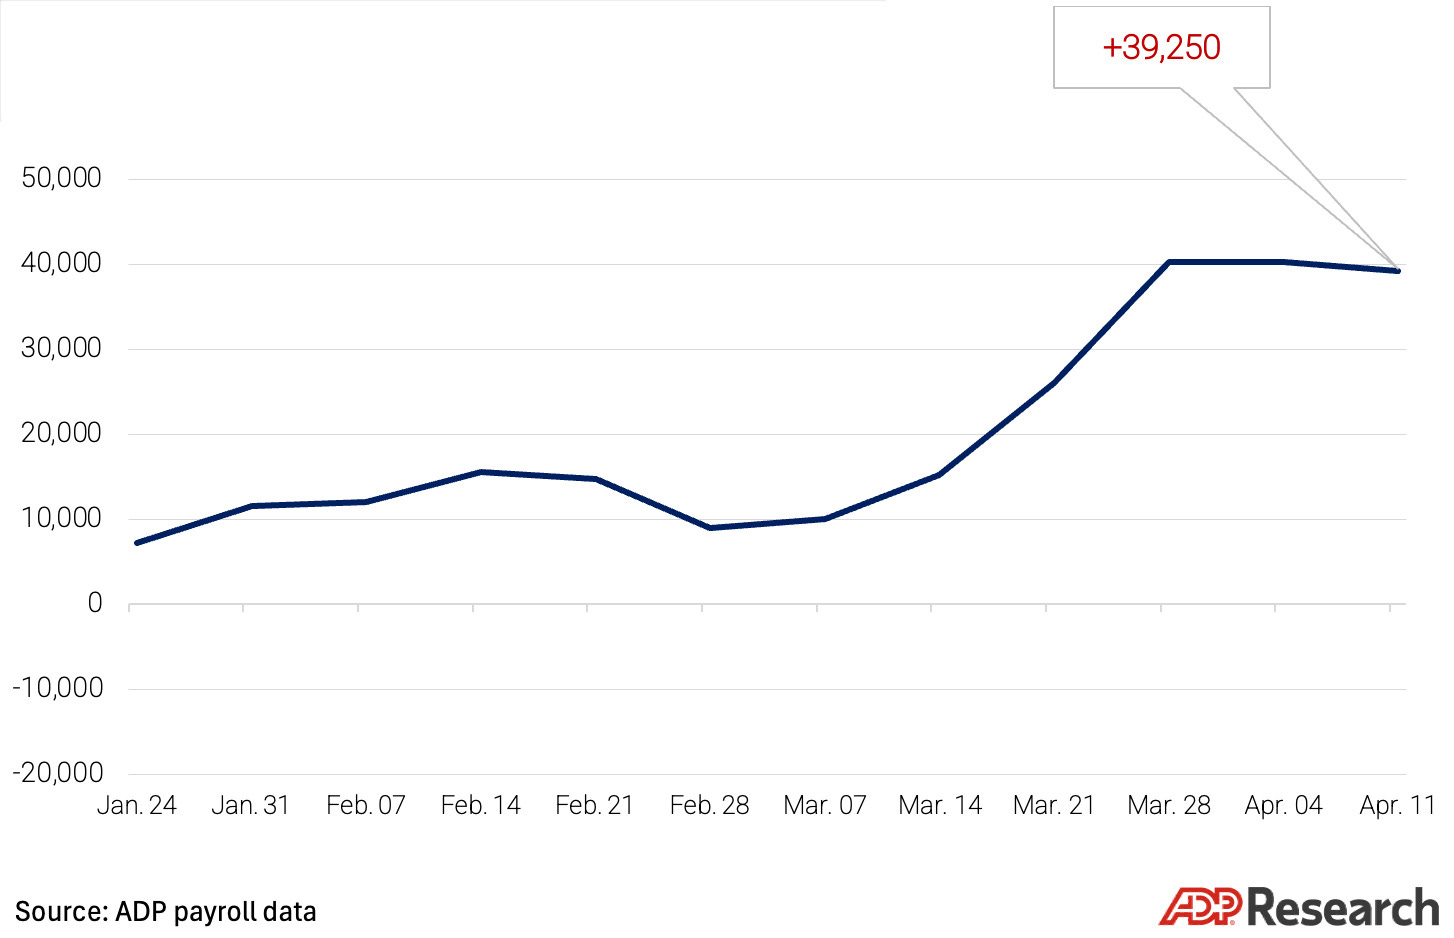
🤔 Recent private job growth cooled. According to payroll processor ADP, private U.S. employers added 39,250 jobs in the four weeks ending April 11.
For more on the labor market, read: About that ugly jobs report 📉
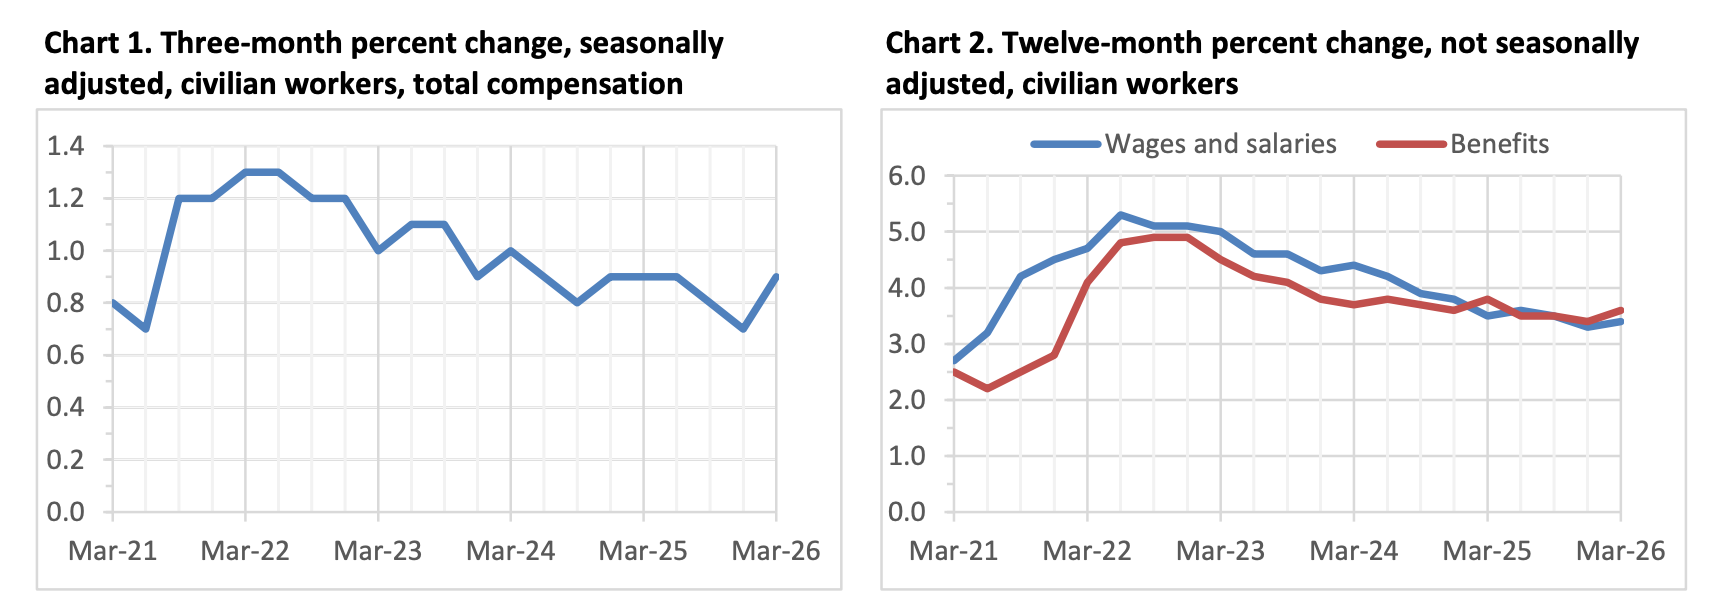
💵 Key labor costs metric picked up. The employment cost index in Q1 was up 0.9% from the prior quarter.
For more on why policymakers are watching wage growth, read: Revisiting the key chart to watch amid the Fed's war on inflation 📈
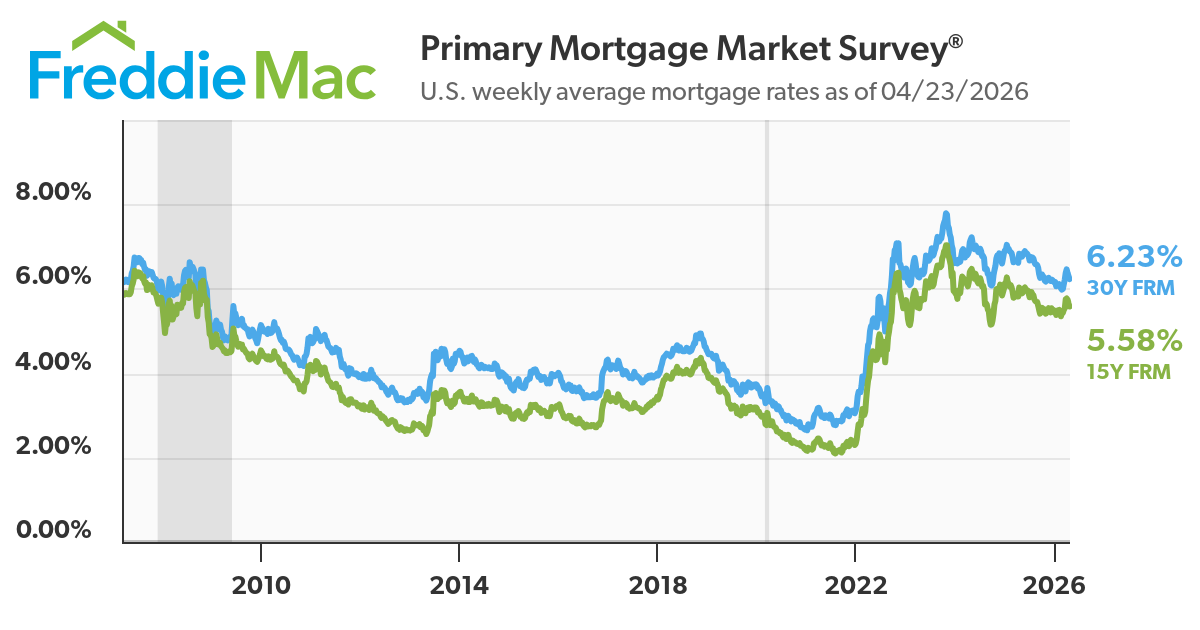
🏠 Mortgage rates tick higher. According to Freddie Mac, the average 30-year fixed-rate mortgage rose to 6.30%, up from 6.23% last week. “As rates had modestly declined the last few weeks, purchase demand has accelerated with purchase applications rising to over 20 percent above a year ago. It is clear that purchase demand continues to hold up as prospective buyers react to both modestly lower rates and more inventory to choose from than the last few years.“
As of Q4, there were 148.7 million housing units in the U.S., of which 87.8 million were owner-occupied and about 40% were mortgage-free. Of those carrying mortgage debt, almost all have fixed-rate mortgages, and most of those mortgages have rates that were locked in before rates surged from 2021 lows. All of this is to say: Most homeowners are not particularly sensitive to the small weekly movements in home prices or mortgage rates.
For more on mortgages and home prices, read: Why home prices and rents are creating all sorts of confusion about inflation 😖
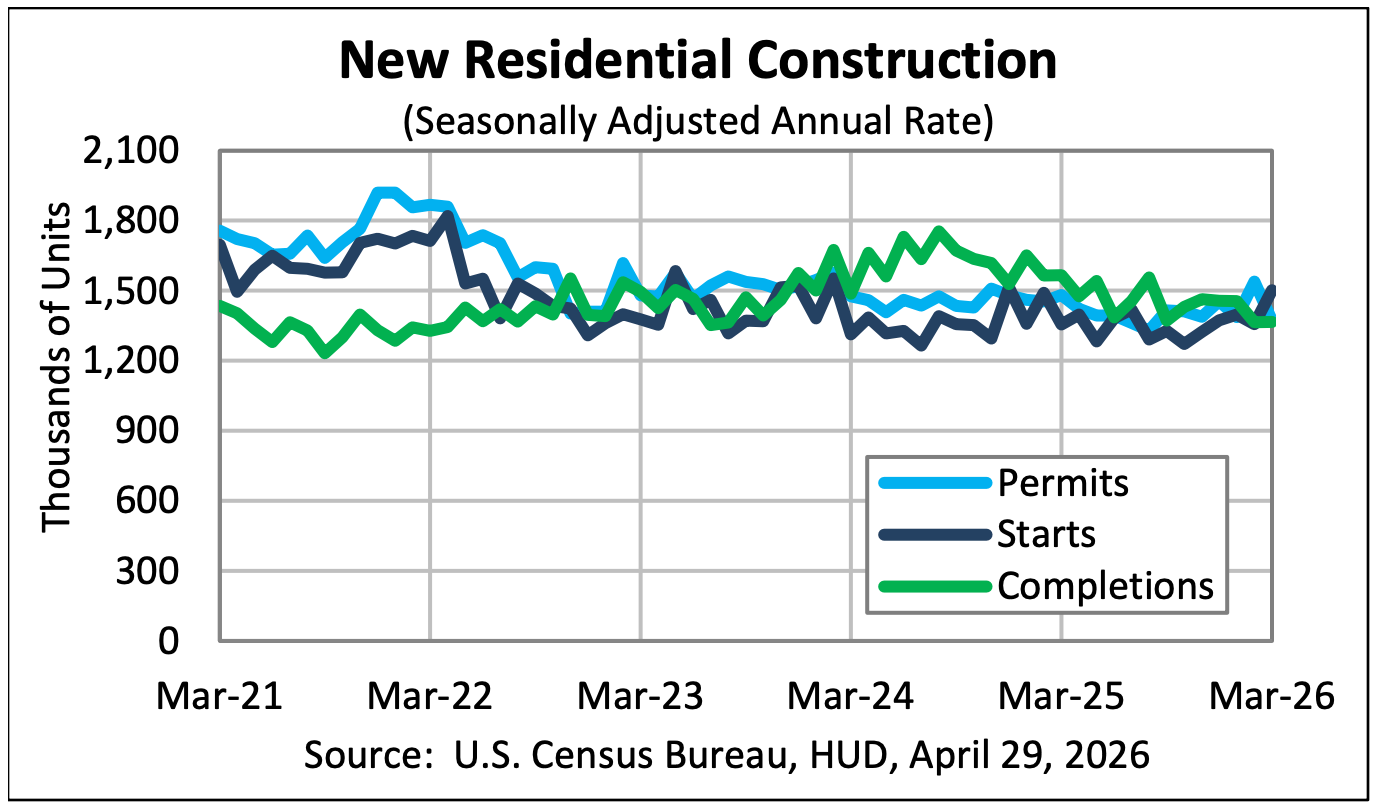
🔨 New home construction starts rise. Housing starts 10.8% in March to an annualized rate of 1.50 million units, according to the Census Bureau. Building permits declined 10.8% to an annualized rate of 1.37 million units.
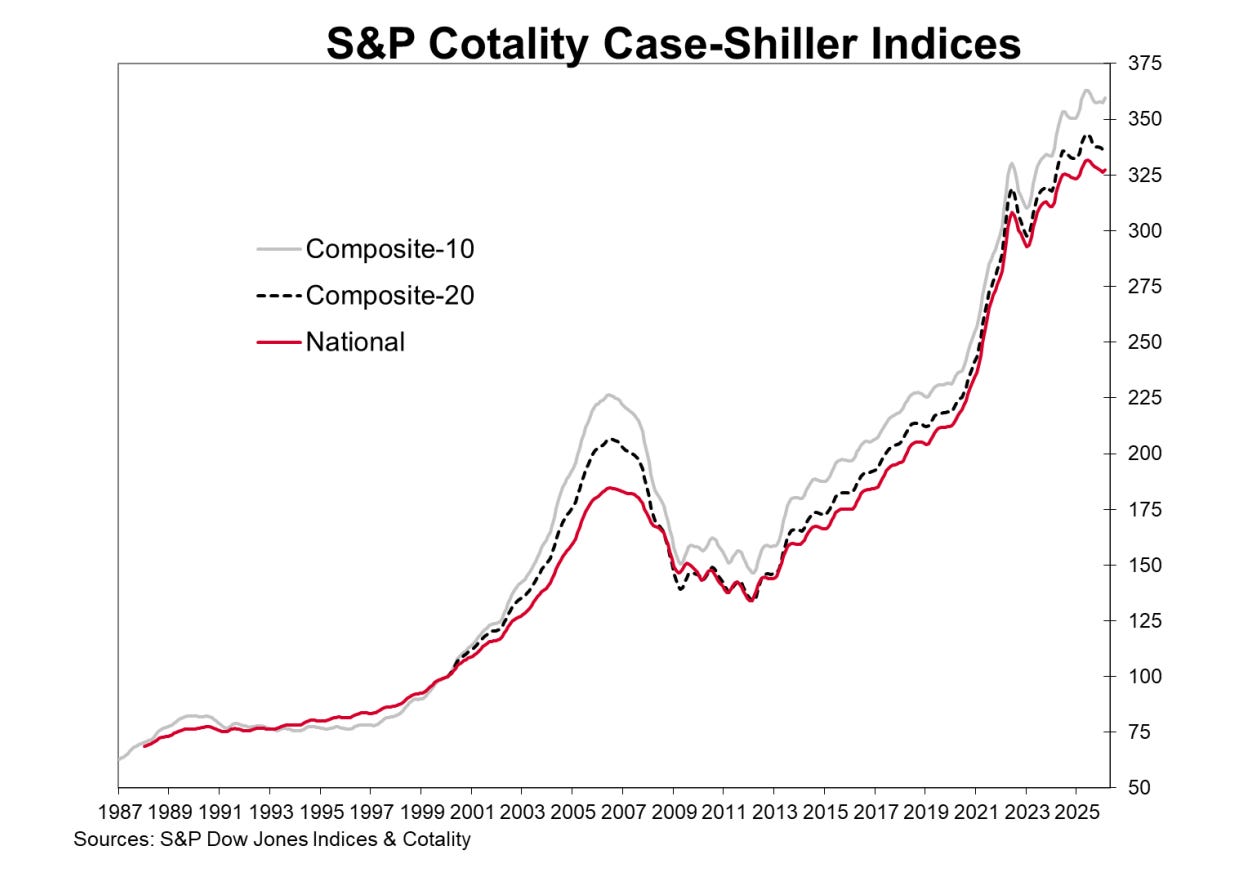
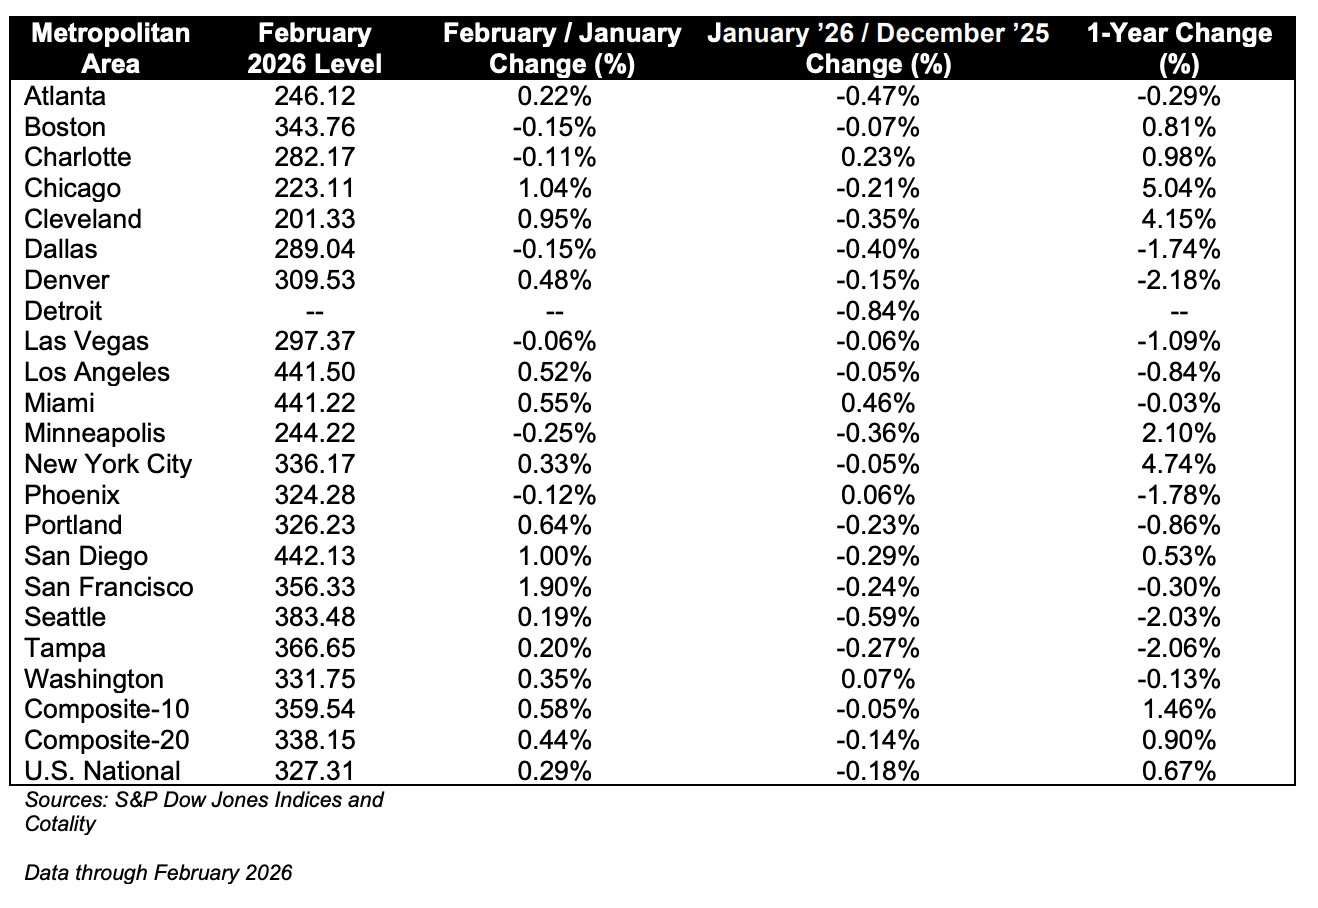
🏠 Home prices cool. According to the S&P CoreLogic Case-Shiller index, home prices were up 0.7% year-over-year in February, but declined 0.8% month-over-month. From S&P Dow Jones Indices’ Nicholas Godec: “More than half of major U.S. metropolitan markets posted year-over-year price declines in February, signaling that the housing slowdown has broadened well beyond its Sun Belt origins. …Mountain West (Denver -2.2%) and Pacific Northwest (Seattle -2.0%) markets now sit alongside Sun Belt decliners Tampa (-2.1%), Phoenix (-1.8%), and Dallas (-1.7%). Los Angeles (-0.8%) and Washington (-0.1%) joined the list of decliners, while Tampa’s decline narrowed for a fourth consecutive month and Denver displaced it as the weakest market in the index.”
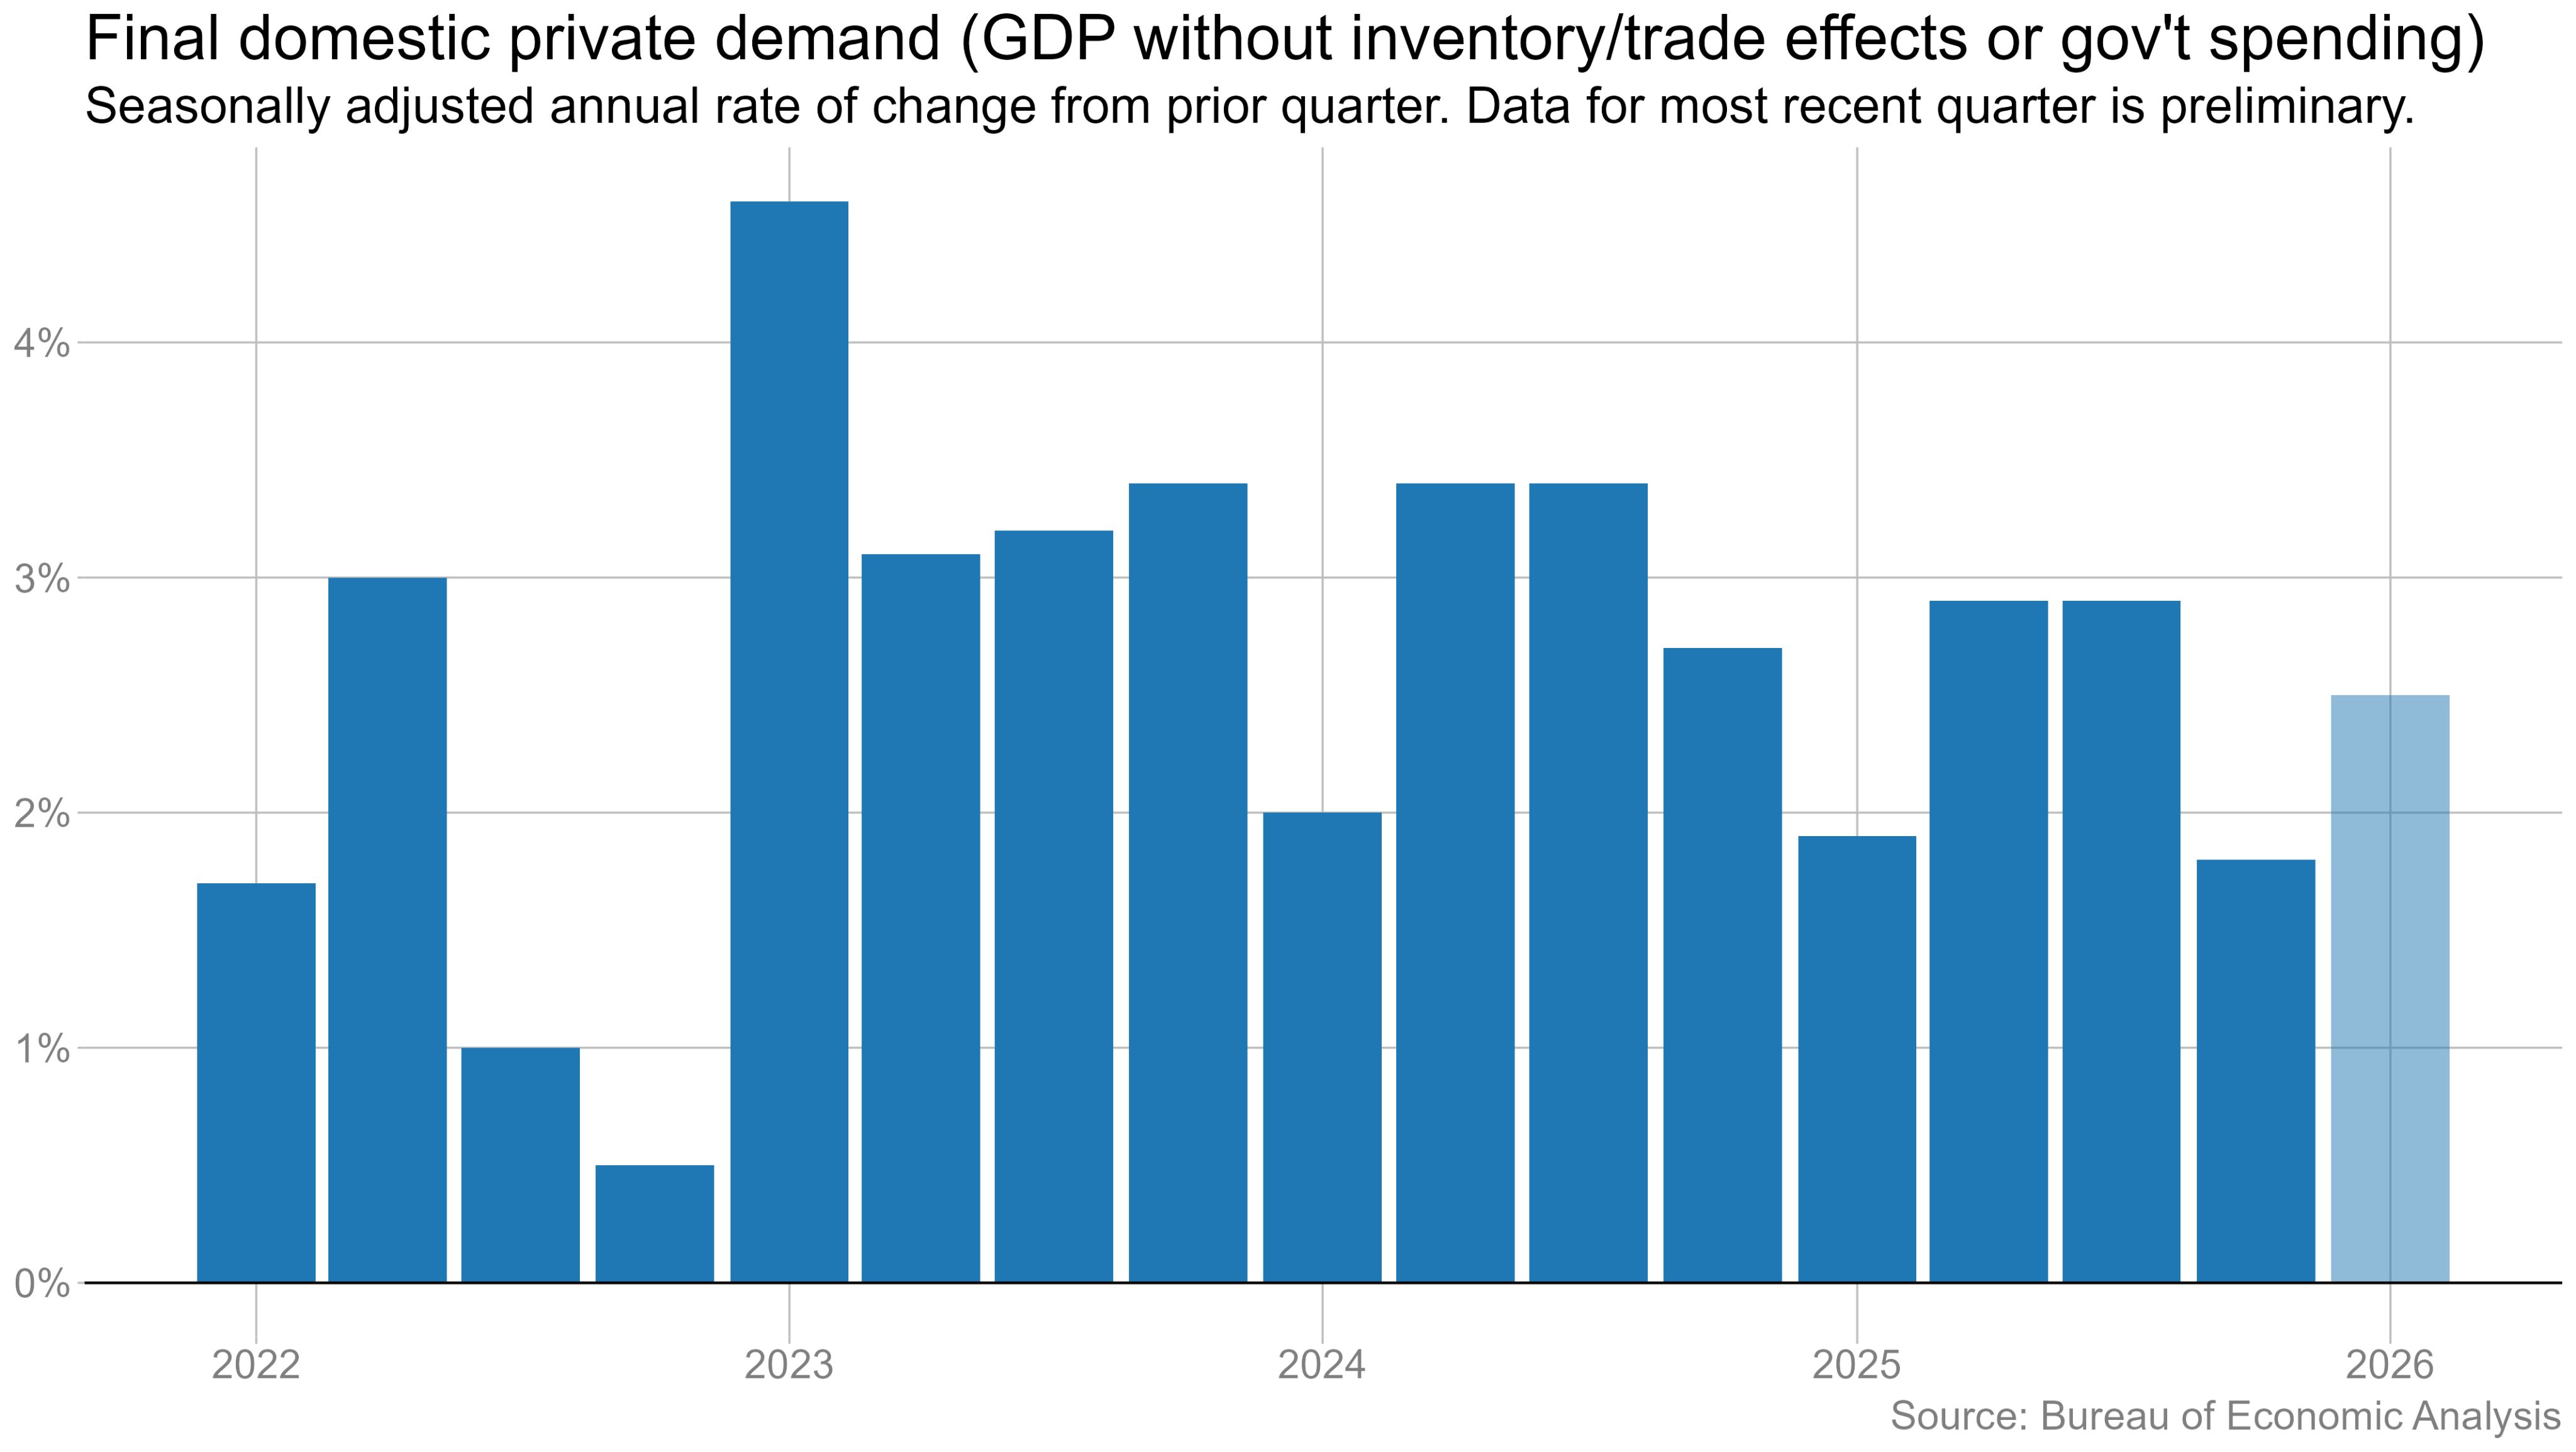
🐇 GDP growth picked up in Q1. U.S. GDP grew at a 2.0% rate in Q1, up from 0.5% in Q4. Investment and personal consumption led growth, more than offsetting the drag from net exports.
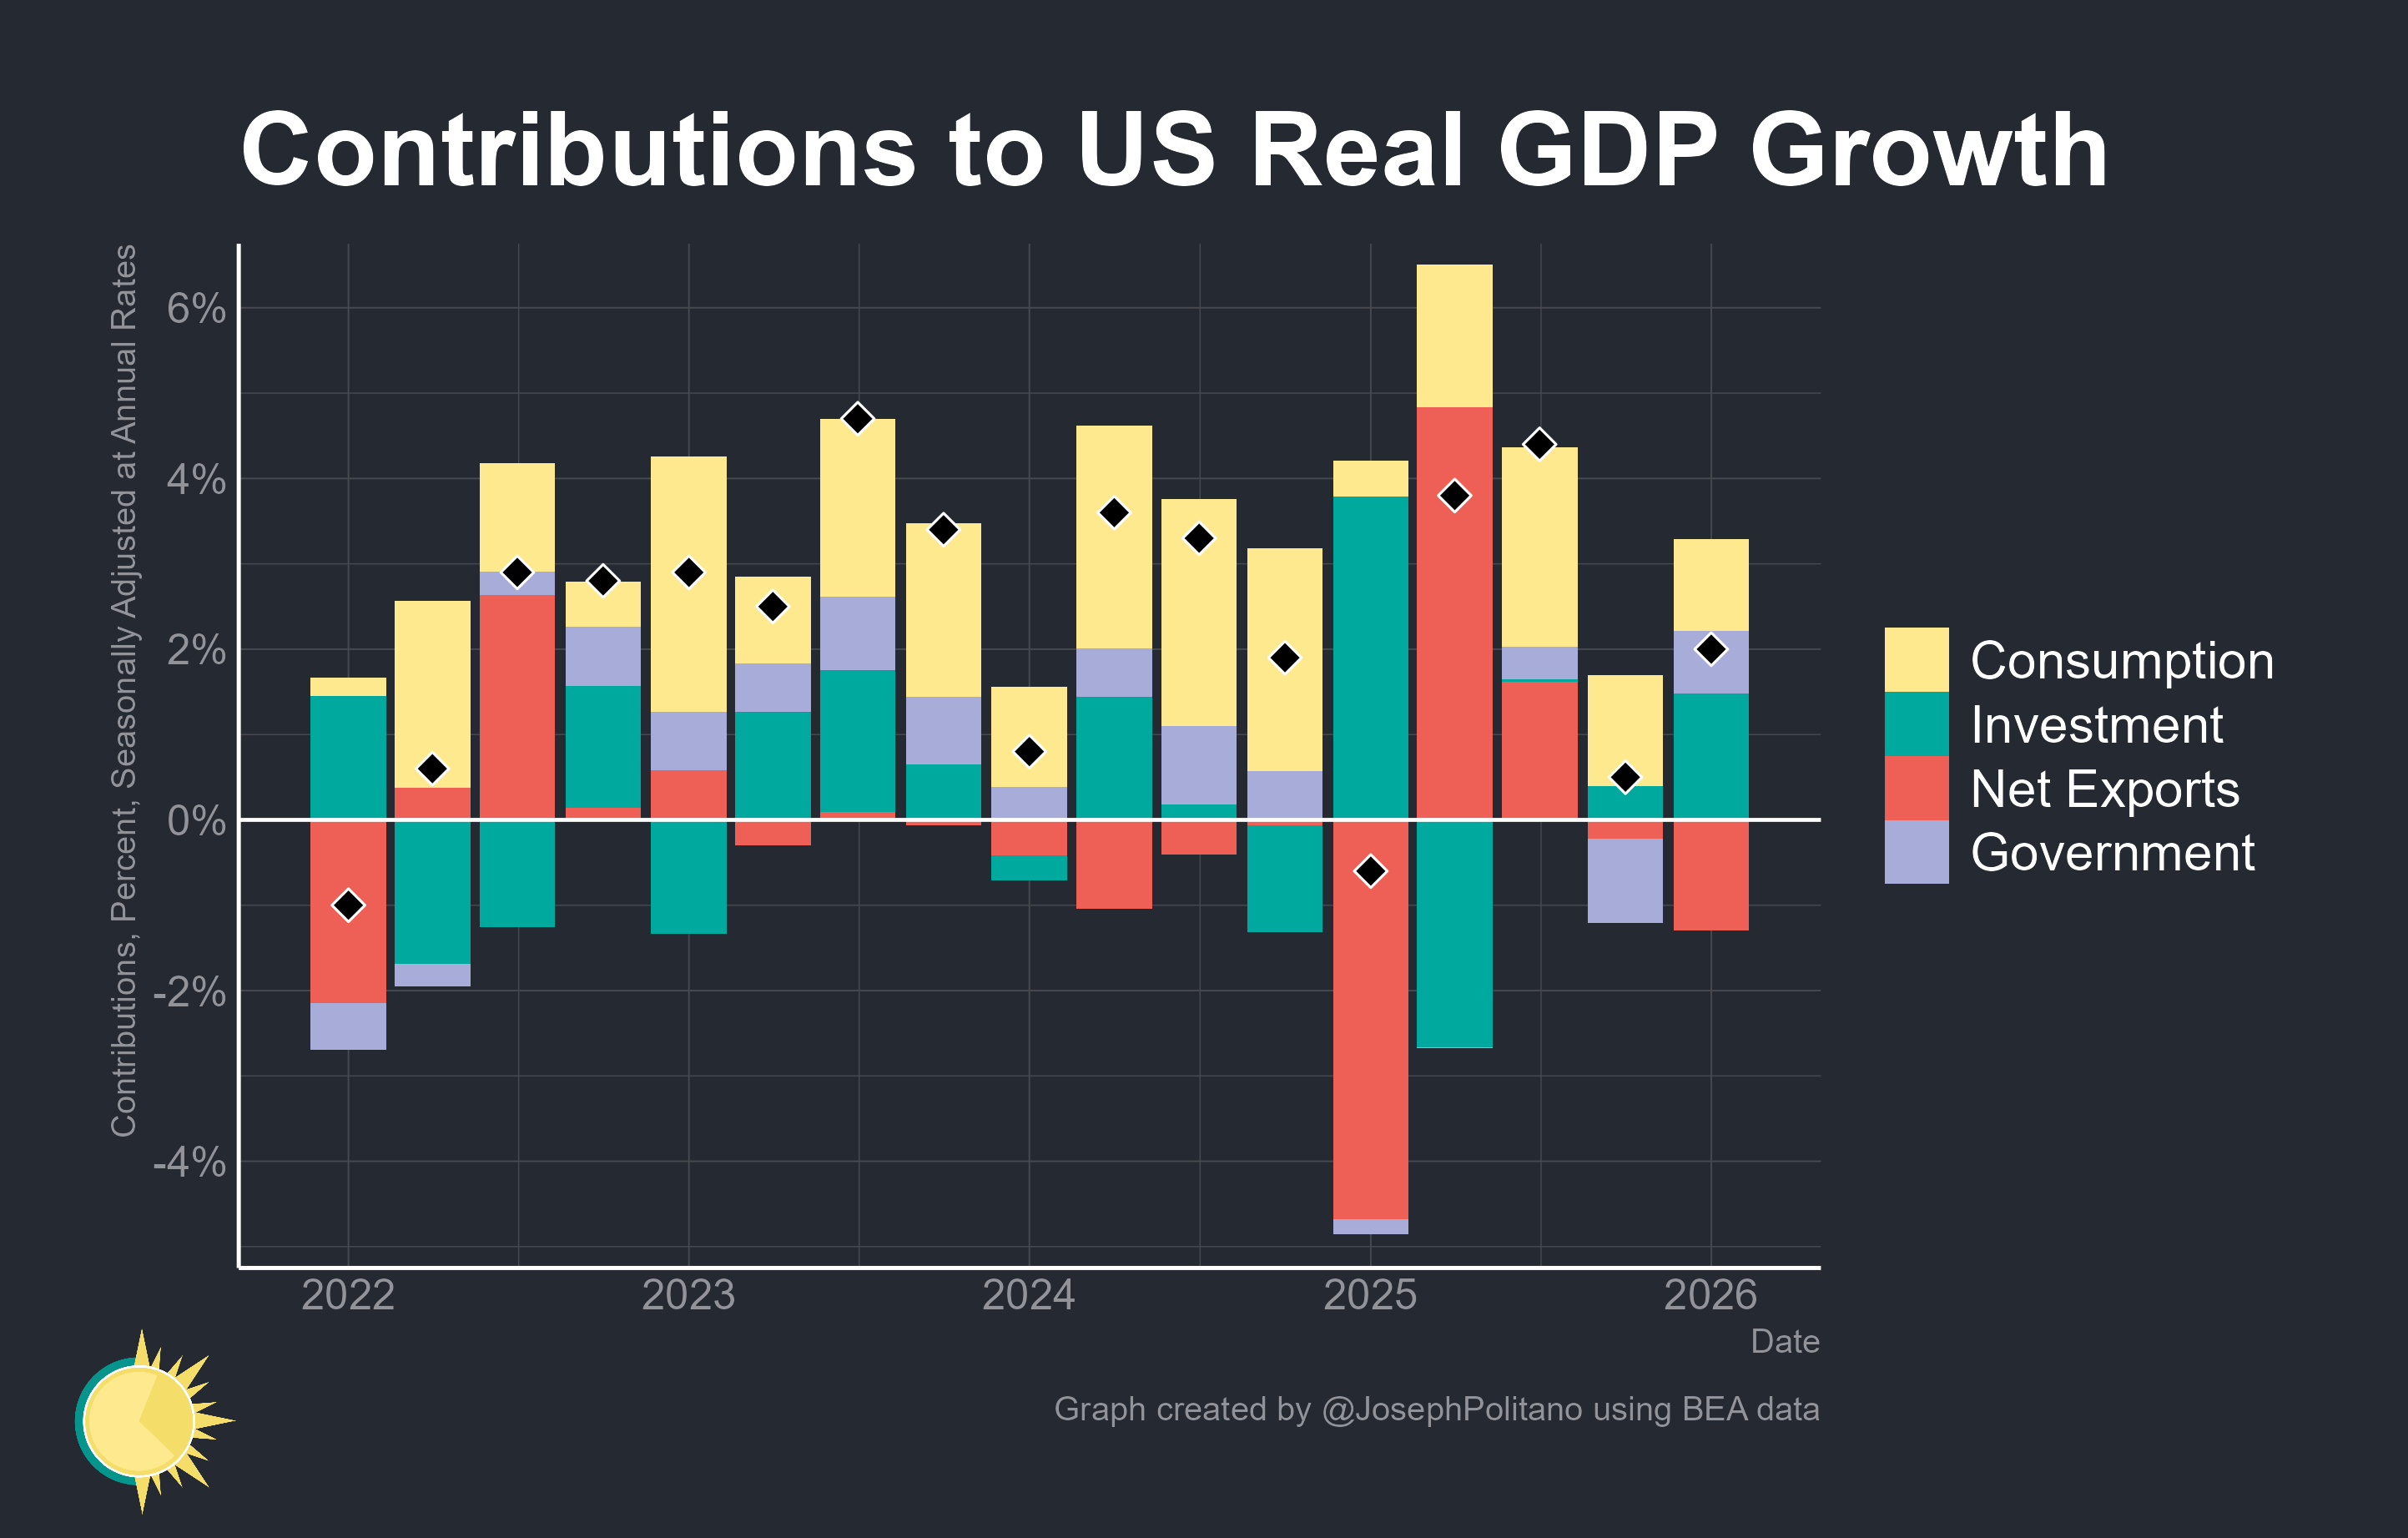
Because the GDP calculation has several quirks, economists often point to “real final sales to private domestic purchasers” to better understand the economy's underlying health. Sometimes referred to as “core” GDP, this metric excludes net exports, inventory adjustments, and government spending. That metric grew at a 2.5% rate in Q1.
For more on how GDP relates to the economy, read: It’s too ambiguous to just say ‘the economy’ 🤦🏻♂️
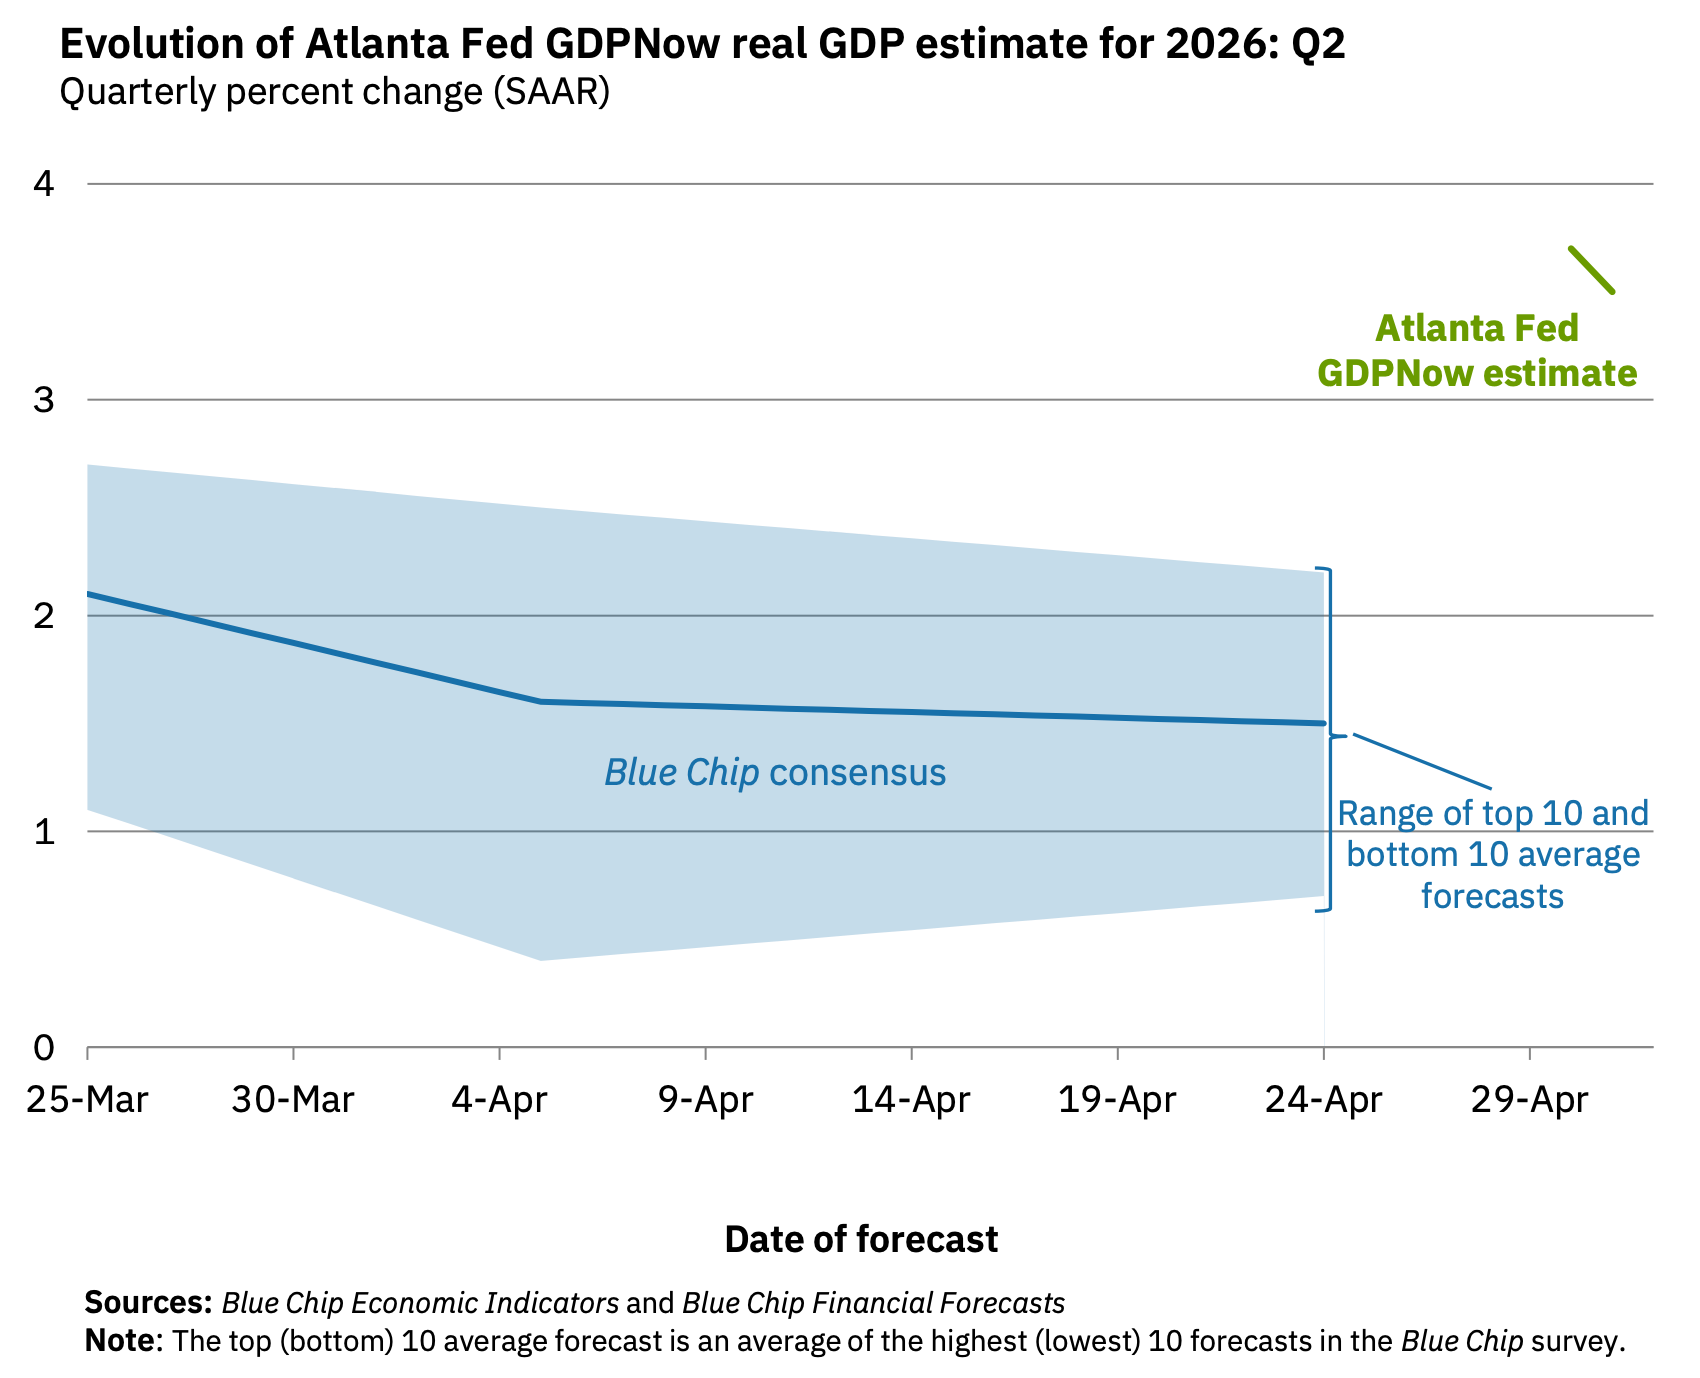
📈 Near-term GDP growth estimates are tracking positively. The Atlanta Fed’s GDPNow model sees real GDP growth rising at a 3.5% rate in Q2.
For more on GDP and the economy, read: It’s too ambiguous to just say ‘the economy’ 🤦🏻♂️ and Economic data can often be both ‘worse’ and ‘good’ 🌦️
Putting it all together 📋
Earnings look bullish: The long-term outlook for the stock market remains favorable, bolstered by expectations for years of earnings growth. And earnings are the most important driver of stock prices.
Demand is positive: Demand for goods and services remains positive, supported by healthy consumer and business balance sheets. Personal spending activity remains at record levels. Core capex orders, which are a leading indicator of business spending, have been on the rise.
Growth is cooling: While the economy remains healthy, growth has normalized from much hotter levels earlier in the cycle. The economy is less “coiled” these days as major tailwinds like job openings and excess savings have faded. Job creation is hovering at near-zero. It has become harder to argue that growth is destiny.
Actions speak louder than words: We are in an odd period, given that the hard economic data decoupled from the soft sentiment-oriented data. Consumer and business sentiment has been relatively poor, even as tangible consumer and business activity continues to grow and trend at record levels. From an investor’s perspective, what matters is that the hard economic data continues to hold up.
Stocks are not the economy: There’s a case to be made that the U.S. stock market could outperform the U.S. economy in the near term, thanks largely to positive operating leverage. Since the pandemic, companies have aggressively adjusted their cost structures. This came with strategic layoffs and investment in new equipment, including hardware powered by AI. These moves are resulting in positive operating leverage, which means a modest amount of sales growth — in the cooling economy — is translating to robust earnings growth.
Mind the ever-present risks: Of course, we should not get complacent. There will always be risks to worry about, such as U.S. political uncertainty, geopolitical turmoil, energy price volatility, and cyber attacks. There are also the dreaded unknowns. Any of these risks can flare up and spark short-term volatility in the markets.
Investing is never a smooth ride: There’s also the harsh reality that economic recessions and bear markets are developments that all long-term investors should expect as they build wealth in the markets. Always keep your stock market seat belts fastened.
Think long-term: For now, there’s no reason to believe there’ll be a challenge that the economy and the markets won’t overcome. The long game remains undefeated, and it’s a streak that long-term investors can expect to continue.
For more on how the macro story is evolving, check out the previous review of the macro crosscurrents. »
Key insights about the stock market 📈
Here’s a roundup of some of TKer’s most talked-about paid and free newsletters about the stock market. All of the headlines are hyperlinked to the archived pieces.
10 truths about the stock market 📈
The stock market can be an intimidating place: It’s real money on the line, there’s an overwhelming amount of information, and people have lost fortunes in it very quickly. But it’s also a place where thoughtful investors have long accumulated a lot of wealth. The primary difference between those two outlooks is related to misconceptions about the stock market that can lead people to make poor investment decisions.
The makeup of the S&P 500 is constantly changing 🔀
Passive investing is a concept usually associated with buying and holding a fund that tracks an index. And no passive investment strategy has attracted as much attention as buying an S&P 500 index fund. However, the S&P 500 — an index of 500 of the largest U.S. companies — is anything but a static set of 500 stocks.

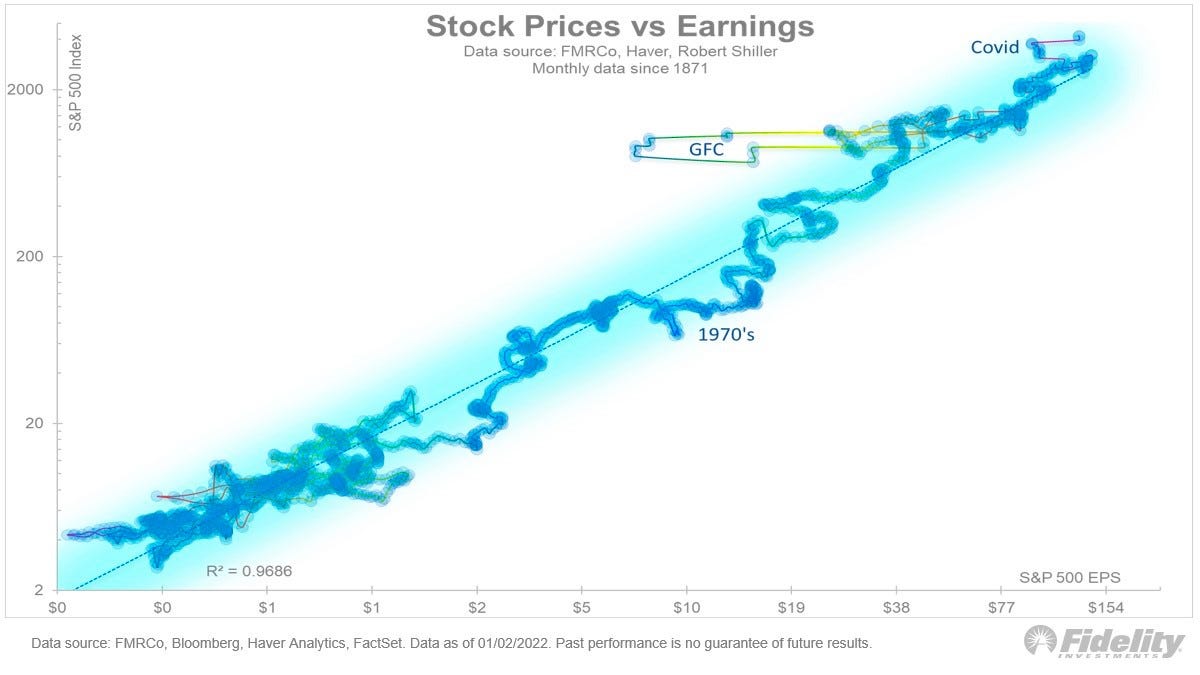
The key driver of stock prices: Earnings💰
For investors, anything you can ever learn about a company matters only if it also tells you something about earnings. That’s because long-term moves in a stock can ultimately be explained by the underlying company’s earnings, expectations for earnings, and uncertainty about those expectations for earnings. Over time, the relationship between stock prices and earnings has a very tight statistical relationship.
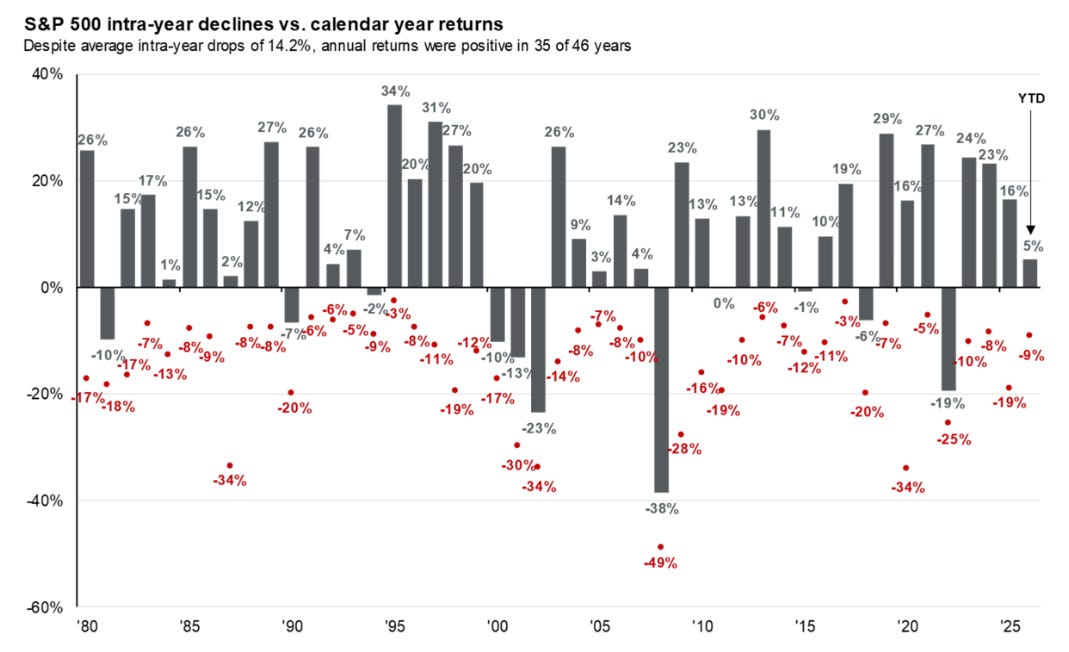
Stomach-churning stock market sell-offs are normal🎢
Investors should always be mentally prepared for some big sell-offs in the stock market. It’s part of the deal when you invest in an asset class that is sensitive to the constant flow of good and bad news. Since 1950, the S&P 500 has seen an average annual max drawdown (i.e., the biggest intra-year sell-off) of 14%.
How the stock market performed around recessions 📉📈
Every recession in history was different. And the range of stock performance around them varied greatly. There are two things worth noting. First, recessions have always been accompanied by a significant drawdown in stock prices. Second, the stock market bottomed and inflected upward long before recessions ended.

In the stock market, time pays ⏳
Since 1928, the S&P 500 has generated a positive total return more than 89% of the time over all five-year periods. Those are pretty good odds. When you extend the timeframe to 20 years, you’ll see that there’s never been a period where the S&P 500 didn’t generate a positive return.

What a strong dollar means for stocks 👑
While a strong dollar may be great news for Americans vacationing abroad and U.S. businesses importing goods from overseas, it’s a headwind for multinational U.S.-based corporations doing business in non-U.S. markets.

Stanley Druckenmiller's No. 1 piece of advice for novice investors 🧐
…you don't want to buy them when earnings are great, because what are they doing when their earnings are great? They go out and expand capacity. Three or four years later, there's overcapacity and they're losing money. What about when they're losing money? Well, then they’ve stopped building capacity. So three or four years later, capacity will have shrunk and their profit margins will be way up. So, you always have to sort of imagine the world the way it's going to be in 18 to 24 months as opposed to now. If you buy it now, you're buying into every single fad every single moment. Whereas if you envision the future, you're trying to imagine how that might be reflected differently in security prices.
Peter Lynch made a remarkably prescient market observation in 1994 🎯
Some event will come out of left field, and the market will go down, or the market will go up. Volatility will occur. Markets will continue to have these ups and downs. … Basic corporate profits have grown about 8% a year historically. So, corporate profits double about every nine years. The stock market ought to double about every nine years… The next 500 points, the next 600 points — I don’t know which way they’ll go… They’ll double again in eight or nine years after that. Because profits go up 8% a year, and stocks will follow. That's all there is to it.
Warren Buffett's 'fourth law of motion' 📉
Long ago, Sir Isaac Newton gave us three laws of motion, which were the work of genius. But Sir Isaac’s talents didn’t extend to investing: He lost a bundle in the South Sea Bubble, explaining later, “I can calculate the movement of the stars, but not the madness of men.” If he had not been traumatized by this loss, Sir Isaac might well have gone on to discover the Fourth Law of Motion: For investors as a whole, returns decrease as motion increases.
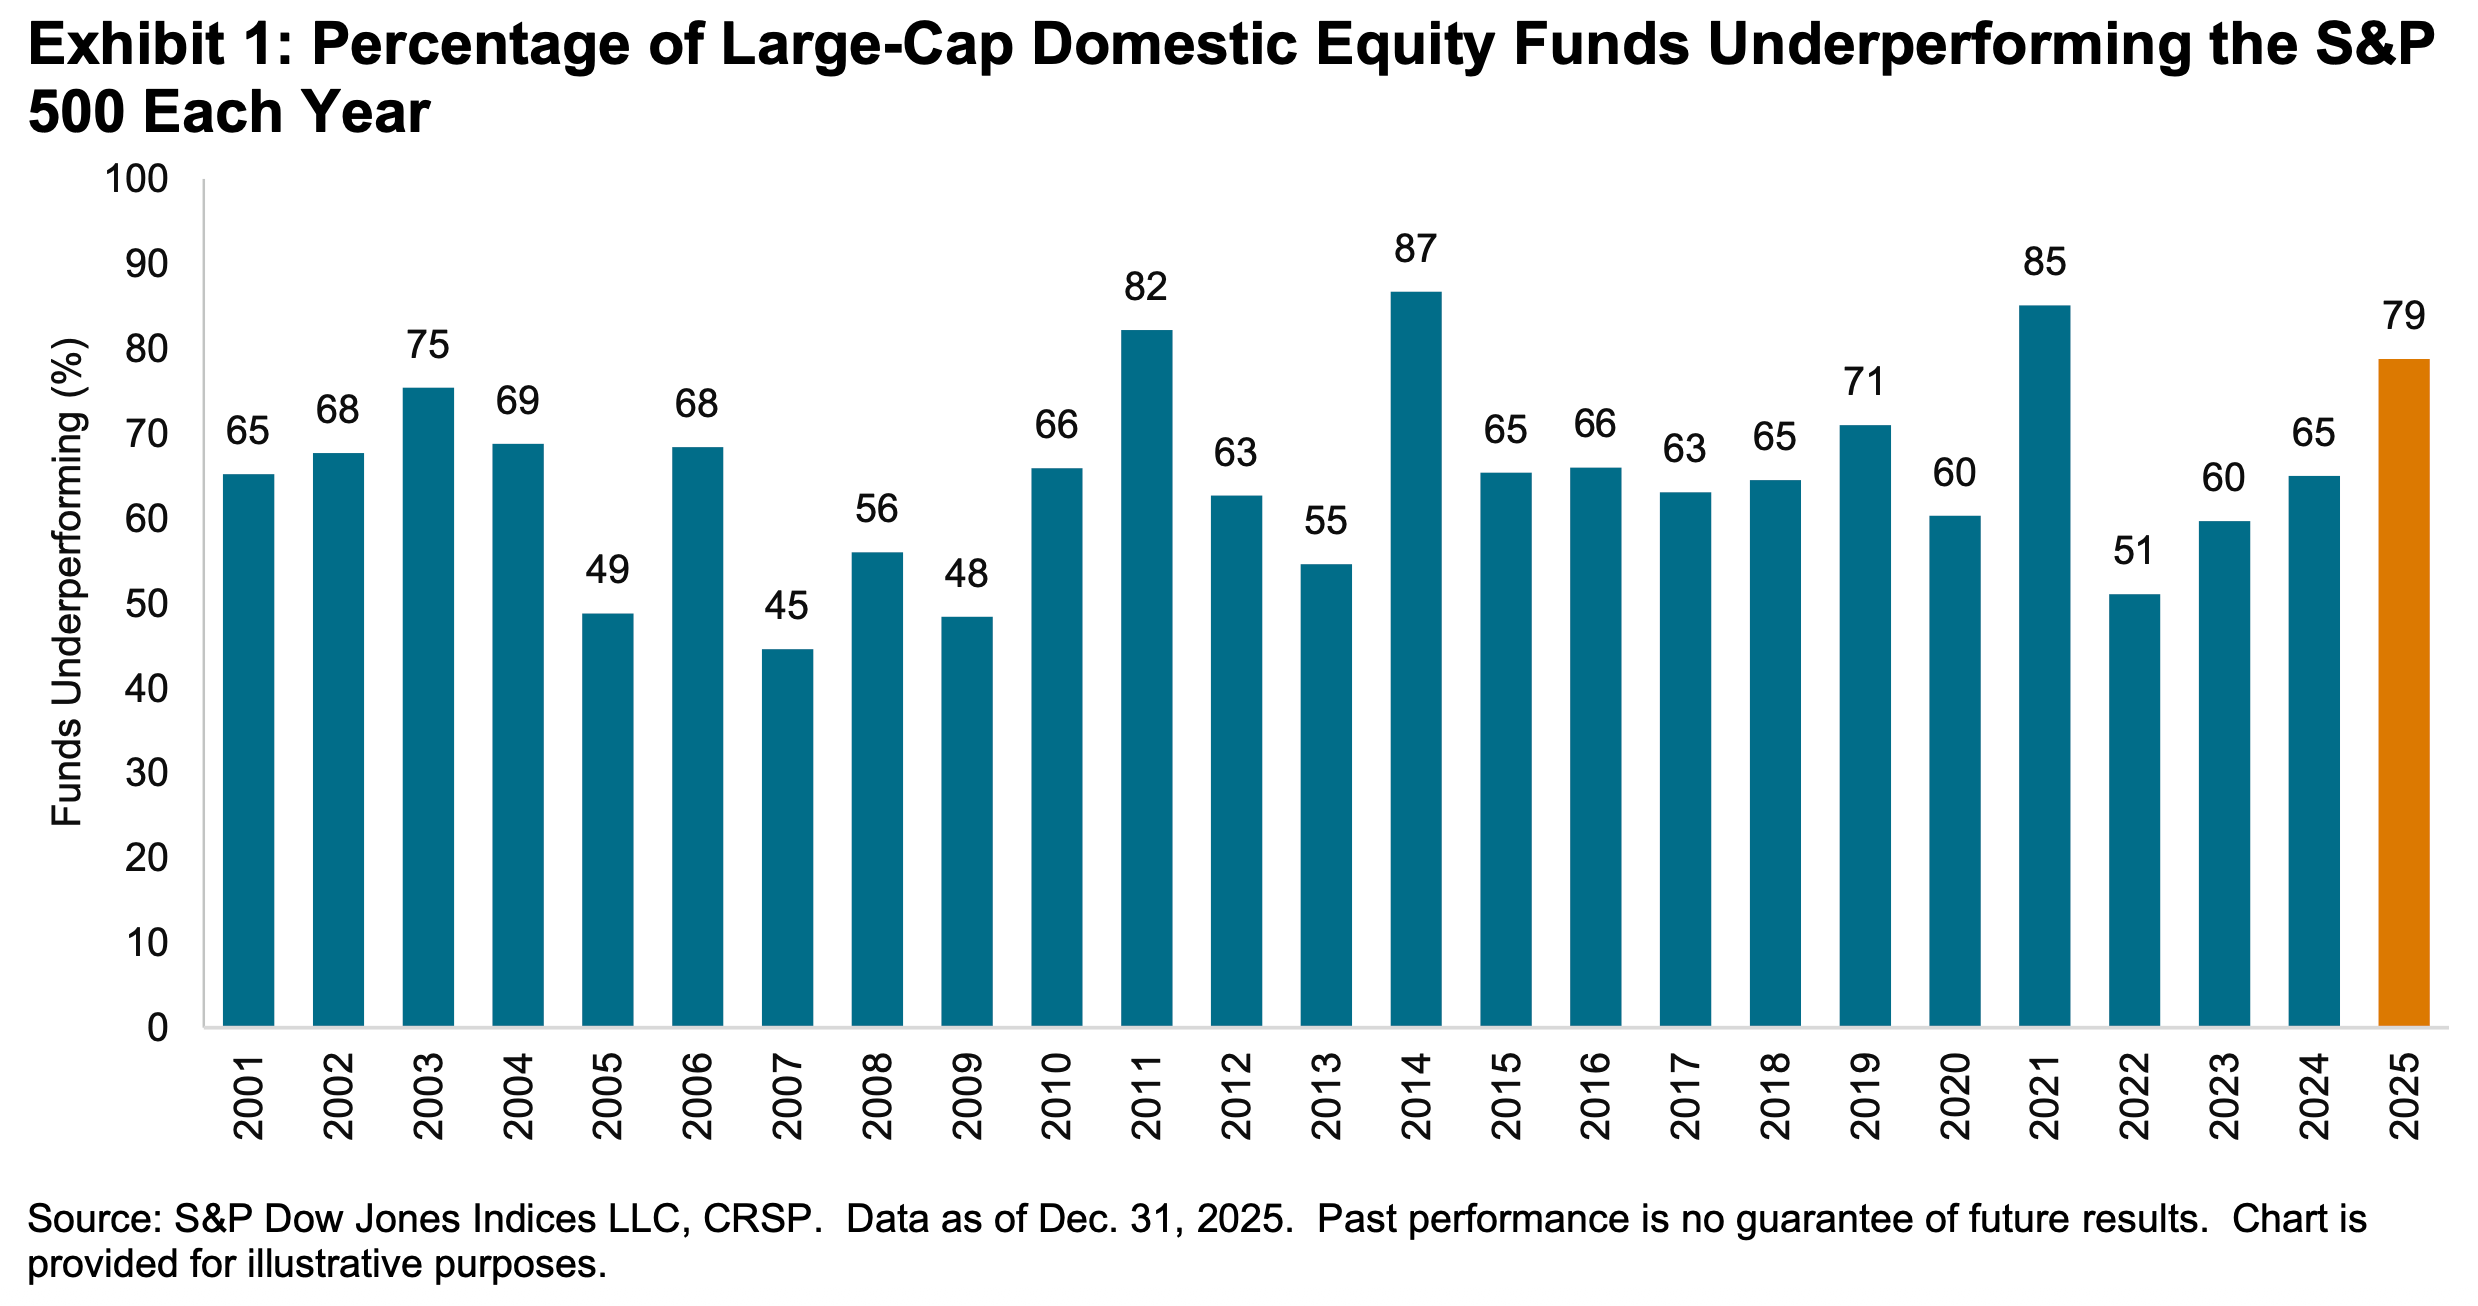
Most pros can’t beat the market 🥊
According to S&P Dow Jones Indices (SPDJI), 79% of U.S. large-cap equity fund managers underperformed the S&P 500 in 2025. As you stretch the time horizon, the numbers get even more dismal. Over three years, 67% underperformed. Over 5 years, 89% underperformed. And over 20 years, 93% underperformed. This 2025 performance was the 16th consecutive year in which the majority of fund managers in this category have lagged the index.
Proof that 'past performance is no guarantee of future results' 📊
Even if you are a fund manager who generated industry-leading returns in one year, history says it’s an almost insurmountable task to stay on top consistently in subsequent years. According to S&P Dow Jones Indices, just 4.21% of all U.S. equity funds in the top half of performance during the first year were able to remain in the top during the four subsequent years. Only 2.42% of U.S. large-cap funds remained in the top half
SPDJI’s report also considered fund performance relative to their benchmarks over the past three years. Of 738 U.S. large-cap equity funds tracked by SPDJI, 50.68% beat the S&P 500 in 2022. Just 5.08% beat the S&P in the two years ending 2023. And only 2.14% of the funds beat the index over the three years ending in 2024.

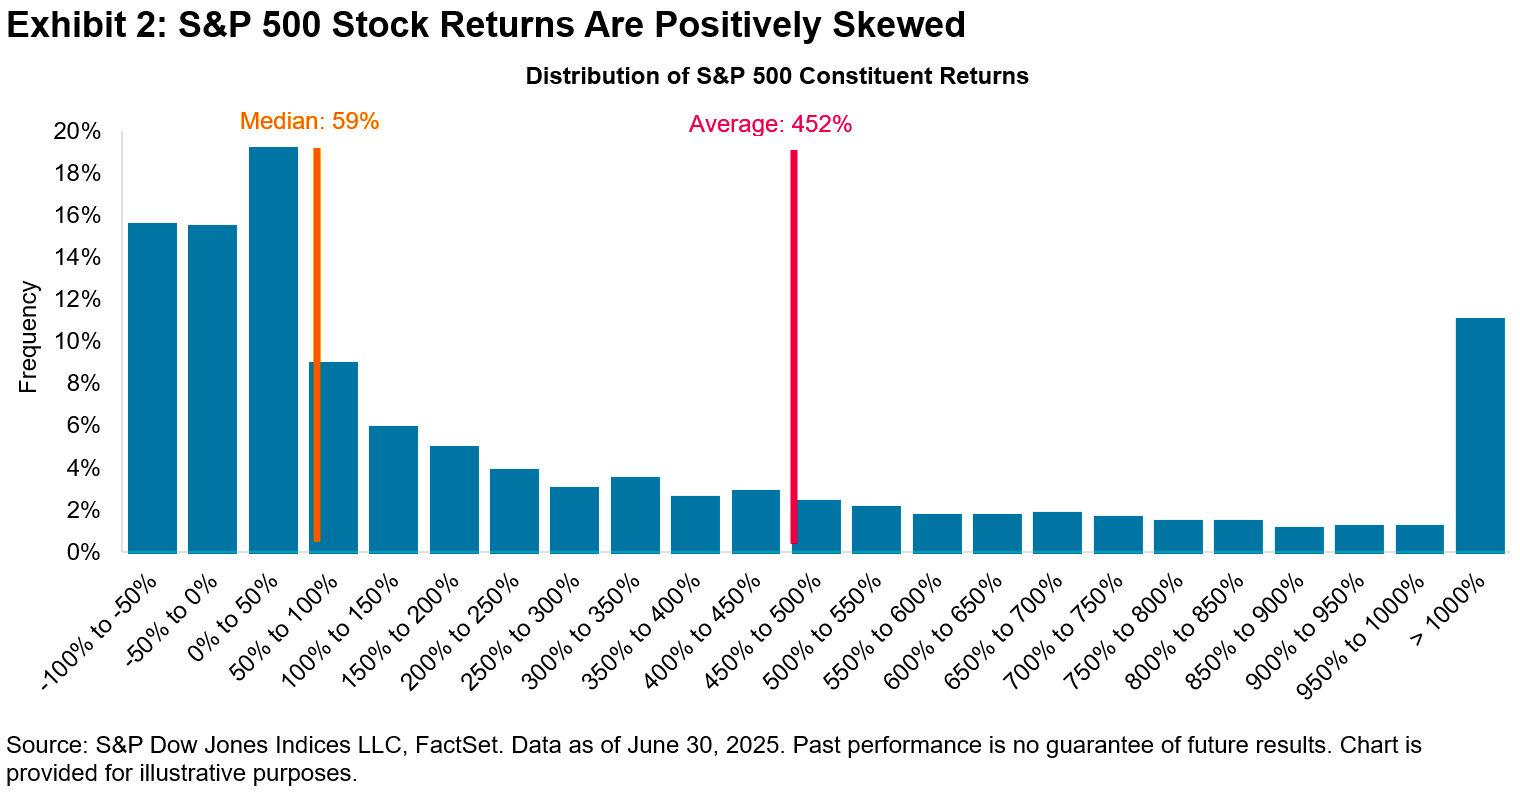
The odds are stacked against stock pickers 🎲
Picking stocks in an attempt to beat market averages is an incredibly challenging and sometimes money-losing effort. Most professional stock pickers aren’t able to do this consistently. One of the reasons for this is that most stocks don’t deliver above-average returns. According to S&P Dow Jones Indices, only 19% of the stocks in the S&P 500 outperformed the average stock’s return from 2001 to 2025. Over this period, the average return on an S&P 500 stock was 452%, while the median stock rose by just 59%.