🗓️ PROGRAMMING NOTE: TKer’s free Sunday newsletter will be on hiatus until Sept. 13 as we enjoy a few summer Fridays. Paid subscribers will continue to receive newsletters covering timely topics as they arise.
-
The economy is doing pretty well, earnings growth is great, and the stock market just set new all-time highs.
In recent weeks and months, much of the major news we’ve gotten has been consistent with ongoing market narratives, which we’ve covered in this year’s free and paid newsletters.
But I know we’re all busy, and most of us aren’t able to read through every newsletter.
So for your convenience, I’ll do a speedrun through some of the data and insights shared in some of these newsletters that you might find helpful today.
History continues to confirm that the stock market can trend higher even as the market’s leaders struggle. (Link)
Many of the popular arguments for why this year’s stock market rebound “doesn’t make sense” are getting the story wrong. (Link)
Most of the time, the stock market has bigger concerns than the next quarter-point move by the Fed. (Link)
Some people are worried about earnings growth cooling. There’s evidence that the market has been pricing in this concern for a year. (Link)
Energy costs are nothing compared to labor costs for most big, publicly traded companies. (Link)
For stocks, the direction of interest rates isn’t as important as the rate of change. (Link)
Things that make obvious economic sense aren’t always consistent with what happens in the stock market. (Link)
Investing in the stock market at all-time highs has produced slightly better returns than investing during other periods. (Link)
Investing in non-U.S. stock markets doesn’t always reduce your exposure to the U.S. economy. (Link)
All but two of the world’s major stock markets are more concentrated than the U.S. (Link)
The S&P 500’s index inclusion requirements are pretty good. But they also have some big issues. Maybe it’s time for a change, which wouldn’t be unprecedented. (Link)
A falling saving rate doesn’t mean households are financially stretched. In fact, it may reflect increasing financial strength. (Link)
Consumers have become less sensitive to inflation. (Link)
Many of the most successful companies in history have pivoted to businesses their initial investors would have never anticipated. (Link)
Some advisors recommend investors bury their heads in the sand to avoid making mistakes. I think that’s bad advice and will make you more prone to making mistakes. (Link)
Stocks have been a good hedge against inflation. (Link)
Even though it has increasingly become a “stock picker’s market,” there’s not much evidence that more stock pickers are beating the market. (Link)
Anything in the news that matters for investors can be tied to line items on a business’s income statement. (Link)
We spend a lot of time worrying about things that won’t happen and not enough time worrying about things that will. (Link)
Wall Street’s first 2027 stock market forecast is out, and it’s basically exactly what TKer subscribers might expect. (Link)
No matter how good things get, most people will never be satisfied with what they have, and that’s bullish. (Link)
Profit margins are at record highs, and they’re trending higher for most sectors. (Link)
For investors, many macro debates are resolved every three months. (Link)
I can make the argument that expecting a 10% stock market decline isn’t actually bearish. (Link)
There’s more from where that came from. If you have questions about the stock market, chances are you’ll find answers in TKer’s archives. Use the search🔎 function in the upper right corner of TKer.co and type in some keywords.
-
Related from TKer:
How do I think of today’s AI craze relative to past bubbles? 🫧🤖🚂🚗
Two seemingly contradictory charts about economists and the economy 📈📉
Review of the macro crosscurrents 🔀
📈The stock market rallied to all-time highs, with the S&P 500 setting an intraday high of 7,816.70 and a closing high of 7,798.99 on Thursday. The index is up 13.7% year-to-date. For market insights, check out the Stock Market tab at TKer. »
There were several notable data points and macroeconomic developments since our last review:
💰Household finances are stable and mostly normalizing. Household finances strengthened considerably during the COVID-19 pandemic, helped by a combination of limited spending options and government financial support. Over the past three years, finances have deteriorated but are mostly normalizing to pre-pandemic levels.
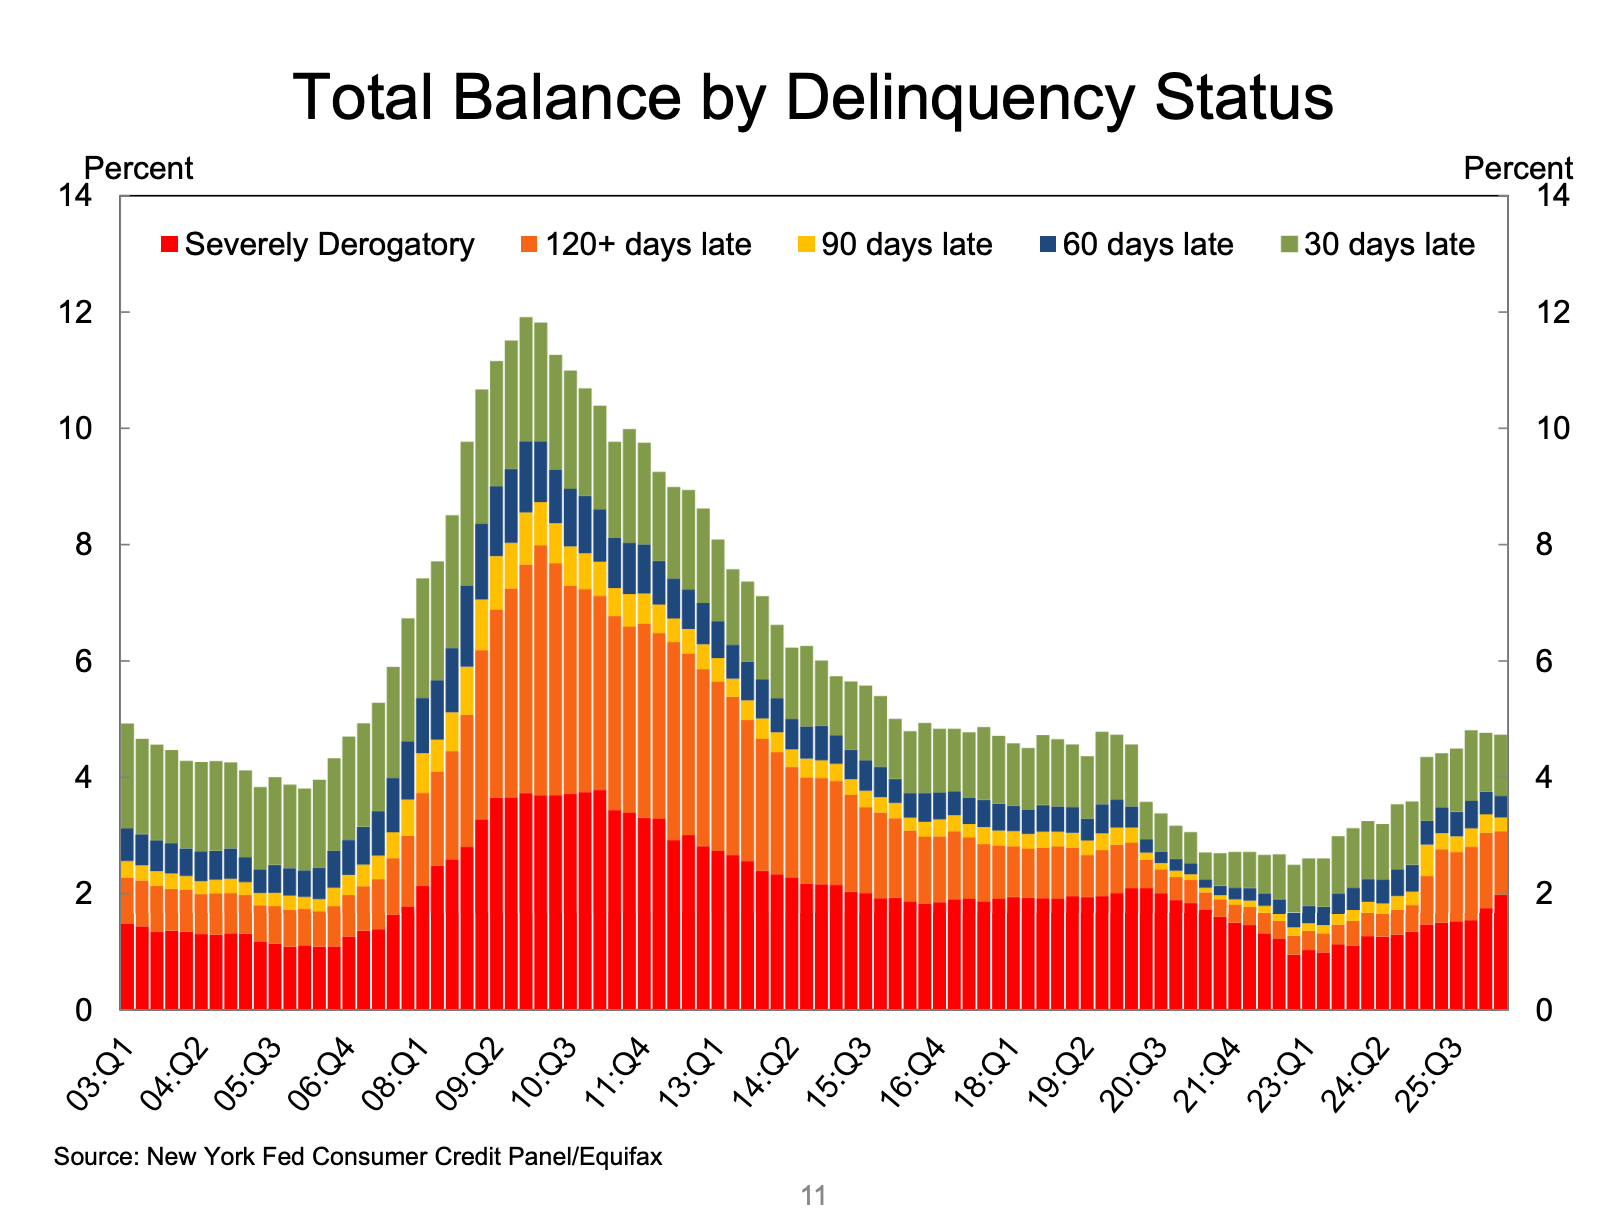
The New York Fed’s Household Debt & Credit report suggests finances continue to stabilize at those more normal levels. From the Q2 report: “Aggregate delinquency rates improved slightly in Q2 2026, with 4.7% of outstanding debt in some stage of delinquency.“
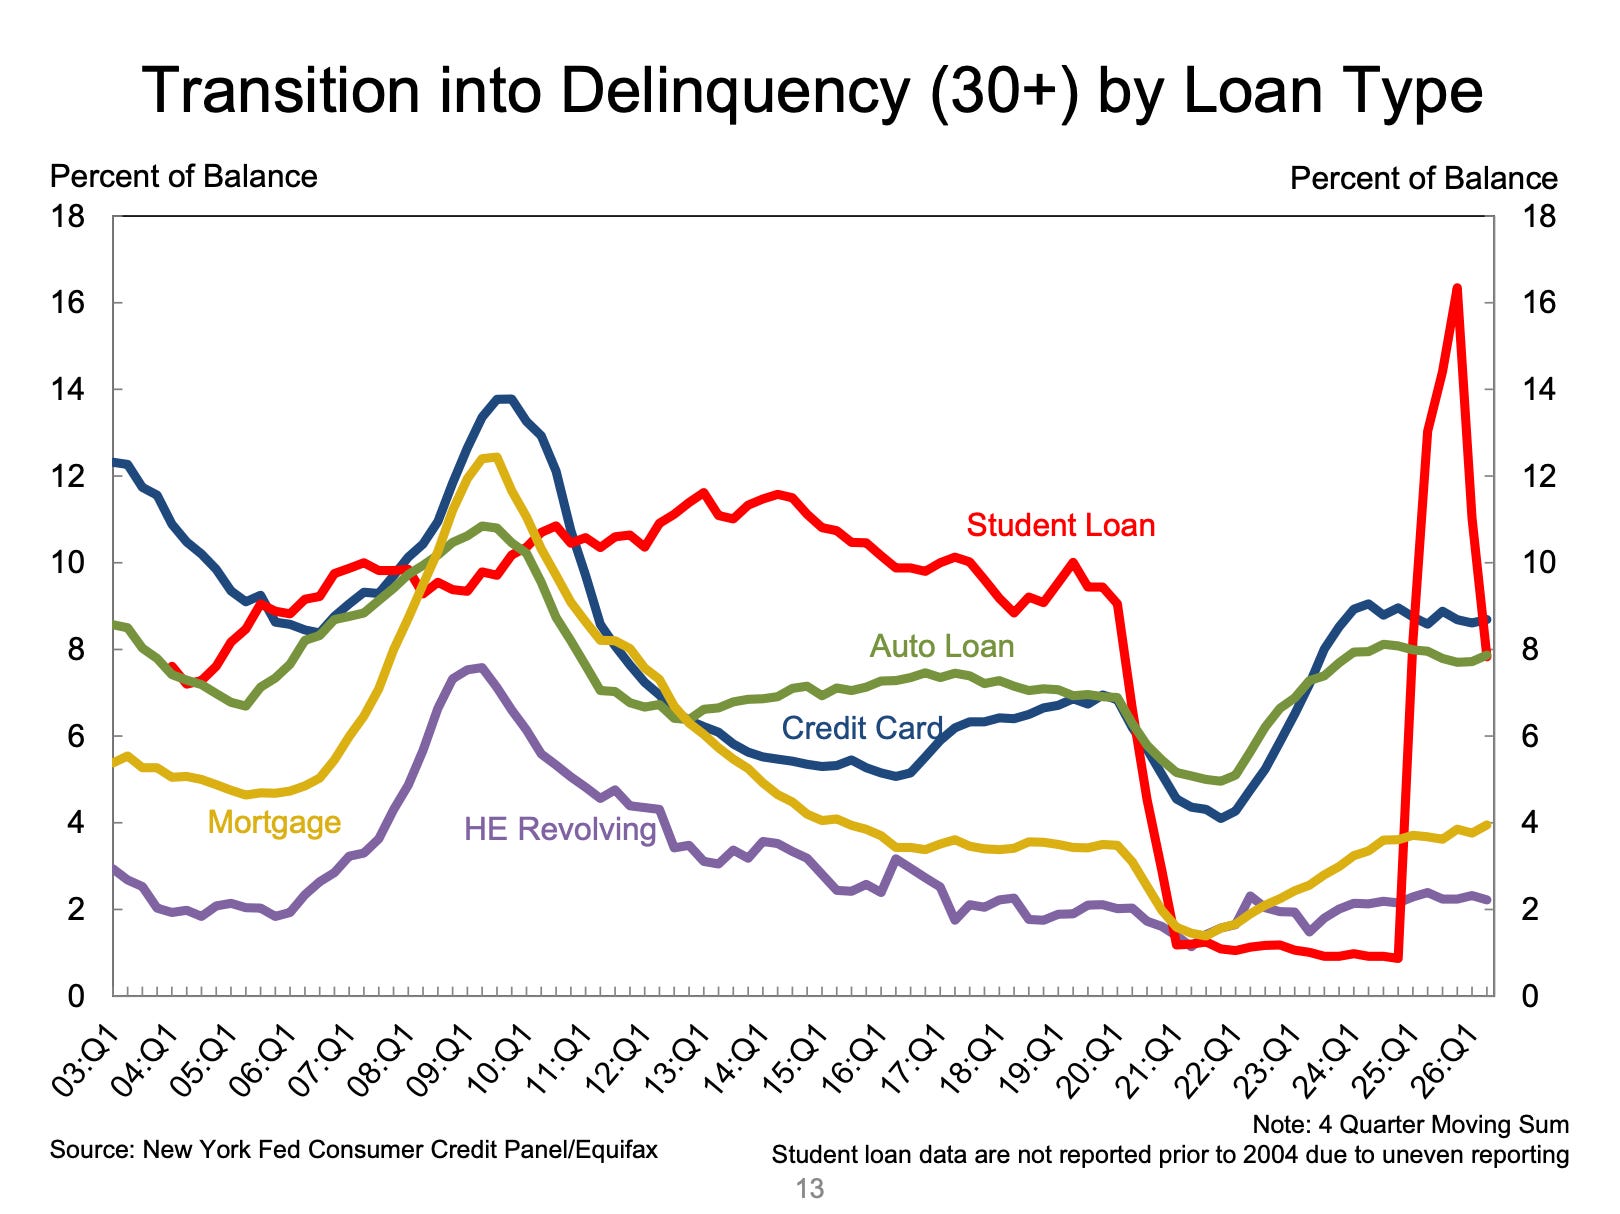
“Transition into early delinquency rose slightly for auto loans and mortgages but was largely steady for credit cards and ‘other’ debts. Delinquency transitions improved slightly for HELOCs.“
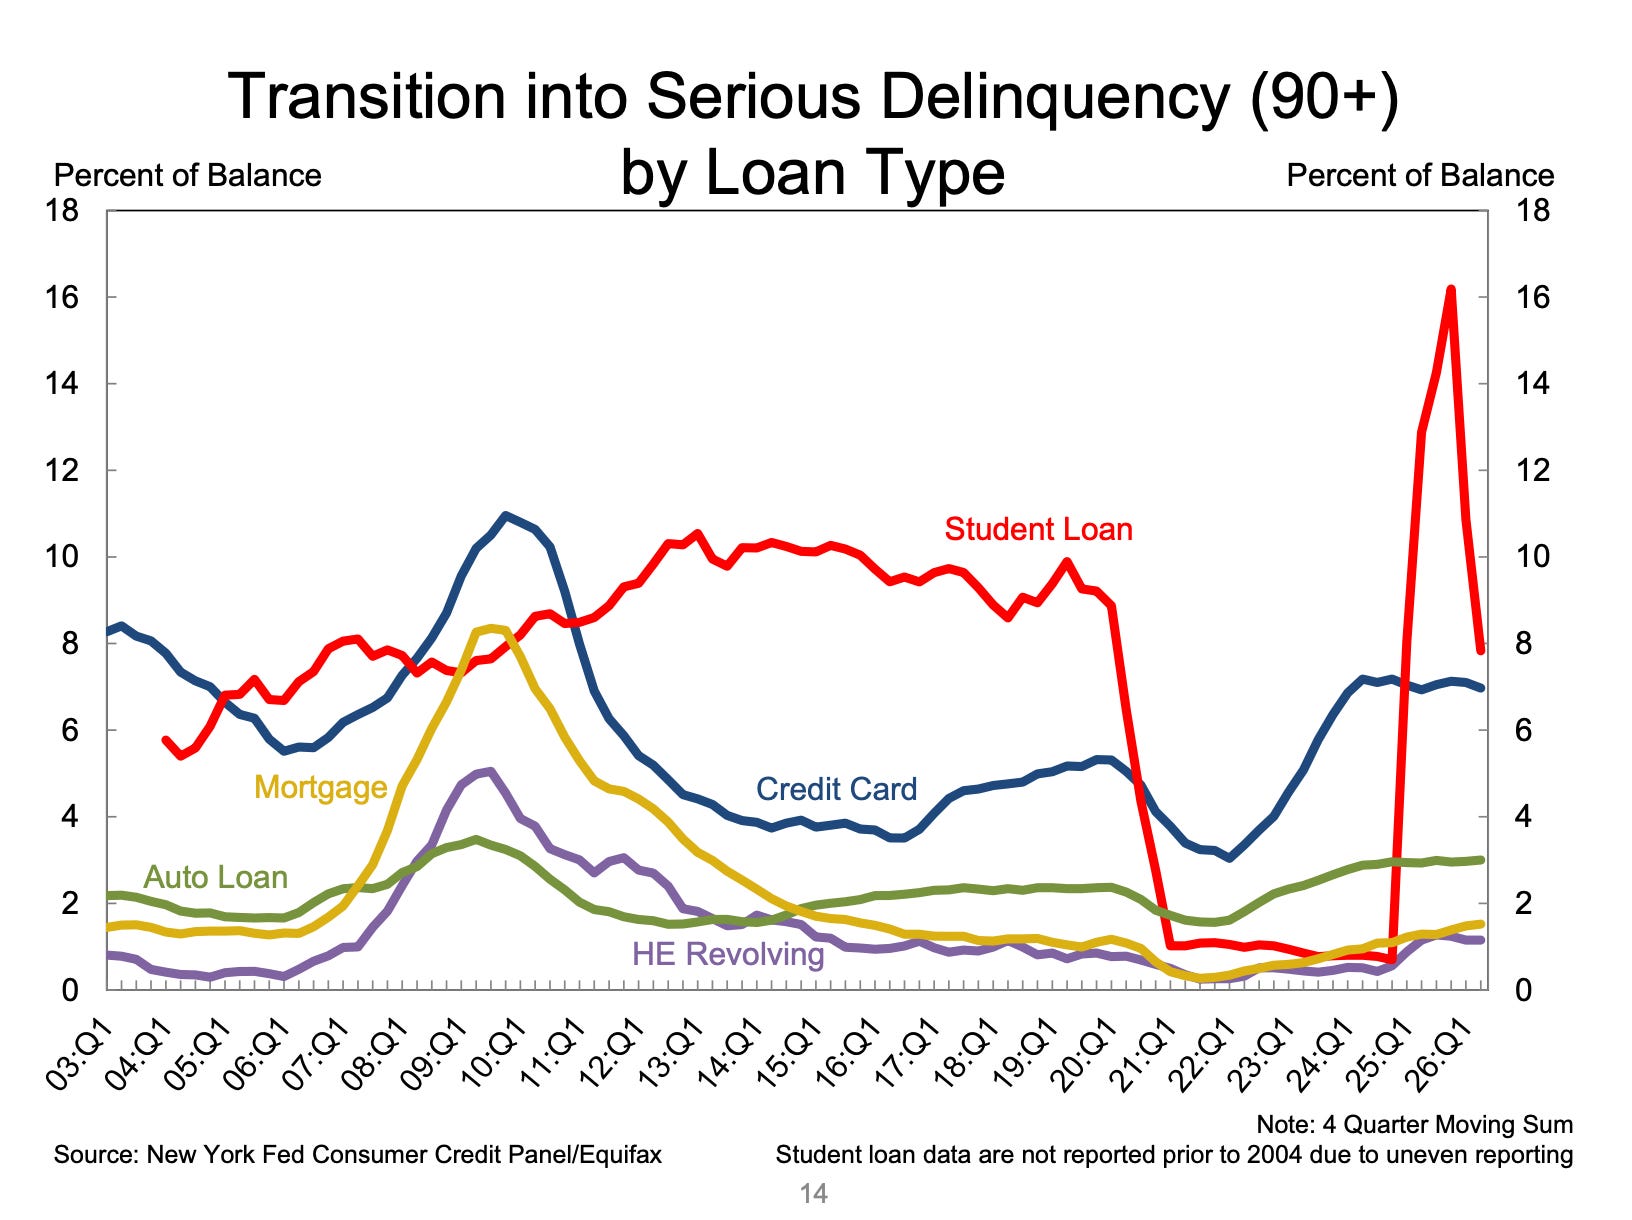
“Transition rates into serious delinquency remained mostly unchanged. Student loan delinquencies were an exception, with the continued impact of the re-reporting of defaulted student debt causing some distortions.“
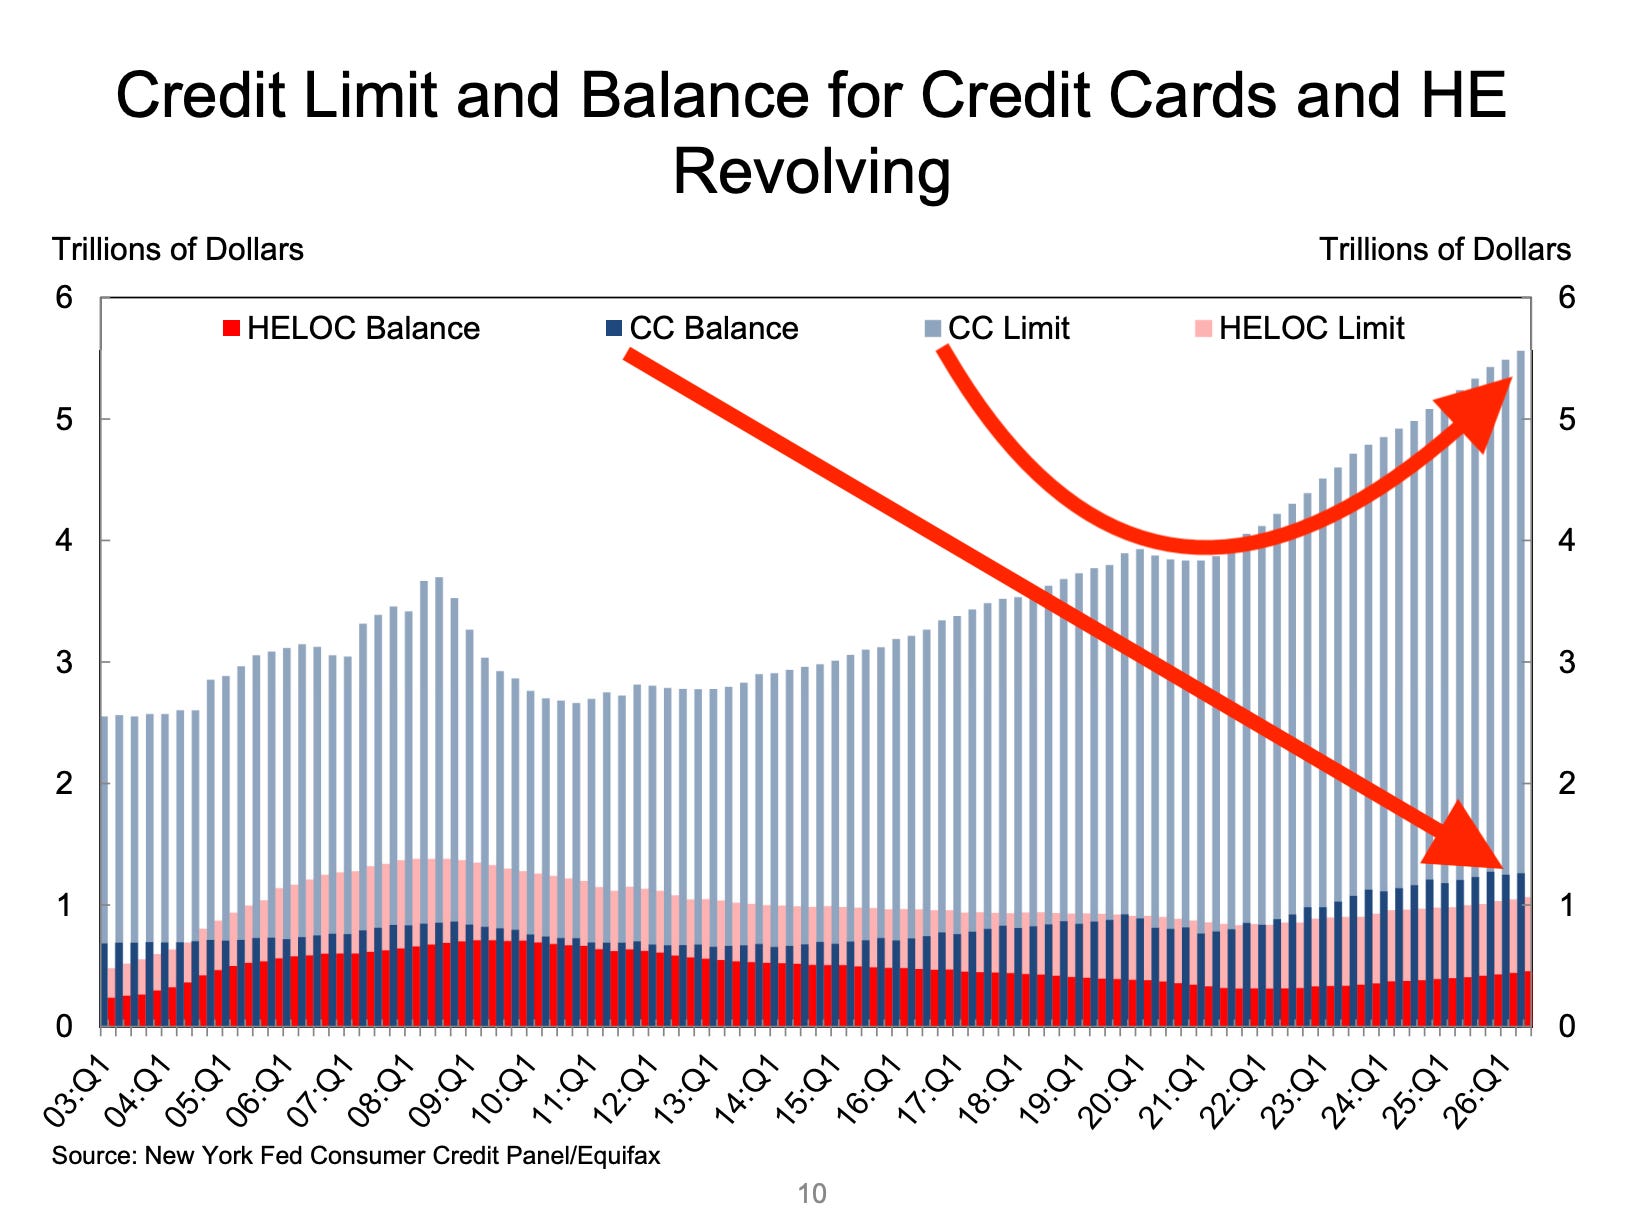
And while credit card debt balances often steal headlines, it’s a mistake to suggest consumers are maxing out their credit cards. The $1.26 trillion in credit card balances as of Q2 represents just a tiny fraction of credit card limits.
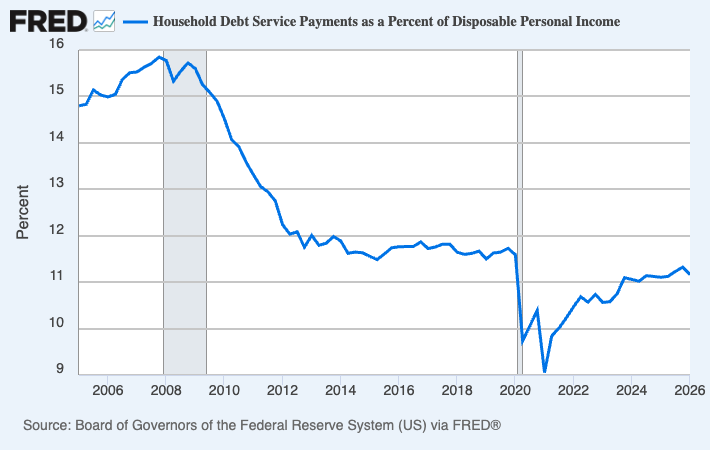
One popular way to look at debt relative to income is household debt service payments as a percent of disposable income. This is a metric that has been deteriorating since 2021. But relative to history, it remains pretty strong.
For more on household finances, read: Economic data can often be both ‘worse’ and ‘good’ 🌦️
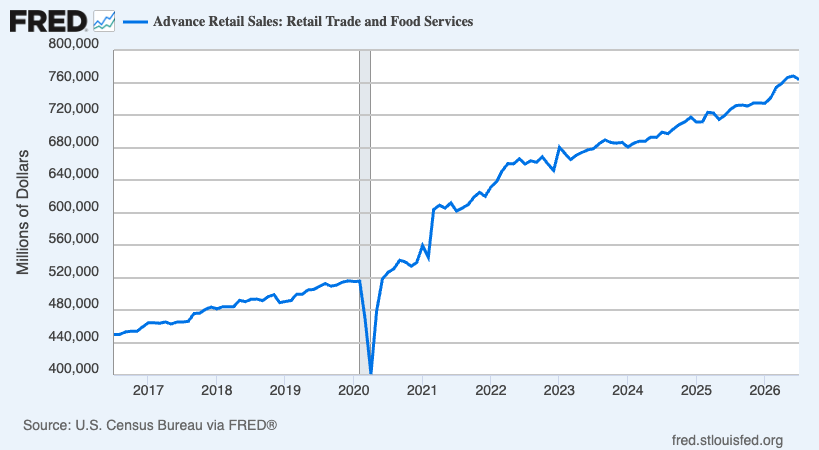
🛍️ Retail shopping activity ticked down from record levels. Retail sales in July declined 0.6% to $763.6 billion.
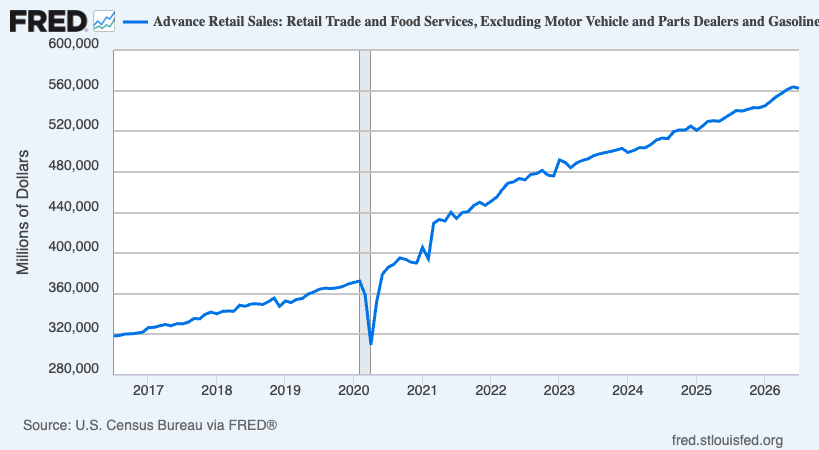
Excluding autos and gas, which tend to be volatile in the short term, retail sales declined 0.2%.
Here’s a look at the change in retail sales by category.
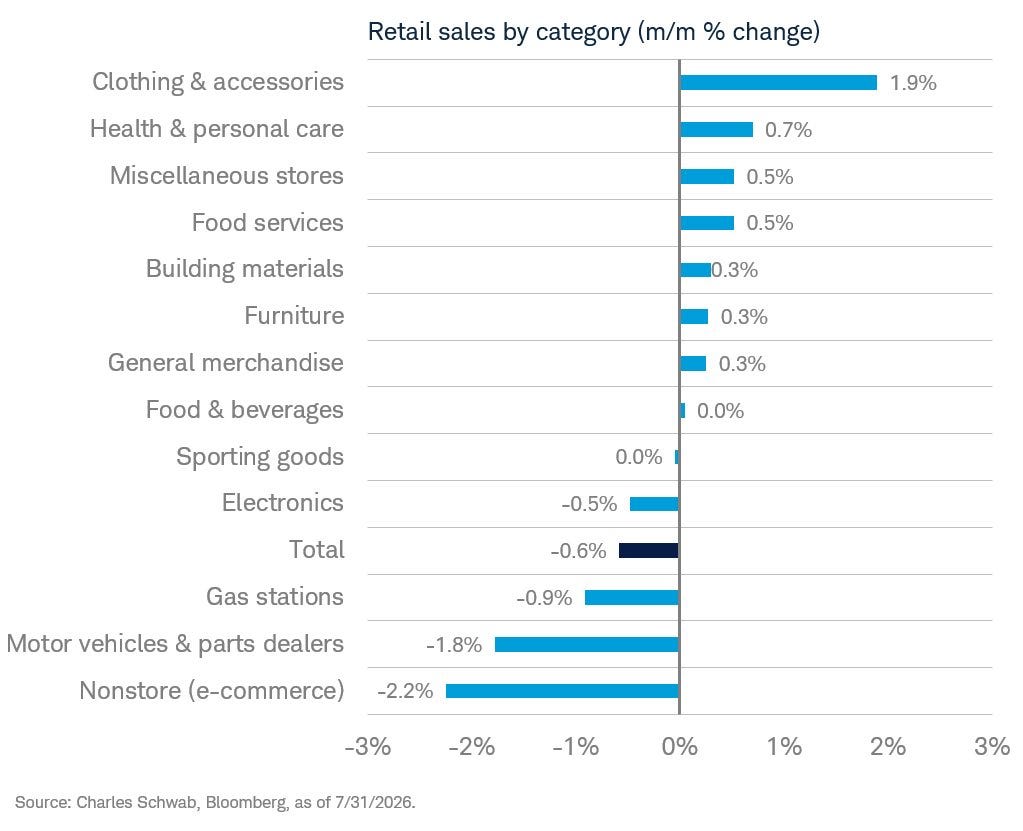
Weakness was driven by a 2.2% drop in online retail. Renaissance Macro’s Neil Dutta explained: “The timing of Amazon Prime Day depressed retail sales in July. Prime Day normally falls in July but happened in June this year. As a result, sales in June were juiced at July’s expense. Average out the two months, core retail sales and food services were up just 0.1% per month.“
💳 Card spending data is holding up. From BofA: “Total card spending per HH was up 6.2% y/y in the week ending Aug 8, according to BAC aggregated credit & debit card data. Many categories saw substantial increases in y/y spending growth relative to the prior week. The rebound in spending over the last three weeks is consistent with our view that the mid-July slump was just a blip.”
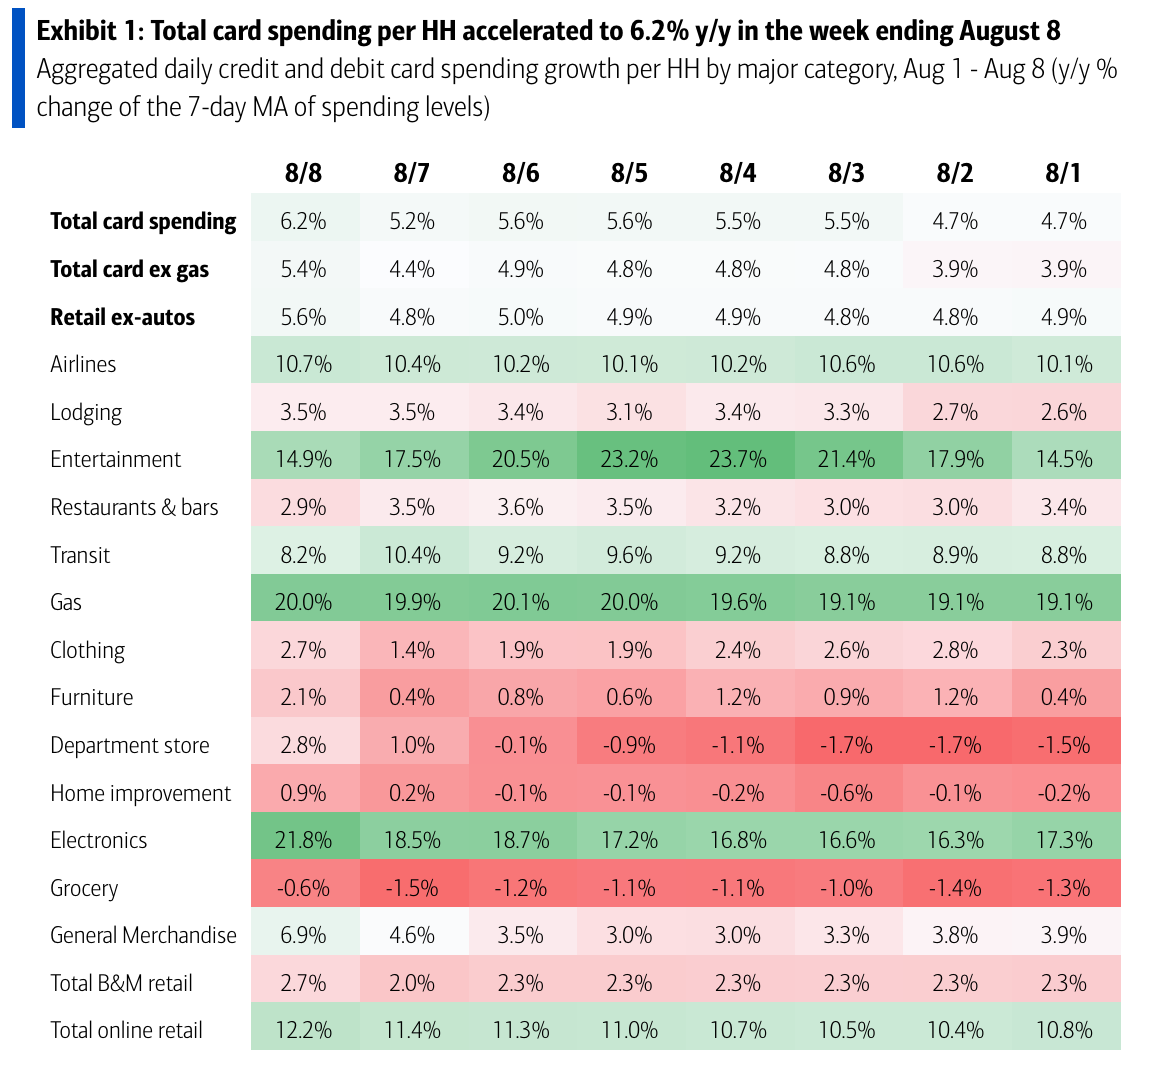
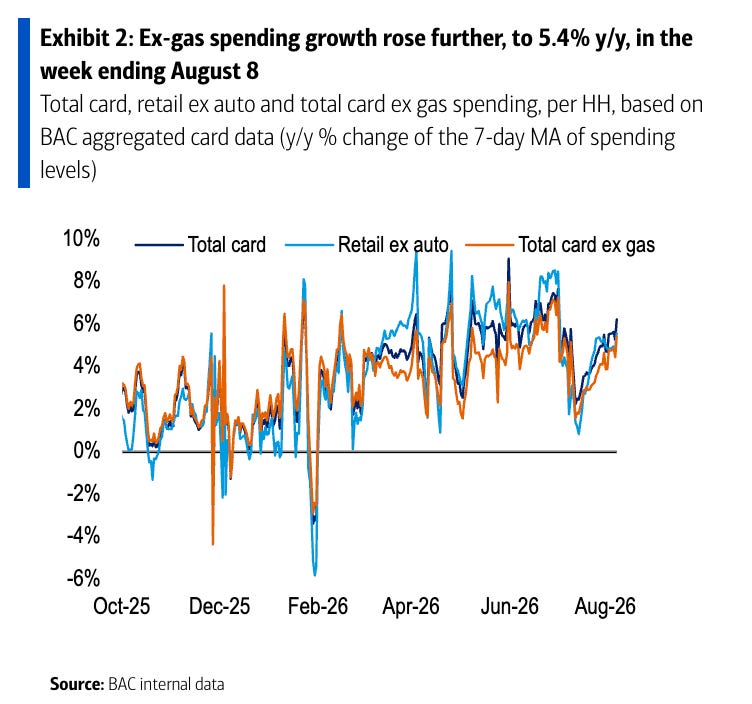
Consumer spending data has looked a lot better than consumer sentiment readings. For more on this contradiction, read: We’re taking that vacation whether we like it or not 🛫 and Household finances are both ‘worse’ and ‘good’ 🌦️
👎 Consumer vibes are in the dumps. From the University of Michigan’s August Surveys of Consumers: “Consumer sentiment fell about 8% this August, ending two consecutive months of improvement. While views of personal finances saw only minor declines, expected business conditions sank 11% for the short run and 17% for the long run. Decreases in sentiment were seen across the political spectrum, with Republicans exhibiting the strongest month-to-month decline in August. Sentiment among Republicans is now 19% below readings just prior to the Iran conflict and the lowest since the 2024 election. Although the early-month weakening in sentiment was pervasive across various demographic groups, notably large reductions were seen among older consumers, lower-income consumers, and those without a college degree. These groups are all particularly vulnerable to any erosion of purchasing power stemming from inflation.”
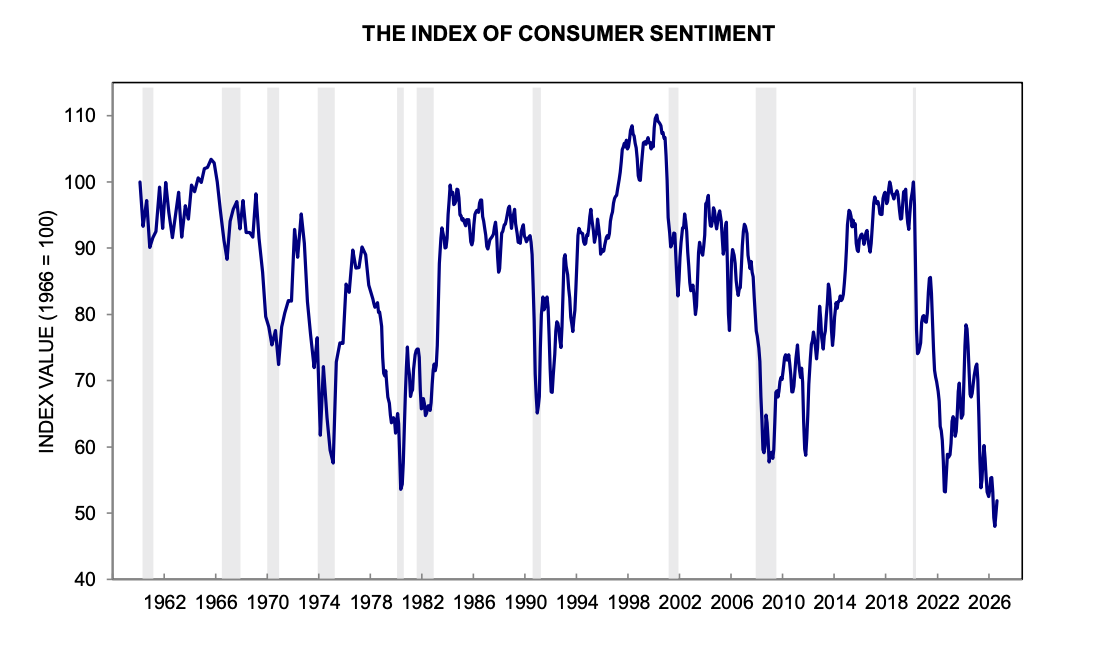
For more on consumer sentiment, read: What consumers do > what consumers say 🙊
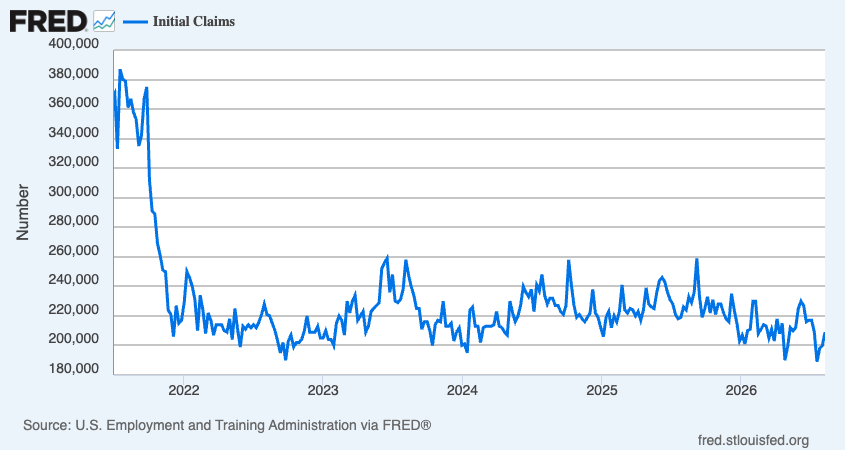
💼 New unemployment insurance claims, total ongoing claims remain low. Initial claims for unemployment benefits rose to 209,000 during the week ending Aug. 8, up from 200,000 the week prior. This metric remains at levels historically associated with economic growth.
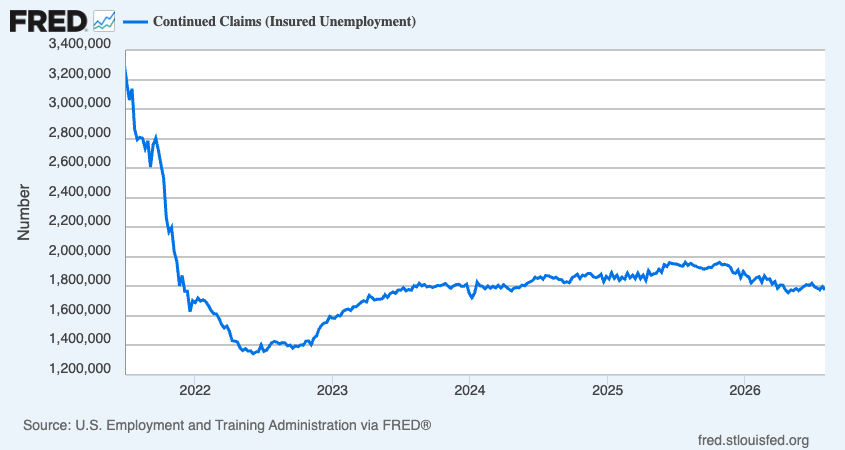
Insured unemployment, which captures those who continue to claim unemployment benefits, ticked down to 1.777 million during the week ending Aug. 1.
For more on the labor market, read: Why mass tech layoffs have little effect on total employment 💾
🎈Consumer price inflation cooled as gas prices fell. The Consumer Price Index (CPI) increased 3.4% year-over-year in July, down from 3.5% the month prior, as energy prices declined. Adjusted for food and energy prices, core CPI was up 2.5%.
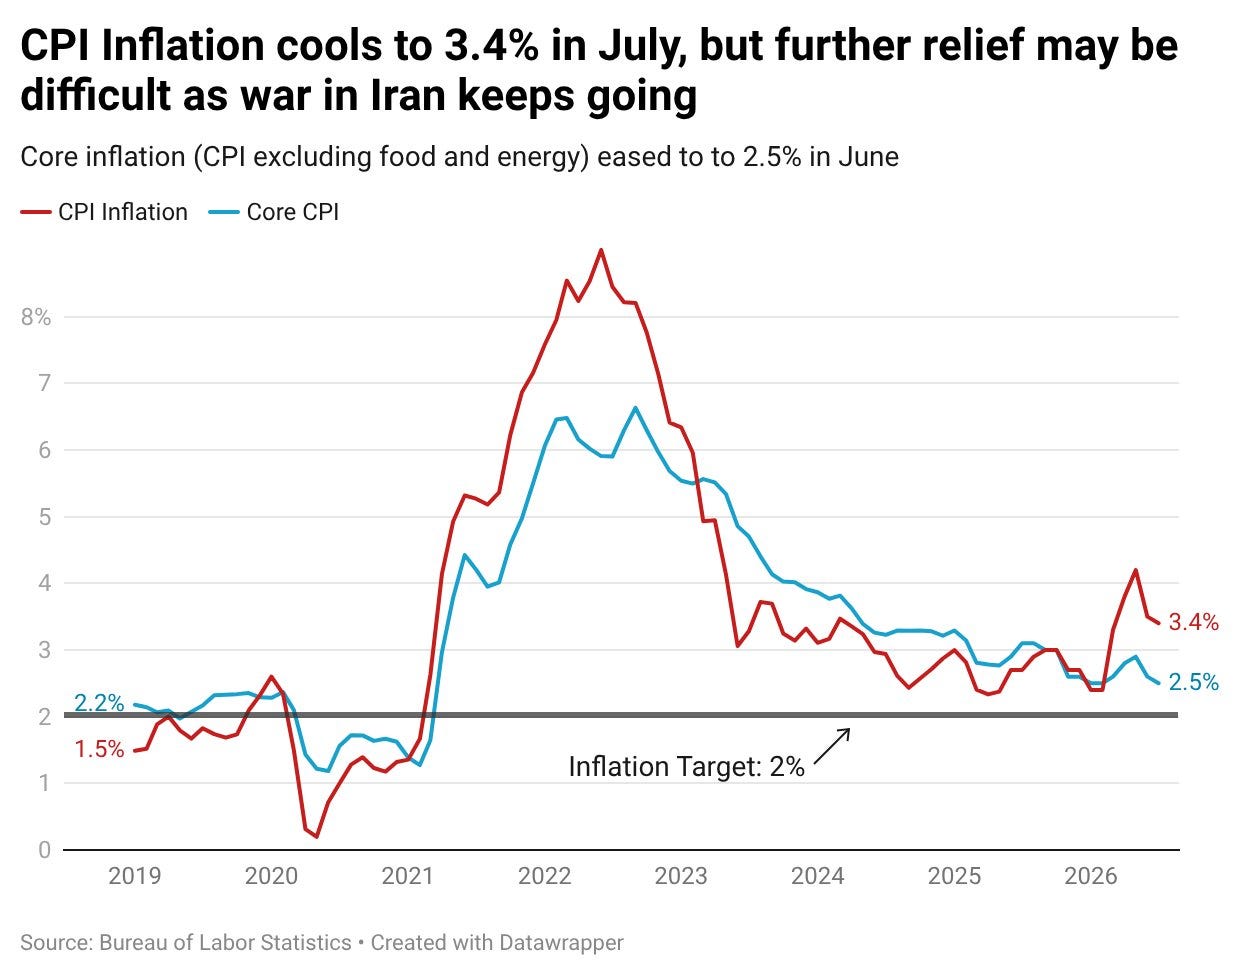
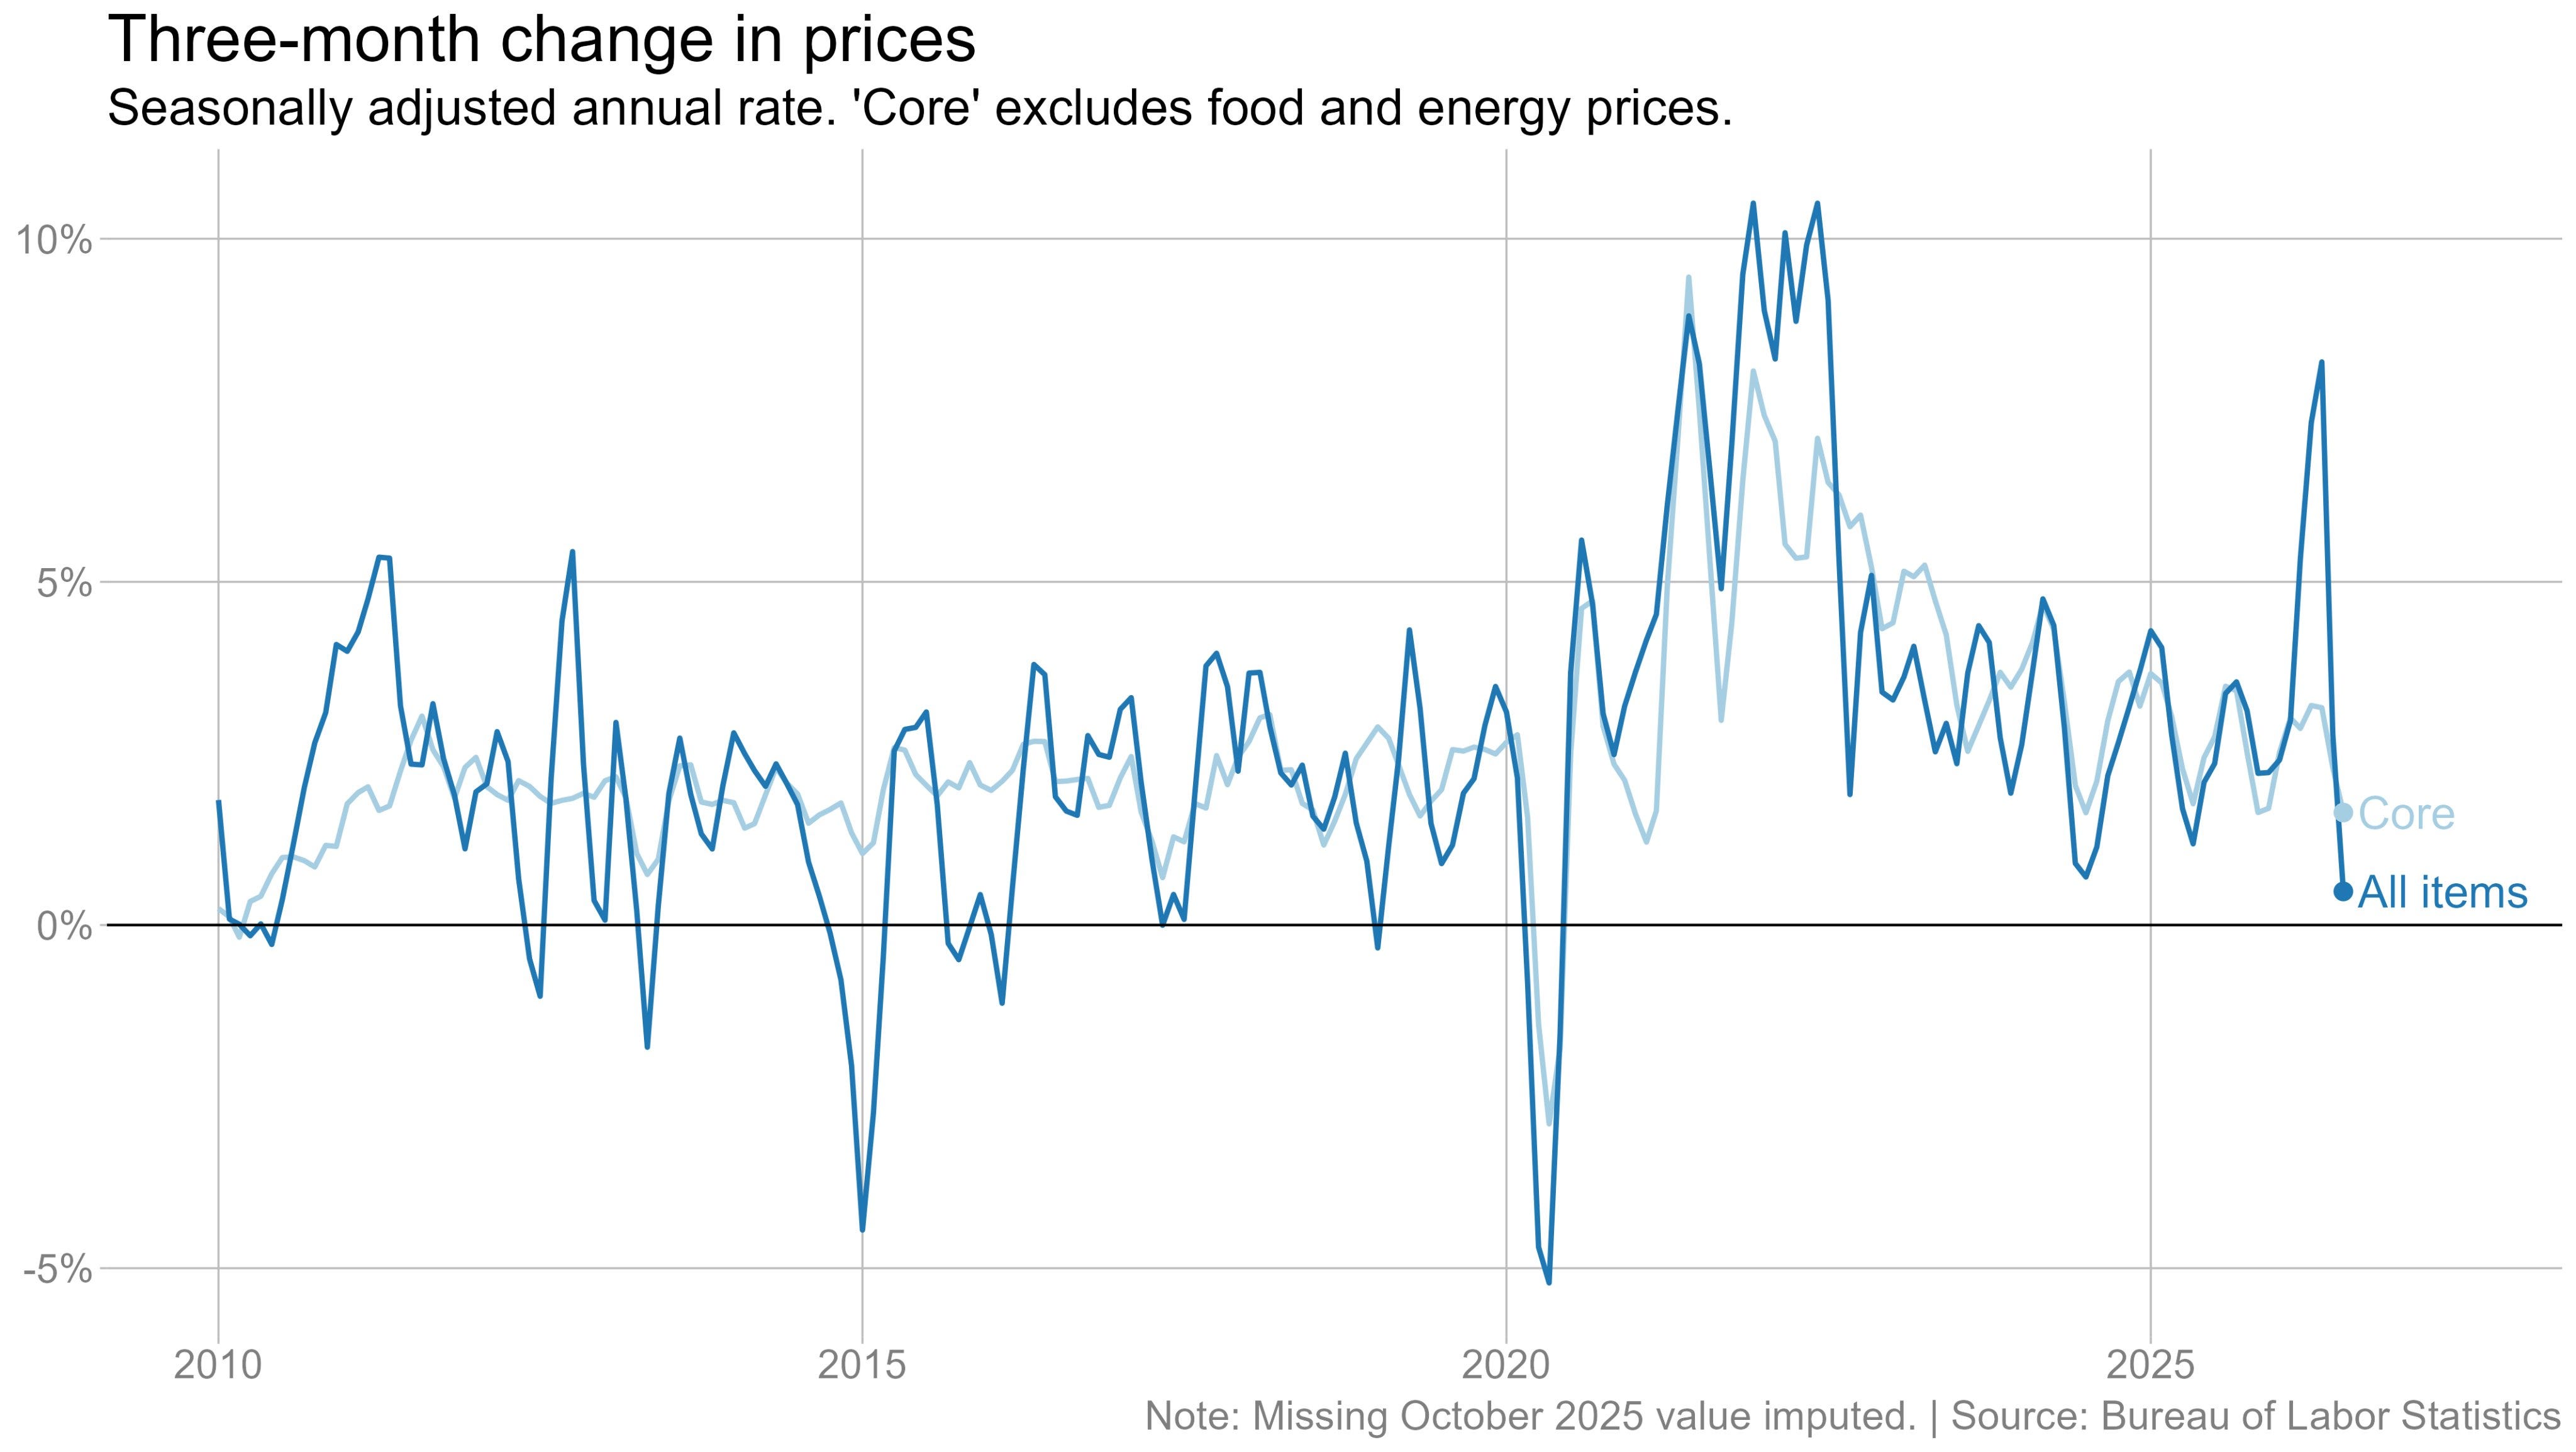
On a month-over-month basis, CPI increased 0.1% as energy prices fell 1.5%. Core CPI was up 0.2%. If you annualize the three-month figures — a reflection of the short-term trend in prices — core CPI climbed 1.6%.
For more discussion on inflation and monetary policy, read: The other side of the Fed’s inflation ‘mistake’ 🧐 and ‘When will the Fed cut rates?’ is not the right question for investors right now ✂️
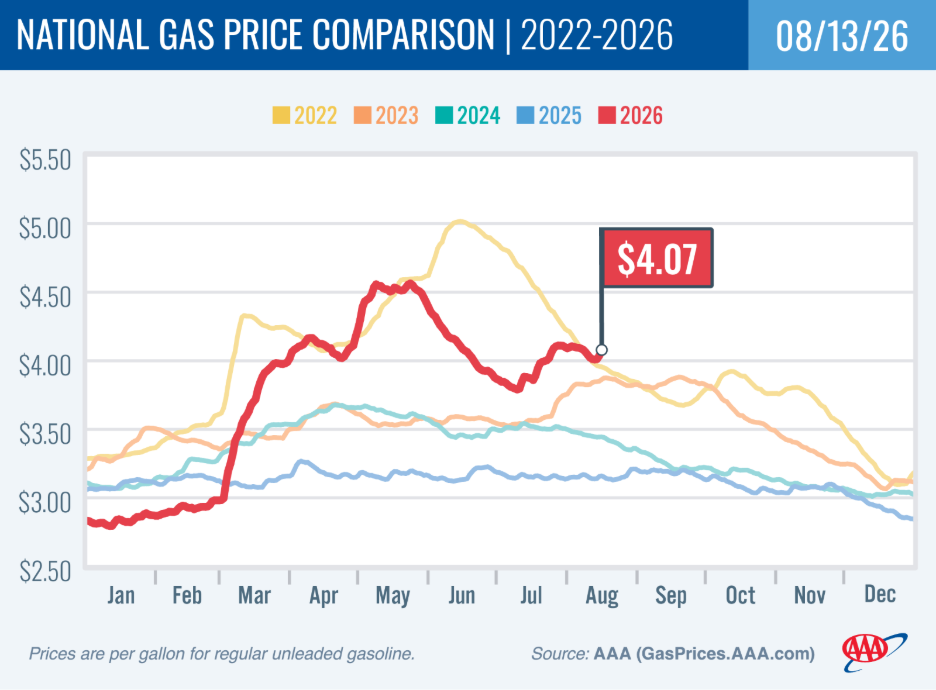
⛽️ Gas prices tick higher. From AAA: “Today’s national average is back up to $4.07 after dropping to $4.00 on Monday. Crude oil prices are once again in the $80 per barrel range amid continued uncertainty along the Strait of Hormuz. While gasoline demand is down, crude oil prices are keeping pump prices higher than normal for this time of year. So far, this is the highest August on record when it comes to the national gasoline average.”
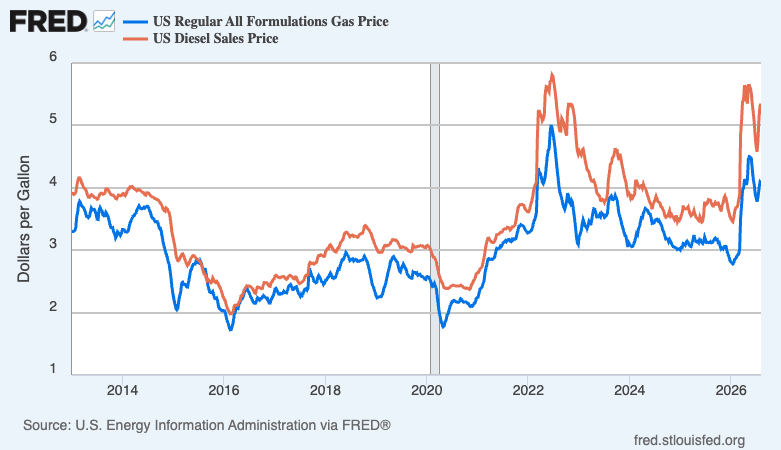
Here’s a longer-term look at the trajectory of gas and diesel prices, as tracked by the EIA.
For more on energy prices, read: Our love-hate relationship with rising oil prices in charts 💔🛢️📊
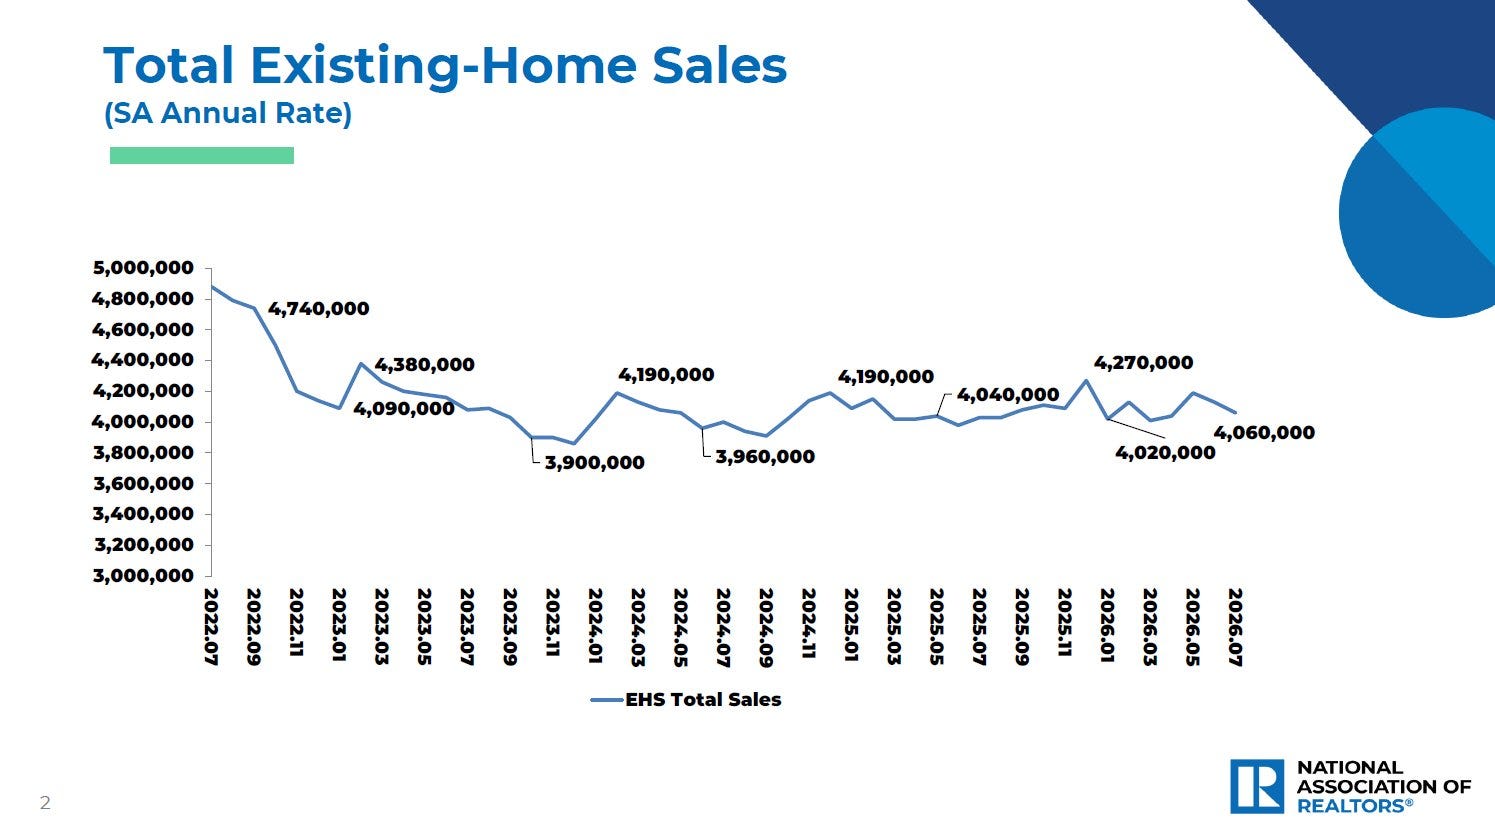
🏚 Home sales declined. Sales of previously owned homes fell 1.7% in July to an annualized rate of 4.06 million units. From NAR chief economist Lawrence Yun: “Home sales have been remarkably stable, even amid the rising mortgage rate environment of the past few months. Year-to-date sales are up 2.4% and there’s no doubt that the housing market would be thriving if average mortgage rates were to return near 6%.”
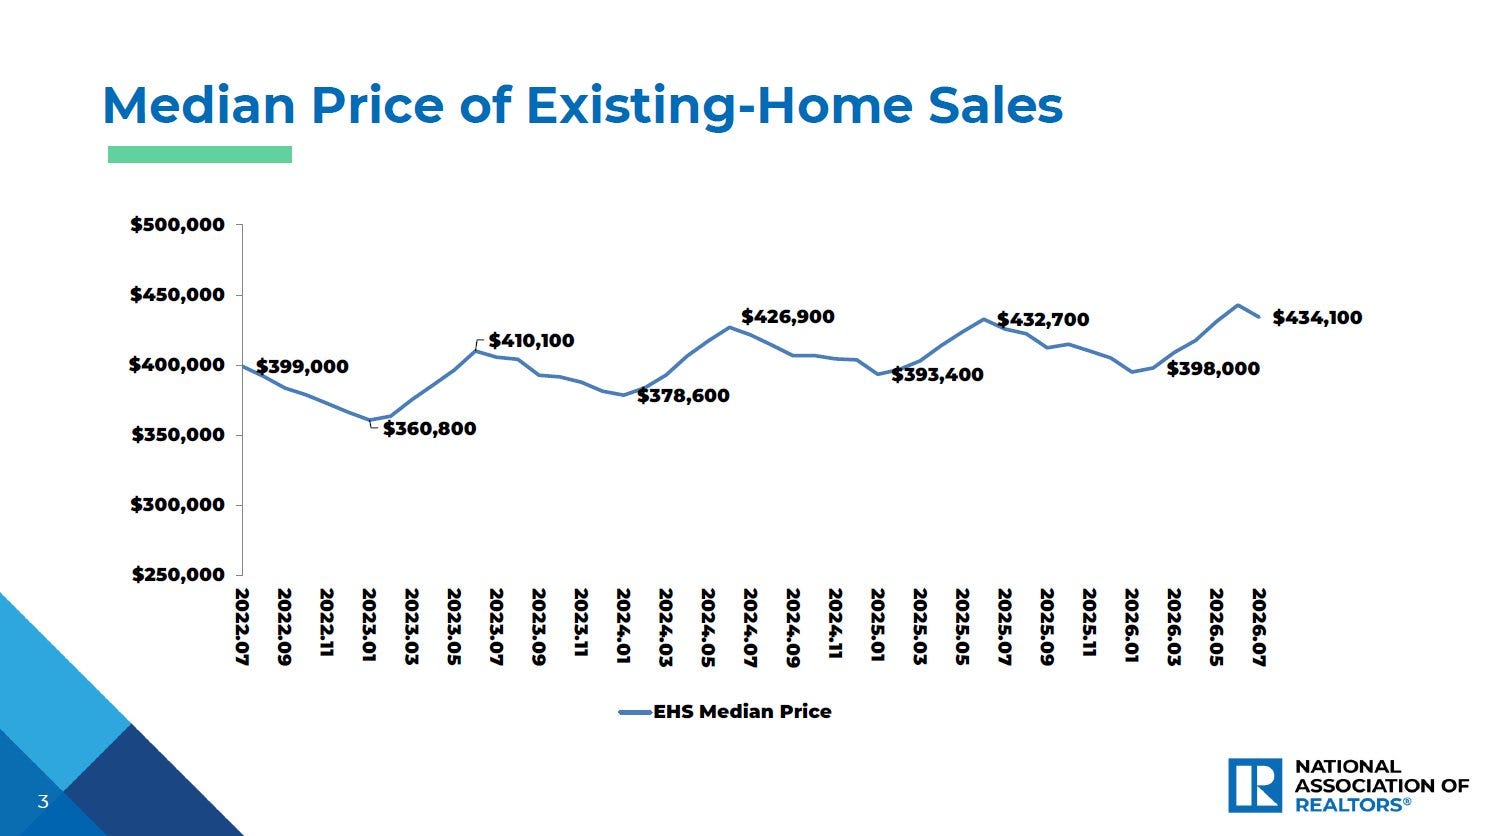
Prices for previously owned homes declined from last month, but rose from year-ago levels. From the NAR: “The median existing-home sales price for all housing types in July was $434,100, up 2.0% from one year ago ($425,700) – the 37th consecutive month of year-over-year price increases.”
🏠 Mortgage rates tick lower. According to Freddie Mac, the average 30-year fixed-rate mortgage declined to 6.67%, down from 6.69% last week. From Freddie Mac: “Housing affordability has improved from a year ago, and recent increases in purchase and refinance applications suggest that borrowers continue to respond to even modest changes in mortgage rates.”
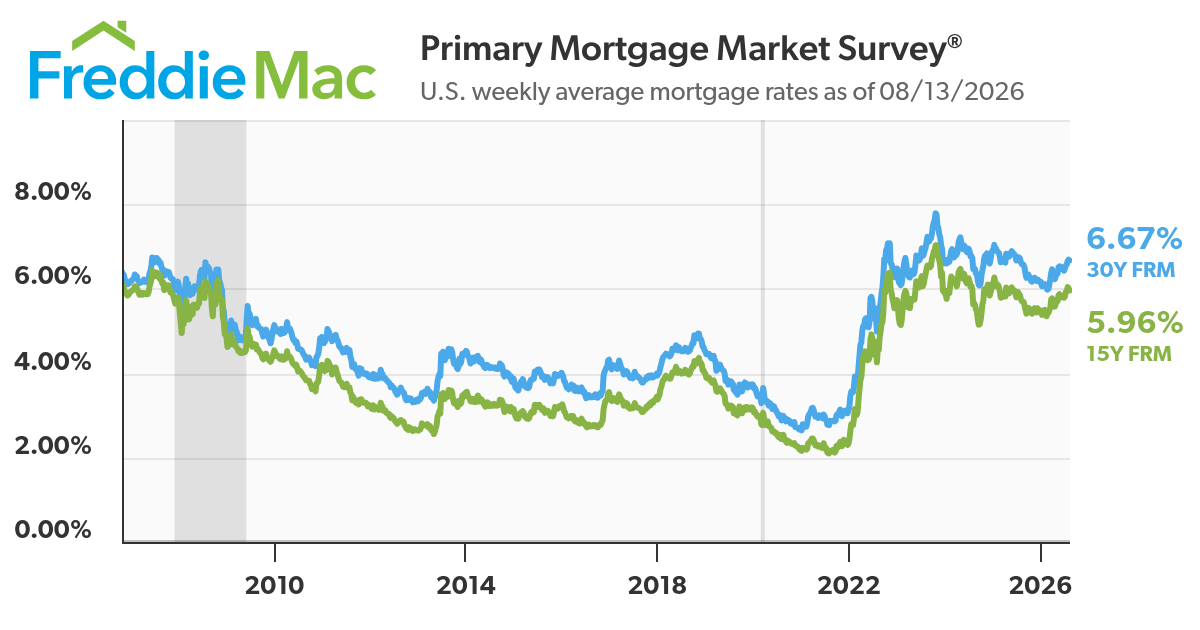
As of Q2, there were 149.5 million housing units in the U.S., of which 87.0 million were owner-occupied and about 40% were mortgage-free. Of those carrying mortgage debt, almost all have fixed-rate mortgages, and most of those mortgages have rates that were locked in before rates surged from 2021 lows. All of this is to say: Most homeowners are not particularly sensitive to the weekly movements in home prices or mortgage rates.
For more on mortgages and home prices, read: Why home prices and rents are creating all sorts of confusion about inflation 😖
👍 Small business optimism improves. The NFIB’s Small Business Optimism Index rose to 99.8 in July from 97.4 in June. From the NFIB: “Small business optimism rose again in July, with a significant increase in owners expecting to hire, accompanied by an improvement in plans to make capital expenditures. Although uncertainty is currently elevated, Main Street anticipates that business conditions will continue to improve.”
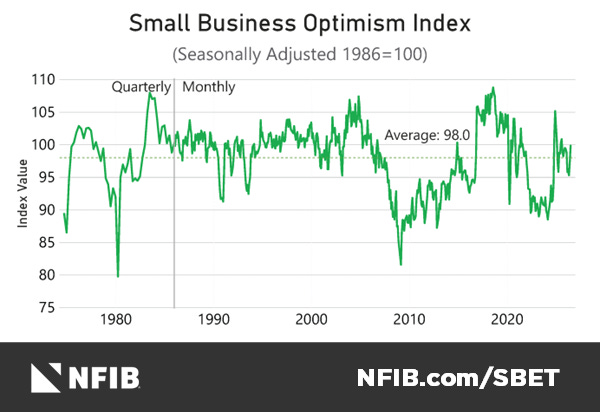
Keep in mind that during times of perceived stress, soft survey data tends to be more exaggerated than actual hard data.
For more on this, read: What businesses do > what businesses say 🙊 and 4 sometimes-conflicting ways I’m thinking about the economy 😬😞😎🙃
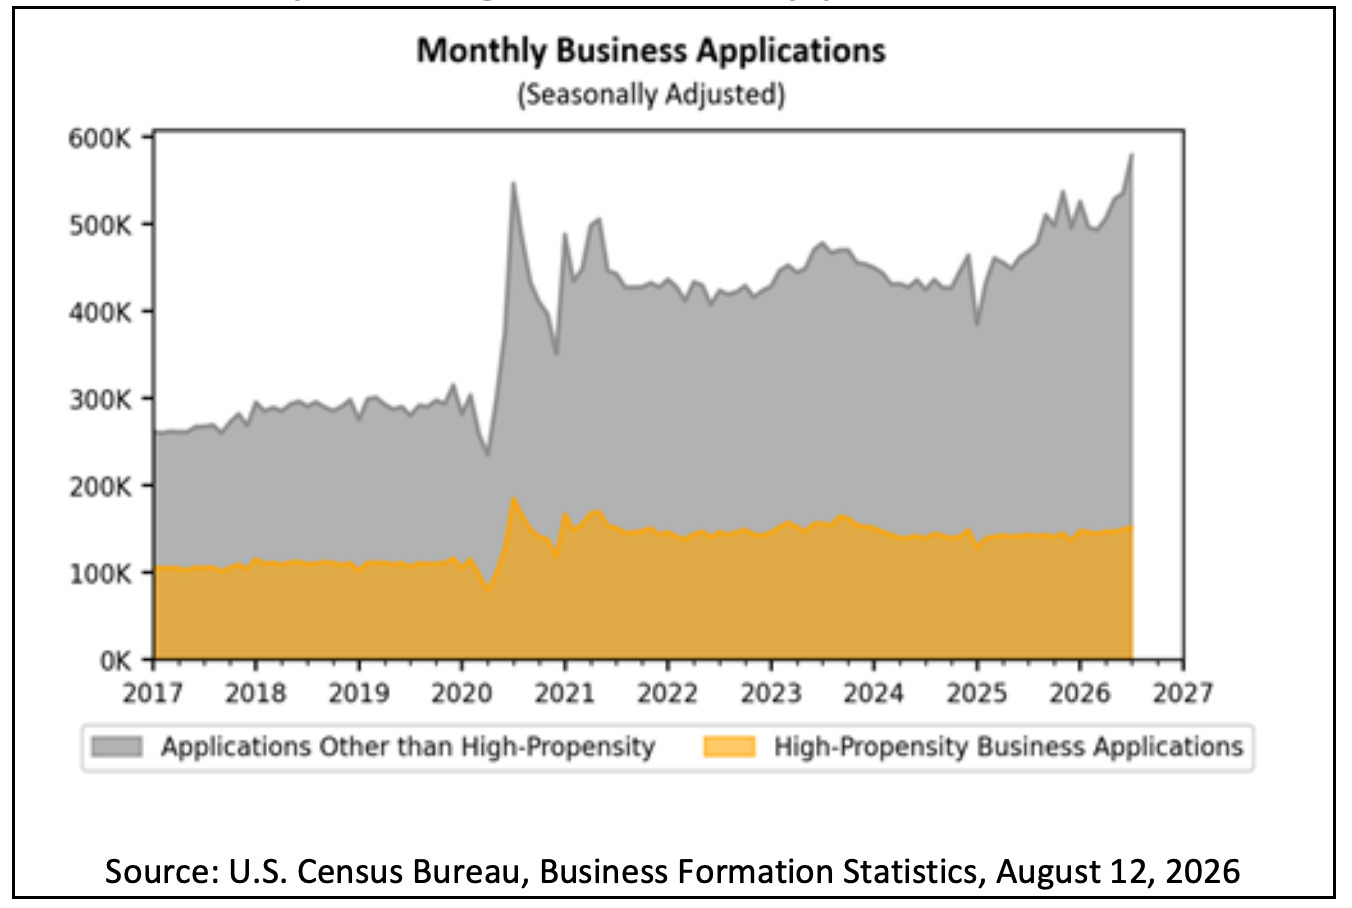
🍾 The entrepreneurial spirit remains elevated. From the Census Bureau: “Total U.S. Business Applications were 578,926 in July 2026, up 8.1% from June 2026.“
🏢 Offices remain relatively empty. From Kastle Systems: “The Kastle 10-City Back to Work Barometer reported a national average occupancy of 54.4%, down 1.2 points from the prior week’s 55.6%. Even in the midst of summer vacation season, 54.4% is only 2.5 points below the highest weekly average reported since January 2024, which was 56.9% nationally in March of this year.”
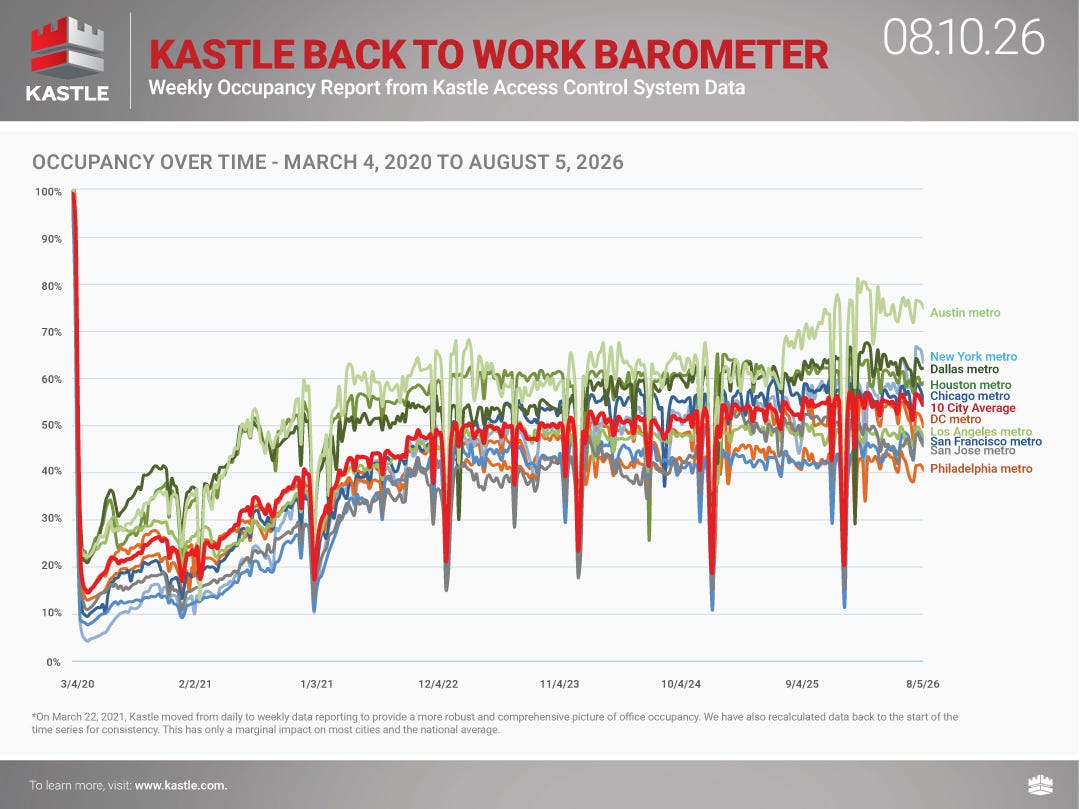
For more on office occupancy, read: This stat about offices reminds us things are far from normal 🏢
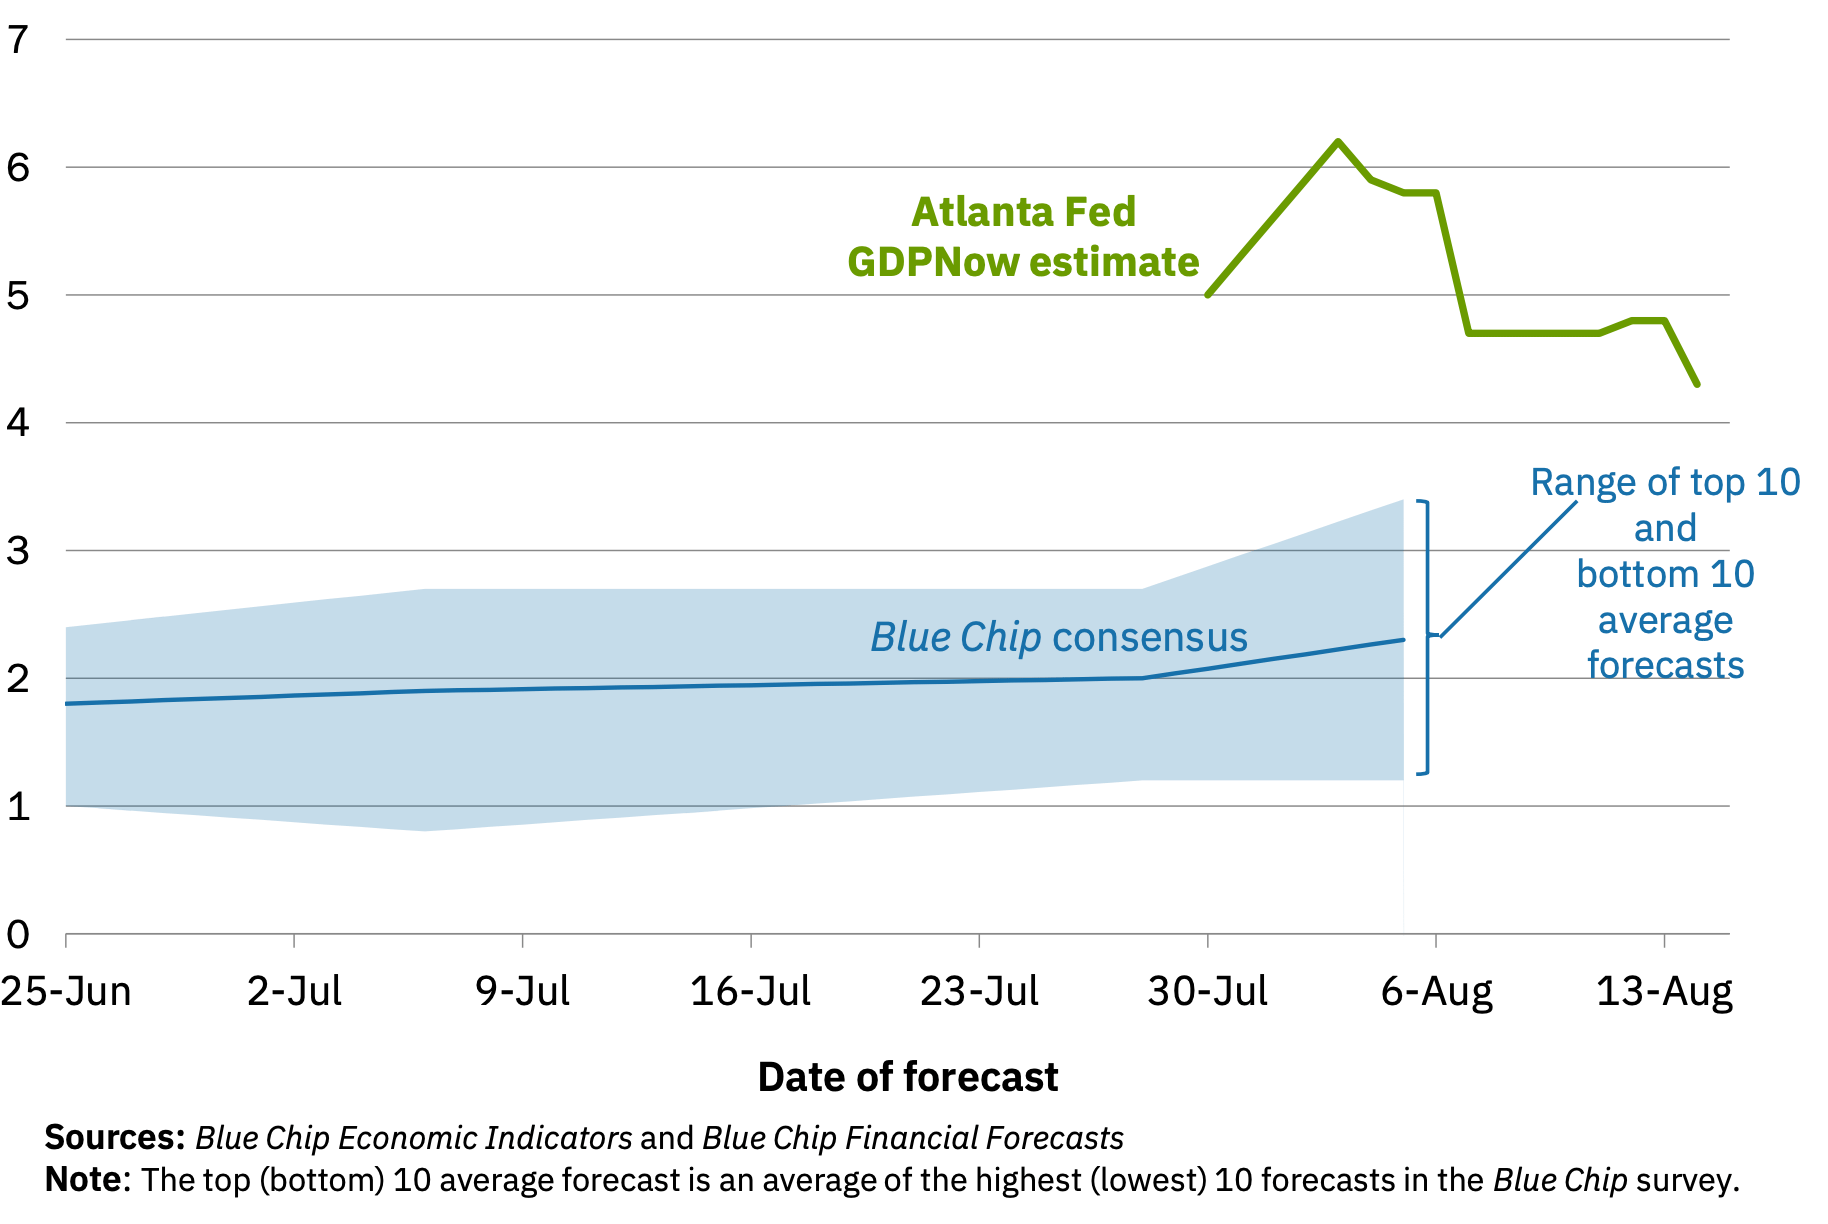
📈 Near-term GDP growth estimates are tracking positively. The Atlanta Fed’s GDPNow model sees real GDP growth rising at a 4.3% rate in Q3.
For more on GDP and the economy, read: It’s too ambiguous to just say ‘the economy’ 🤦🏻♂️ and Economic data can often be both ‘worse’ and ‘good’ 🌦️
Putting it all together 📋
Earnings look bullish: The long-term outlook for the stock market remains favorable, bolstered by expectations for years of earnings growth. And earnings are the most important driver of stock prices.
Demand is positive: Demand for goods and services remains positive, supported by healthy consumer and business balance sheets. Personal spending activity remains at record levels. Core capex orders, which are a leading indicator of business spending, have been trending higher.
Growth rates have cooled: While the economy remains healthy, growth has normalized from much hotter levels earlier in the cycle. The economy is less “coiled” these days as major tailwinds like job openings and excess savings have faded. Job creation, while positive, is not as hot as it used to be. It has become harder to argue that growth is destiny.
Actions speak louder than words: We are in an odd period, given that the hard economic data decoupled from the soft sentiment-oriented data. Consumer and business sentiment has been relatively poor, even as tangible consumer and business activity continues to grow and trend at record levels. From an investor’s perspective, what matters is that the hard economic data continues to hold up.
Stocks are not the economy: There’s a case to be made that the U.S. stock market could outperform the U.S. economy in the near term, thanks largely to positive operating leverage. Since the pandemic, companies have aggressively adjusted their cost structures. This came with strategic layoffs and investment in new equipment, including hardware powered by AI. These moves are resulting in positive operating leverage, which means a modest amount of sales growth — in the cooling economy — is translating to robust earnings growth.
Mind the ever-present risks: Of course, we should not get complacent. There will always be risks to worry about, such as U.S. political uncertainty, geopolitical turmoil, energy price volatility, and cyber attacks. There are also the dreaded unknowns. Any of these risks can flare up and spark short-term volatility in the markets.
Investing is never a smooth ride: There’s also the harsh reality that economic recessions and bear markets are developments that all long-term investors should expect as they build wealth in the markets. Always keep your stock market seat belts fastened.
Think long-term: For now, there’s no reason to believe there’ll be a challenge that the economy and the markets won’t overcome. The long game remains undefeated, and it’s a streak that long-term investors can expect to continue.
For more on how the macro story is evolving, check out the previous review of the macro crosscurrents. »
Key insights about the stock market 📈
Here’s a roundup of some of TKer’s most talked-about paid and free newsletters about the stock market. All of the headlines are hyperlinked to the archived pieces.
10 truths about the stock market 📈
The stock market can be an intimidating place: It’s real money on the line, there’s an overwhelming amount of information, and people have lost fortunes in it very quickly. But it’s also a place where thoughtful investors have long accumulated a lot of wealth. The primary difference between those two outlooks is related to misconceptions about the stock market that can lead people to make poor investment decisions.
The makeup of the S&P 500 is constantly changing 🔀
Passive investing is a concept usually associated with buying and holding a fund that tracks an index. And no passive investment strategy has attracted as much attention as buying an S&P 500 index fund. However, the S&P 500 — an index of 500 of the largest U.S. companies — is anything but a static set of 500 stocks.

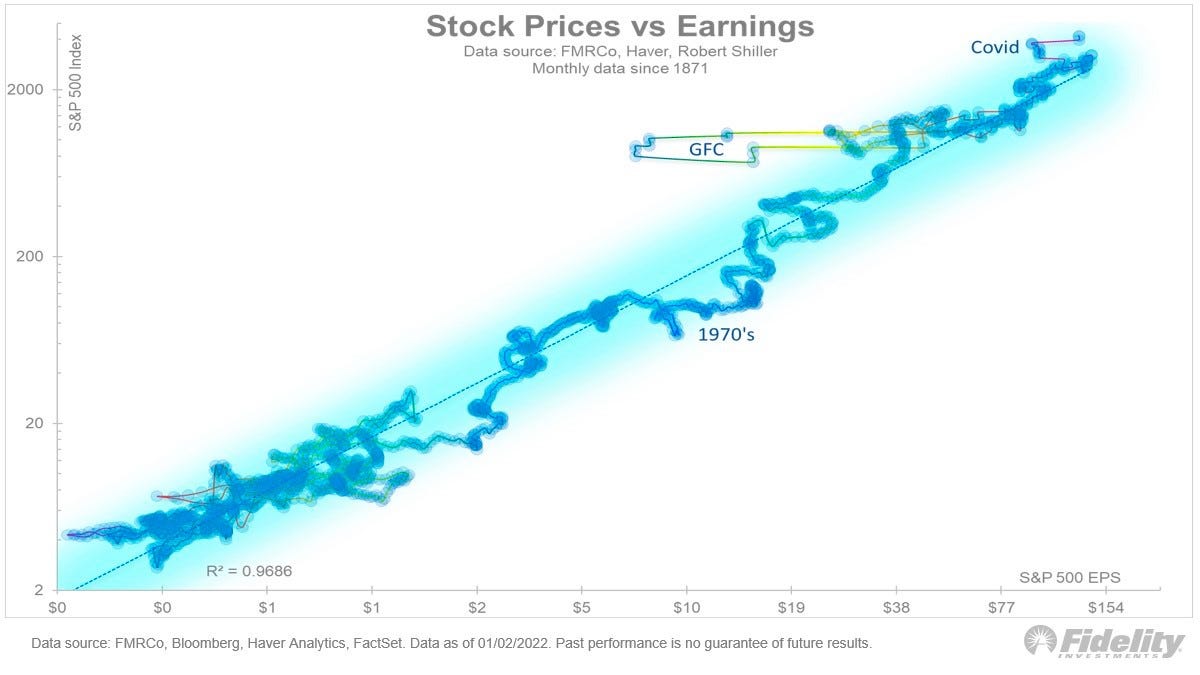
The key driver of stock prices: Earnings💰
For investors, anything you can ever learn about a company matters only if it also tells you something about earnings. That’s because long-term moves in a stock can ultimately be explained by the underlying company’s earnings, expectations for earnings, and uncertainty about those expectations for earnings. Over time, the relationship between stock prices and earnings has a very tight statistical relationship.
Stomach-churning stock market sell-offs are normal🎢
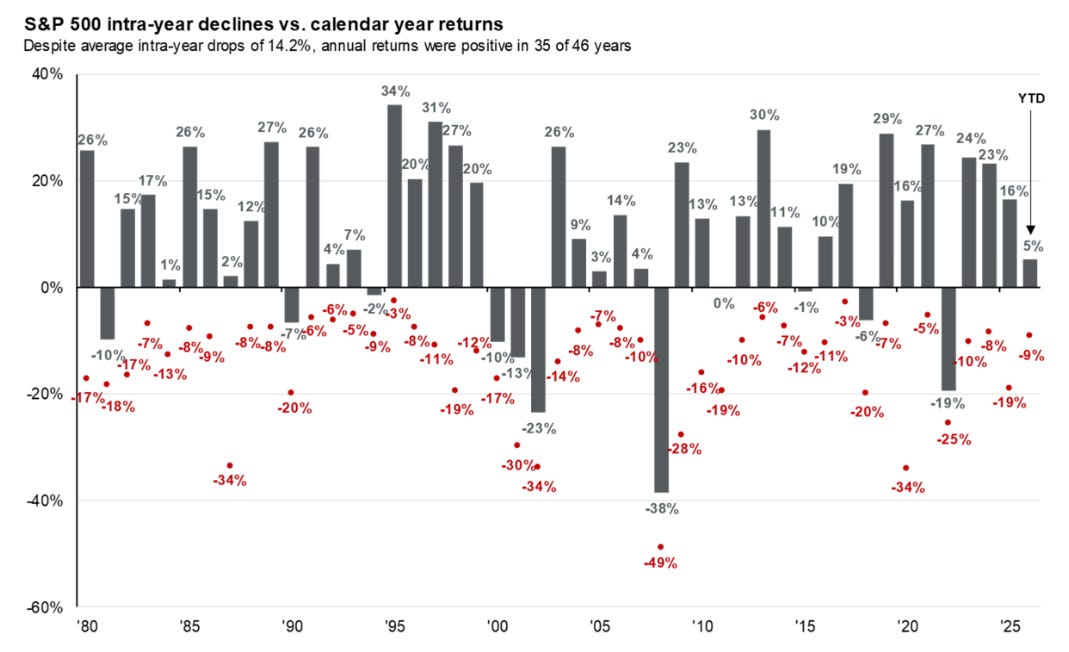
Investors should always be mentally prepared for some big sell-offs in the stock market. It’s part of the deal when you invest in an asset class that is sensitive to the constant flow of good and bad news. Since 1950, the S&P 500 has seen an average annual max drawdown (i.e., the biggest intra-year sell-off) of 14%.
How the stock market performed around recessions 📉📈
Every recession in history was different. And the range of stock performance around them varied greatly. There are two things worth noting. First, recessions have always been accompanied by a significant drawdown in stock prices. Second, the stock market bottomed and inflected upward long before recessions ended.

In the stock market, time pays ⏳
Since 1928, the S&P 500 has generated a positive total return more than 89% of the time over all five-year periods. Those are pretty good odds. When you extend the timeframe to 20 years, you’ll see that there’s never been a period where the S&P 500 didn’t generate a positive return.

What a strong dollar means for stocks 👑
While a strong dollar may be great news for Americans vacationing abroad and U.S. businesses importing goods from overseas, it’s a headwind for multinational U.S.-based corporations doing business in non-U.S. markets.

Stanley Druckenmiller’s No. 1 piece of advice for novice investors 🧐
…you don’t want to buy them when earnings are great, because what are they doing when their earnings are great? They go out and expand capacity. Three or four years later, there’s overcapacity and they’re losing money. What about when they’re losing money? Well, then they’ve stopped building capacity. So three or four years later, capacity will have shrunk and their profit margins will be way up. So, you always have to sort of imagine the world the way it’s going to be in 18 to 24 months as opposed to now. If you buy it now, you’re buying into every single fad every single moment. Whereas if you envision the future, you’re trying to imagine how that might be reflected differently in security prices.
Peter Lynch made a remarkably prescient market observation in 1994 🎯
Some event will come out of left field, and the market will go down, or the market will go up. Volatility will occur. Markets will continue to have these ups and downs. … Basic corporate profits have grown about 8% a year historically. So, corporate profits double about every nine years. The stock market ought to double about every nine years… The next 500 points, the next 600 points — I don’t know which way they’ll go… They’ll double again in eight or nine years after that. Because profits go up 8% a year, and stocks will follow. That’s all there is to it.
Warren Buffett’s ‘fourth law of motion’ 📉
Long ago, Sir Isaac Newton gave us three laws of motion, which were the work of genius. But Sir Isaac’s talents didn’t extend to investing: He lost a bundle in the South Sea Bubble, explaining later, “I can calculate the movement of the stars, but not the madness of men.” If he had not been traumatized by this loss, Sir Isaac might well have gone on to discover the Fourth Law of Motion: For investors as a whole, returns decrease as motion increases.
Most pros can’t beat the market 🥊
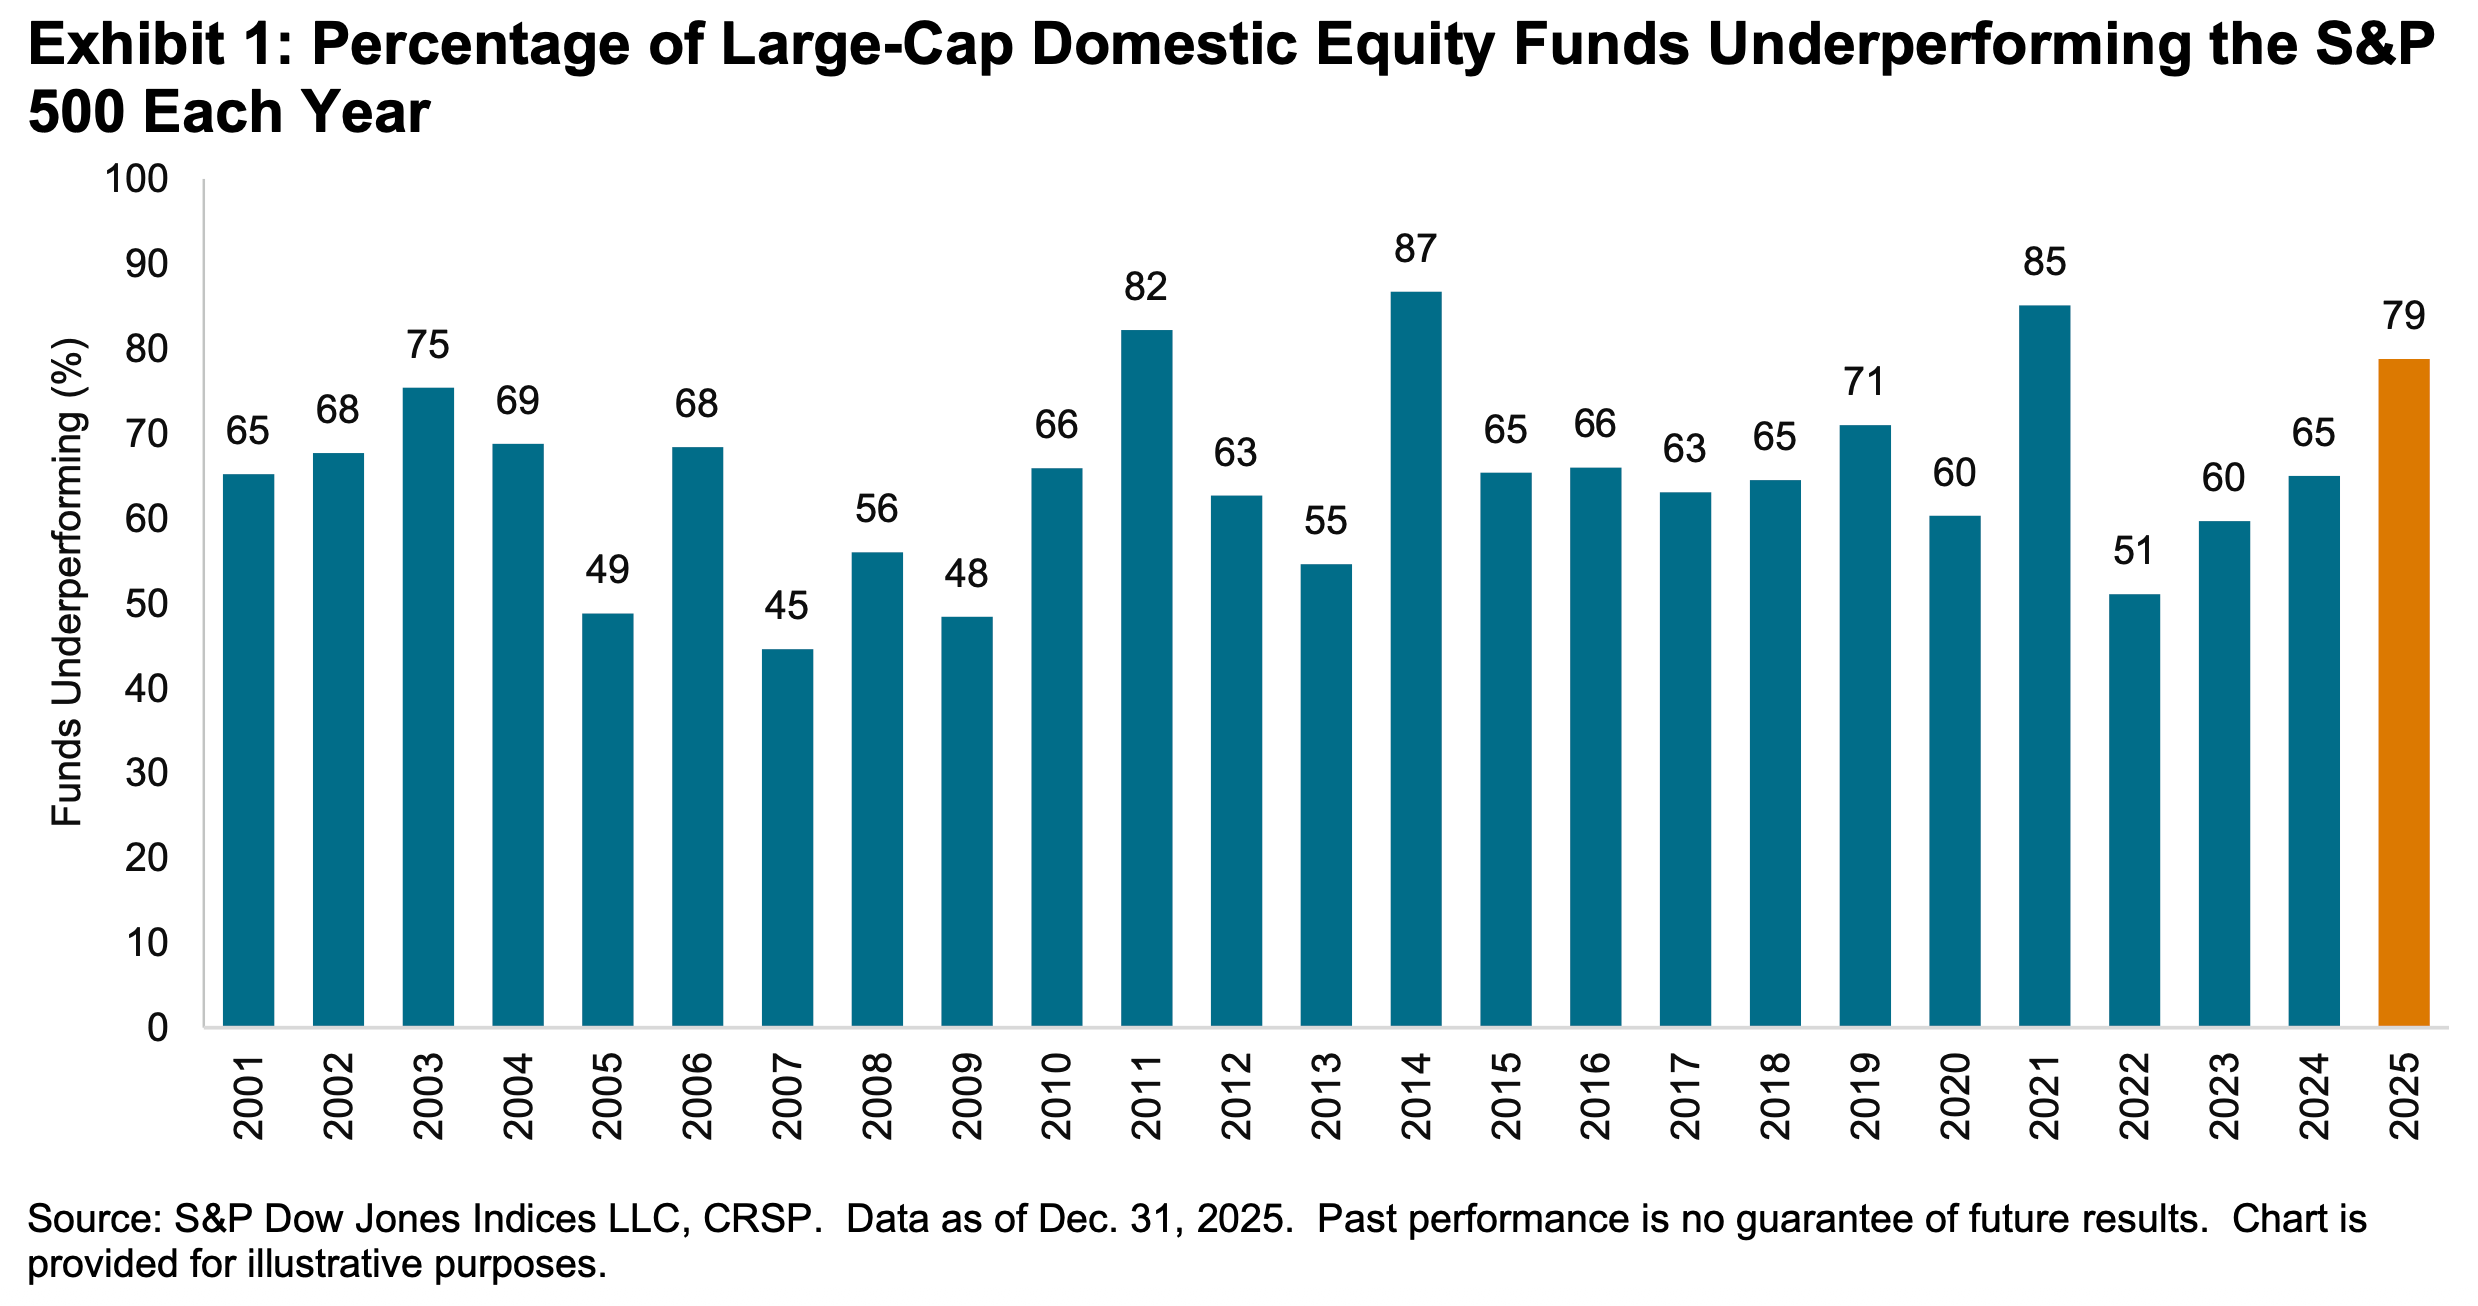
According to S&P Dow Jones Indices (SPDJI), 79% of U.S. large-cap equity fund managers underperformed the S&P 500 in 2025. As you stretch the time horizon, the numbers get even more dismal. Over three years, 67% underperformed. Over 5 years, 89% underperformed. And over 20 years, 93% underperformed. This 2025 performance was the 16th consecutive year in which the majority of fund managers in this category have lagged the index.
Proof that ‘past performance is no guarantee of future results’ 📊
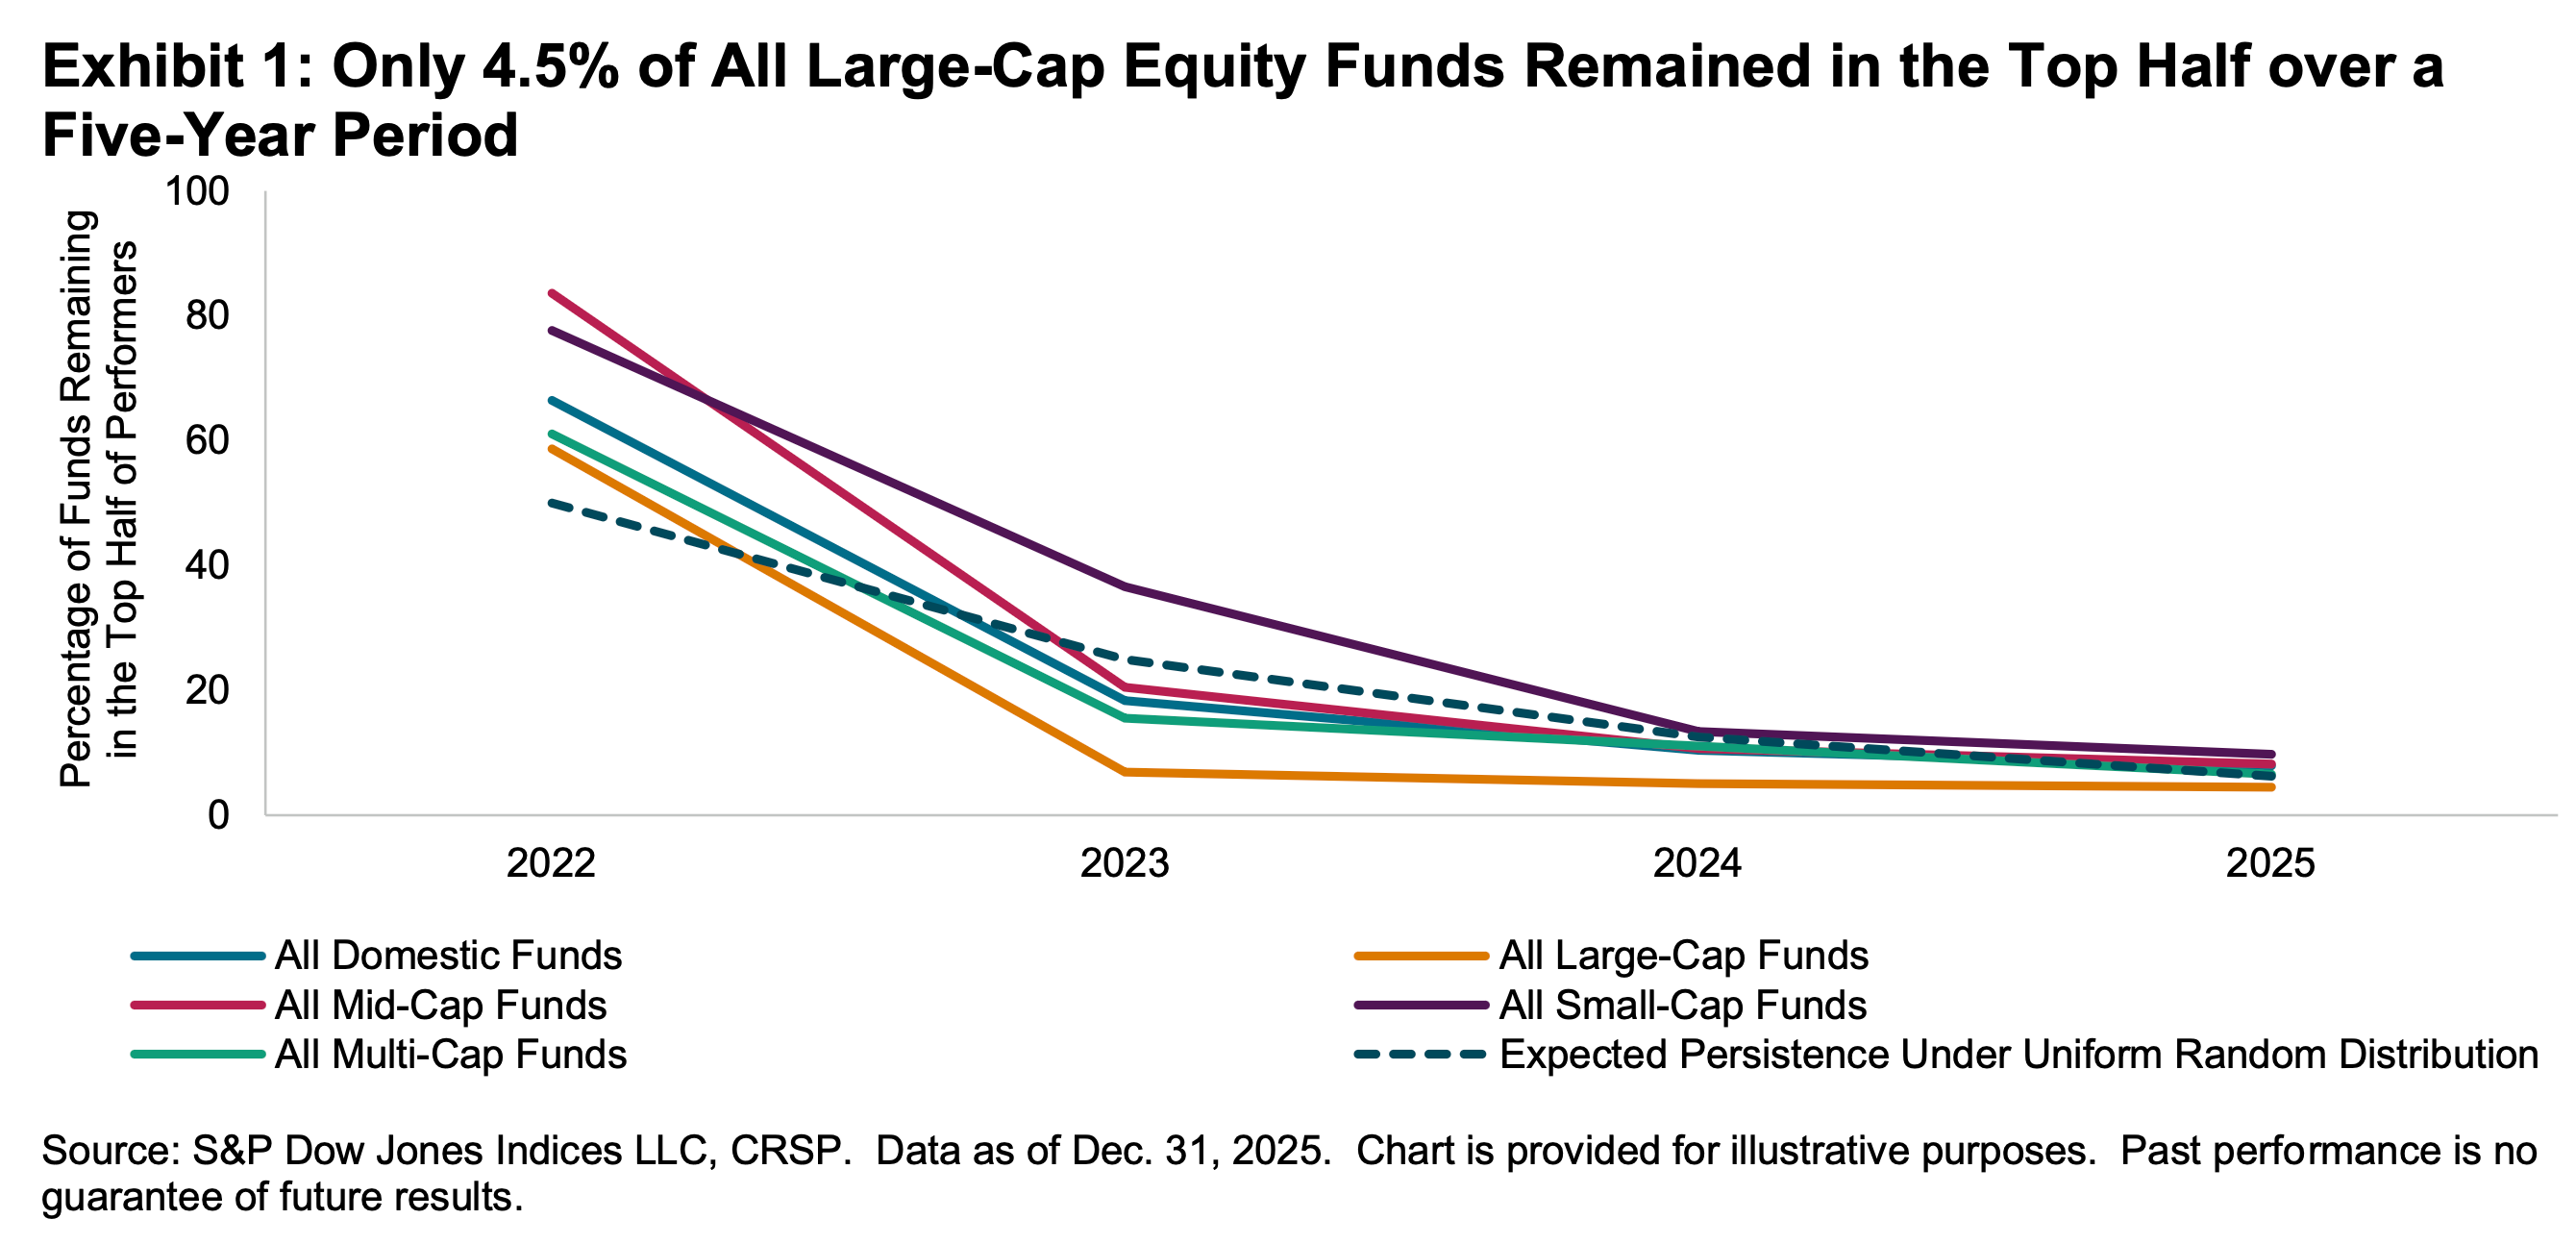
Even if you are a fund manager who generated industry-leading returns in one year, history says it’s an almost insurmountable task to stay on top consistently in subsequent years. According to S&P Dow Jones Indices, of the 334 large-cap equity funds in the top half of performance in 2021, 58.7% remained at the top half in 2022. However, just 6.9% remained on top through 2023. Only 4.5% stayed on top in the five consecutive years through 2025.
It’s much more dismal when you raise the bar. Of the 164 large-cap equity funds in the top quartile in 2021, just 20.1% remained in that category in 2022. That percentage fell to literally 0.0% in 2023.
The odds are stacked against stock pickers 🎲
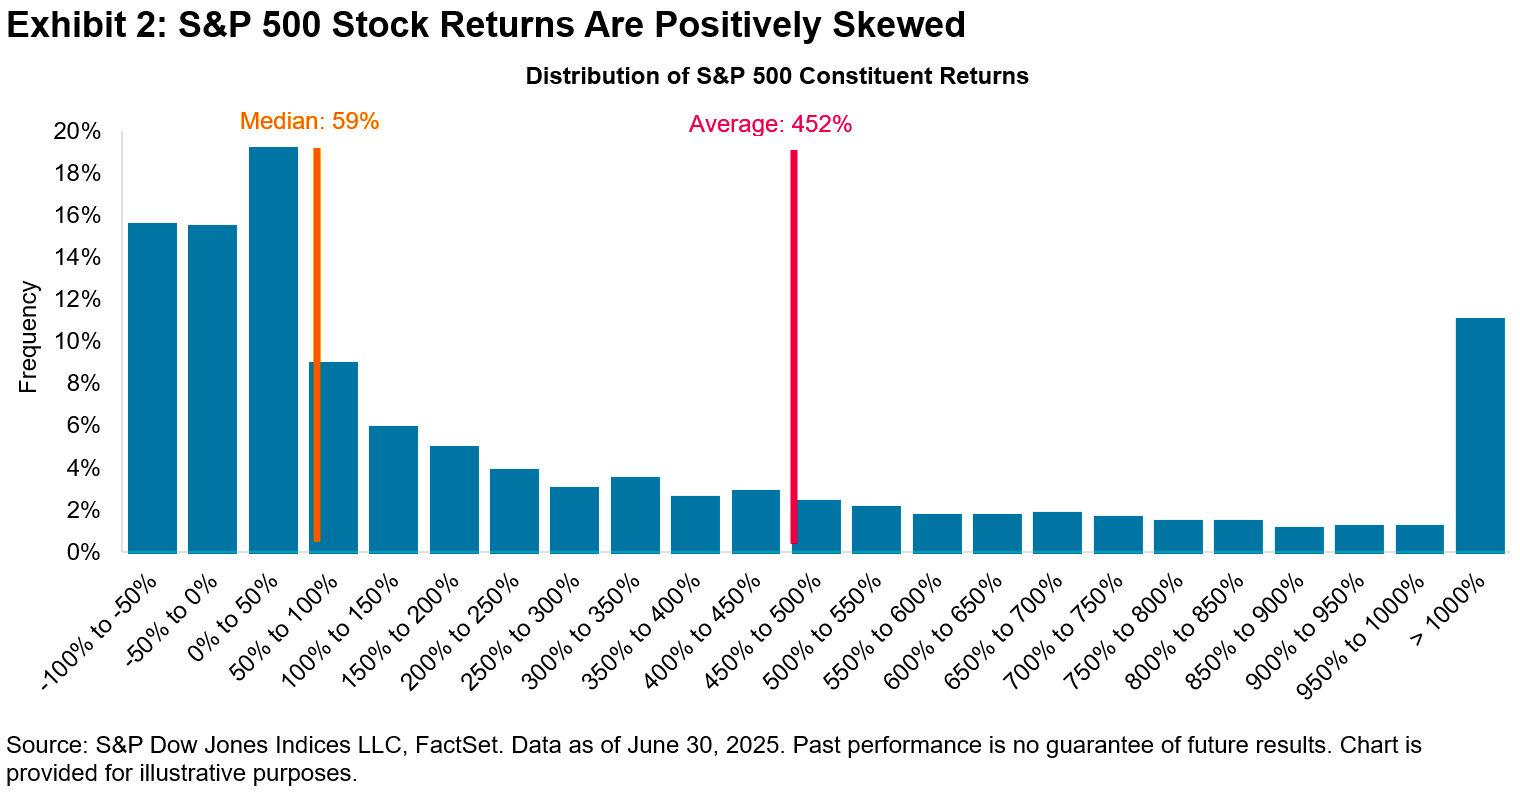
Picking stocks in an attempt to beat market averages is an incredibly challenging and sometimes money-losing effort. Most professional stock pickers aren’t able to do this consistently. One of the reasons for this is that most stocks don’t deliver above-average returns. According to S&P Dow Jones Indices, only 19% of the stocks in the S&P 500 outperformed the average stock’s return from 2001 to 2025. Over this period, the average return on an S&P 500 stock was 452%, while the median stock rose by just 59%.