
Wall Street's 2026 outlook for stocks 🔭
Plus a charted review of the macro crosscurrents 🔀

[UPDATE 12/17/25: This post has been updated with additional targets and strategists’ commentary.]
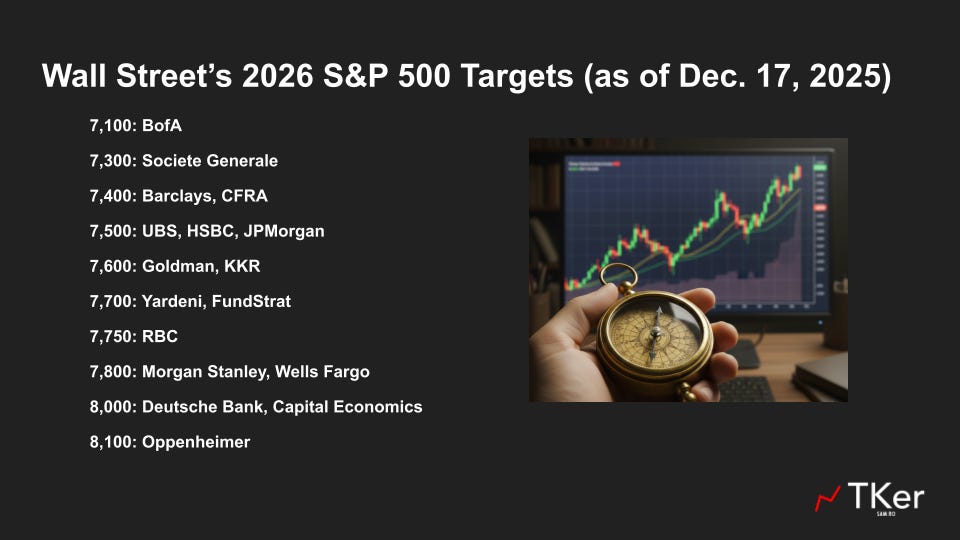
It’s that time of year when Wall Street’s top strategists tell clients where they see the stock market heading in the year ahead.
The strategists followed by TKer have year-end S&P 500 targets ranging from 7,100 to 8,000. This implies returns between 3.3% an…
